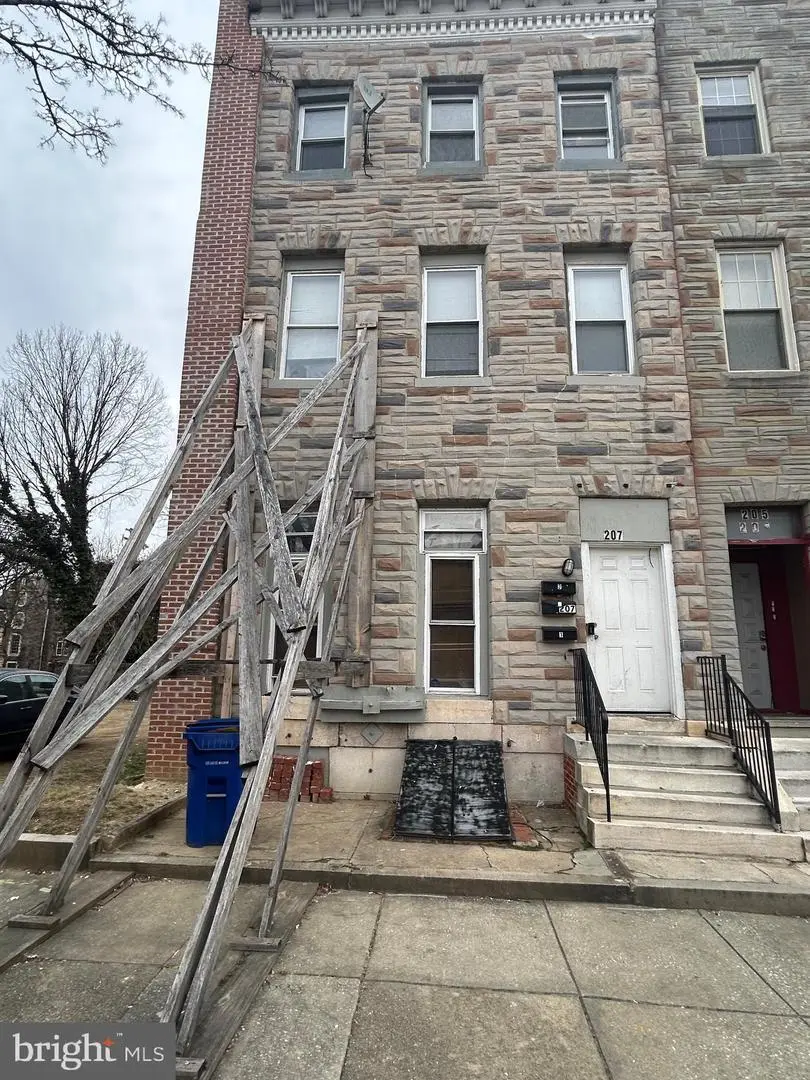
207 N Carey St · Baltimore, MD
Flood risk 1/10 · Minimal
- FEMA flood zone
- X (unshaded)
- Chance of flooding over 30 yrs
- 0.0%
- Est. flood insurance / yr
- $473 – $860
Fire risk 1/10 · Minimal
- Est. fire insurance / yr
- $755 – $1,403
Heat risk 7/10 · Major
- Hot days now (above 103°F)
- 7 days/yr
- Hot days in 30 yrs
- 15 days/yr
Wind risk 6/10 · Moderate
- Chance of severe wind over 30 yrs
- 27.0%
Air-quality risk 4/10 · Minor
- Unhealthy air days now
- 6 days/yr
- Unhealthy air days in 30 yrs
- 7 days/yr
Risk factors via First Street. Map © Google.
Why this score? — see what drove the C+ grade
The composite is a weighted blend of 9 inputs, each scored 0–100. Each bar is that input's sub-score; the figure is the points it added to the 100-point composite (weight × sub-score).
- Cash flow +24.7/30.0
- ARV discount +15.0/15.0
- DSCR +8.0/10.0
- 1% rule +5.1/10.0
- Rent growth +4.4/5.0
- Livability +3.8/5.0
- Condition / age +2.5/5.0
- Schools +1.0/10.0
- Appreciation +0.0/10.0
$229,900
🖨 Deal sheet 📄 Offer letter ✓ Due diligence
Listing remarks MLS
Investor Opportunity: Prime Multi-Unit Overlooking Franklin Square Park Unlock the potential of this classic Baltimore rowhouse! Perfectly positioned in the heart of the Franklin Square Historic District, 207 N. Carey Street presents a golden opportunity for the savvy investor looking to maximize cash flow. This substantial property features three spacious units, each offering 2 bedrooms and 1 bathroom, providing a versatile footprint for high-demand urban living. Step outside your front door and enjoy the lush greenery of Franklin Square Park, an ideal setting for outdoor exercise, morning coffee, or family activities. Inside, the property includes a shared basement housing all utilities and convenient hookups for communal laundry facilities. Its prime location ensures residents are just minutes from Downtown Baltimore, with seamless access to public transportation and major city hubs. Being sold "as-is, " this property is a blank canvas ready for your vision. Whether you are looking to refresh the units for immediate rental or undertake a full custom renovation to increase value, the possibilities are endless. Don't miss out on this high-potential asset in a neighborhood rich with history and charm!
Key facts
- Baltimore rowhouse
- Shared basement
- Downtown baltimore
Tags
Neighborhood map
What this means for you Summary
Snapshot
- This is a 6-bed/?-bath townhouse listed at $230k.
Deal economics
- At list price, monthly cash flow is $480 ($6k/yr) — positive.
- The deal already cash-flows at list — no discount required.
- Meets the 1% rule at list price ($2k rent vs $230k).
- Recommended offer: $202k (12.0% below list) — sets the bar for market timing.
- Cap rate 8.8% vs local median 6.0% in Baltimore — top-decile yield for the area; either an underpriced asset or a hidden risk that comps aren't pricing in. Stress-test before assuming the spread holds.
Location & tenants
- Location reads 76/100 on livability (#90 in MD, #3,396 nationally) — a middle-class / working-renter tenant base. Strengths: amenities A+, commute A+, housing A+; Watch: schools D, crime F.
- Baltimore City Public Schools (urban): math 7% / reading 16% proficiency, ranked #24 of 24 in MD (top 100%) — low school quality limits family demand, transient renter base, plan for 1-2y turnover; 79% free/reduced lunch — lower-income household profile, screen leases tightly.
- Market conditions: Rents rising fast (+7.5%/yr); 422 active listings in the ZIP; 10 comparable units currently listed for rent nearby; rentals at typical pace (median 24d on market — plan ~3-4 weeks tenant-placement turnaround); 1,273 units permitted in Baltimore city in 2024 (1,104 in 5+ unit buildings).
- At $2,317/mo this rent would consume 61% of the median local household income ($46k/yr) (locally 1755% of renters already pay >50% of income on rent) — very limited rent-growth headroom before tenants either downsize or default.
Forward outlook
- Local home prices are declining (-3.0%/yr); year-one equity from $2k of loan paydown is wiped out by about $7k of value loss. Plan a longer hold.
- Baltimore County population projected to shrink 4% by 2050 — rents likely to lag national; underwrite the cash flow, not the appreciation.
- At projected returns (-3.0% appreciation + 7.5% rent growth), your $64k cash investment doubles in ~8 years — after that, you're playing with house money.
Negotiation context
- It's been on market 129 days — a 12% lower offer ($202k) is reasonable based on typical stale-listing flexibility.
- 9 sale attempts since 17y ago; this cycle's ask has dropped $20k (8%) from the opening price — seller is motivated, your offer sets the floor, not the list.
- Current owner paid $20k; list at $230k implies a 1079% gain — meaningful room to come down on a strong offer.
Risks & watch-outs
- Watch-outs: built in 1900 — expect roof / HVAC / electrical / plumbing capex.
- Climate carrying-cost: major wind risk, 27% chance of damaging wind over 30y; extreme-heat days projected 7→15/yr by 2055 (HVAC capex compounding) — expect insurance premiums to compound above CPI over the hold.
Questions for the listing agent
- It's been on market 129 days. Have you received any prior offers? Is the seller open to a 12% concession, seller financing, or rate buy-down credit?
- Built in 1900 — when were the roof, HVAC, electrical panel, plumbing, and water heater last replaced?
- Why hasn't it sold? Are there any deal-killer items the seller is aware of (foundation, flood, title, zoning, code violations)?
- Is there a deadline driving the sale (1031 exchange, divorce, estate, relocation)? That informs how much negotiation room exists.
- Schools are D-rated, which usually means shorter tenancies and higher turnover. Who's the typical renter profile here, and what's been the actual vacancy rate?
- Crime grade is F in this area — have there been break-ins, vandalism, or insurance claims at this property in the last 3 years? What carrier currently insures it and at what premium?
- What's the average days-on-market for RENTAL listings here right now (not sales)? A rising rental-DOM trend means longer vacancies and softer asking-rent achievability than the comps imply.
- What's the recent tenant-quality profile in this submarket — average credit score on applications, eviction rate, late-payment / NSF rate, and stable-employment percentage? A property-management company in the area should have these aggregated.
- How much new for-sale + rental construction is in the pipeline within 1–3 miles? Heavy new supply typically softens prices + rents 12–24 months out; constrained supply supports both.
Investment metrics
- 1% rule
- 1.01% ✓
- Cap rate
- 8.80%
- Cash-on-cash
- 8.95%
- DSCR
- 1.40
- GRM
- 8.3
CMA / ARV
- ARV (median comp)
- $277,436
- List price
- $229,900
- Delta
- -17.13%
- Verdict
- UNDERPRICED
- Comps
- 20 within 1.0 mi
Show comp detail 12 sales within ~0.75 mi
| Address | Dist | Beds/Ba | Sqft | Sold | Price | $/sf | Match |
|---|---|---|---|---|---|---|---|
| 1719 W Fayette St | 0.36mi | 6/1.0 | 2,343 | 4mo | $20,000 | $9 | 67 |
| 537 N Carrollton Ave | 0.29mi | 5/4.0 (-1) | — | 4mo | $120,000 | — | 66 |
| 1217 W Lanvale St | 0.45mi | 5/3.5 (-1) | 3,654 | 2mo | $364,000 | $100 | 60 |
| 1013 Harlem Ave | 0.42mi | 5/3.5 (-1) | 2,117 | 4mo | $170,000 | $80 | 59 |
| 708 N Gilmor St | 0.47mi | 5/4.5 (-1) | 3,135 | 2mo | $275,000 | $88 | 59 |
| 1715 W Lombard St | 0.49mi | 6/2.0 | 2,500 | 8mo | $220,000 | $88 | 58 |
| 754 Dolphin St | 0.51mi | 5/2.0 (-1) | 1,842 | 3mo | $164,000 | $89 | 56 |
| 737 Dolphin St | 0.53mi | 5/3.5 (-1) | 2,580 | 3mo | $325,000 | $126 | 55 |
| 721 W Lafayette Ave | 0.60mi | 5/4.0 (-1) | 2,857 | 0mo | $196,000 | $69 | 54 |
| 1143 Myrtle Ave | 0.60mi | 6/3.0 | 1,340 | 9mo | $299,000 | $223 | 52 |
| 1835 W Baltimore St | 0.49mi | 5/3.0 (-1) | — | 10mo | $135,000 | — | 51 |
| 321-323 S Monroe St | 0.68mi | 5/2.0 (-1) | — | 5mo | $40,000 | — | 47 |
Match score weights: distance 35% · size 25% · config 20% · recency 20%. Top-matched comps best support the ARV.
Projected returns pro-forma
-3.0% appreciation · 7.51% rent growth · sell at horizon
- IRR
- 1.6%
- Equity multiple
- 1.07×
- Total profit
- $4,210
- Equity at exit
- $34,279
- IRR
- 14.9%
- Equity multiple
- 2.43×
- Total profit
- $92,110
- Equity at exit
- $19,878
Cash invested: $64,372 (down + closing). Projections, not guarantees.
Landlord ↔ Tenant lean methodology
- Overall (CITY)
- 12 Strongly Tenant-Friendly
- State Maryland
- 27 Tenant-Leaning · D+14
- County
- — inherits STATE
- City Baltimore
- 12 Strongly Tenant-Friendly · D+58
ZIP-level market 21223
- Rents YoY
- 7.5%
- Active inventory
- 422
- Price-to-rent
- 8.3×
Monthly cashflow live
- Estimated rent
- $2,317 high interval (Pro) →
- Mortgage (P&I)
- −$1,206
- Tax from tax record
- −$49 /mo · $587/yr
- Insurance
- −$96
- HOA
- −$0
- Vacancy / Maint / Mgmt
- −$487
- Net cashflow
- $480
Break-even live
UW: 25.0% down · 7.5% · 30yr · 1.5% tax · 5.0% vac · 8.0% maint · 8.0% mgmt
Financing live
Cash to close
- Down payment
- $57,475
- Closing costs
- $6,897
- Reserves months
- —
- Total cash needed
- —
Loan-product check · same deal, 3 products live
Conventional
25% down · 7.5% · 30yr
- Down + closing
- —
- Monthly P&I
- —
- Monthly cashflow
- —
- DSCR
- —
- Eligible?
- —
Personal DTI + credit; lowest rate.
DSCR
20% down · 8.5% · 30yr
- Down + closing
- —
- Monthly P&I
- —
- Monthly cashflow
- —
- DSCR
- —
- Eligible?
- —
No personal income docs; deal must DSCR.
Hard money
10% down · 12.0% · 12mo
- Down + closing
- —
- Monthly P&I
- —
- Monthly cashflow
- —
- DSCR
- —
- Eligible?
- —
Short-term bridge; refi at stabilization.
Rent comps 10 comps
| Address | Beds | Baths | Sqft | Rent | $/sqft | DOM | Units | Dist |
|---|---|---|---|---|---|---|---|---|
| 1623 W Lexington St Baltimore, MD | 5.0 | 2.5 | — | $2,600 | — | 23d | 1 | 0.29mi |
| 610 Scott St Baltimore, MD | 5.0 | 3.0 | 1700 | $2,750 | $1.62 | 12d | 1 | 0.80mi |
| 311 S Pulaski St Baltimore, MD | 5.0 | 3.0 | 1450 | $2,400 | $1.66 | 43d | 1 | 0.80mi |
| 311 S Pulaski St Baltimore, MD | 5.0 | 3.0 | 1450 | $2,400 | $1.66 | 3d | 1 | 0.80mi |
| 2101 McHenry St Baltimore, MD | 6.0 | 2.0 | — | $550 | — | 43d | 1 | 0.81mi |
| 1246 Cleveland St Baltimore, MD | 5.0 | 2.5 | — | $1,850 | — | 23d | 1 | 0.81mi |
| 1108 N Fulton Ave Baltimore, MD | 5.0 | 5.0 | — | $800 | — | 23d | 1 | 0.83mi |
| 426 Mosher St Baltimore, MD | 6.0 | 3.0 | — | $3,495 | — | 4d | 1 | 0.97mi |
| 1412 Madison Ave Baltimore, MD | 5.0 | 2.5 | — | $2,800 | — | 21d | 1 | 1.03mi |
| 1417 Madison Ave Baltimore, MD | 5.0 | 2.5 | — | $2,950 | — | 43d | 1 | 1.06mi |
Listing history 47 events
-
2026-06-18days on market $229,900 Active 129 DOM
-
2026-06-17days on market $229,900 Active 128 DOM
-
2026-06-16days on market $229,900 Active 127 DOM
-
2026-06-15days on market $229,900 Active 126 DOM
-
2026-06-13days on market $229,900 Active 124 DOM
-
2026-06-09days on market $229,900 Active 120 DOM
-
2026-06-08days on market $229,900 Active 119 DOM
-
2026-06-07days on market $229,900 Active 118 DOM
-
2026-06-04days on market $229,900 Active 115 DOM
-
2026-06-03days on market $229,900 Active 114 DOM
-
2026-06-02days on market $229,900 Active 113 DOM
-
2026-06-01days on market $229,900 Active 112 DOM
-
2026-05-31days on market $229,900 Active 111 DOM
-
2026-03-23price $229,900 1230-char remark
Show marketing remark (1230 chars)
Investor Opportunity: Prime Multi-Unit Overlooking Franklin Square Park Unlock the potential of this classic Baltimore rowhouse! Perfectly positioned in the heart of the Franklin Square Historic District, 207 N. Carey Street presents a golden opportunity for the savvy investor looking to maximize cash flow. This substantial property features three spacious units, each offering 2 bedrooms and 1 bathroom, providing a versatile footprint for high-demand urban living. Step outside your front door and enjoy the lush greenery of Franklin Square Park, an ideal setting for outdoor exercise, morning coffee, or family activities. Inside, the property includes a shared basement housing all utilities and convenient hookups for communal laundry facilities. Its prime location ensures residents are just minutes from Downtown Baltimore, with seamless access to public transportation and major city hubs. Being sold "as-is, " this property is a blank canvas ready for your vision. Whether you are looking to refresh the units for immediate rental or undertake a full custom renovation to increase value, the possibilities are endless. Don't miss out on this high-potential asset in a neighborhood rich with history and charm!
-
2026-02-09$249,900 Active 1230-char remark
Show marketing remark (1230 chars)
Investor Opportunity: Prime Multi-Unit Overlooking Franklin Square Park Unlock the potential of this classic Baltimore rowhouse! Perfectly positioned in the heart of the Franklin Square Historic District, 207 N. Carey Street presents a golden opportunity for the savvy investor looking to maximize cash flow. This substantial property features three spacious units, each offering 2 bedrooms and 1 bathroom, providing a versatile footprint for high-demand urban living. Step outside your front door and enjoy the lush greenery of Franklin Square Park, an ideal setting for outdoor exercise, morning coffee, or family activities. Inside, the property includes a shared basement housing all utilities and convenient hookups for communal laundry facilities. Its prime location ensures residents are just minutes from Downtown Baltimore, with seamless access to public transportation and major city hubs. Being sold "as-is, " this property is a blank canvas ready for your vision. Whether you are looking to refresh the units for immediate rental or undertake a full custom renovation to increase value, the possibilities are endless. Don't miss out on this high-potential asset in a neighborhood rich with history and charm!
-
2010-11-18price Withdrawn
-
2010-11-18historical
-
2010-11-18price
-
2010-11-18historical
-
2010-10-26price
-
2010-10-21price
-
2010-10-18historical Withdrawn
-
2010-10-13price
-
2010-09-27price
-
2010-09-03price
-
2010-08-30price
-
2010-08-14Active
-
2010-08-13$179,000
-
2010-08-05Active
-
2010-01-26price $19,500 Sold
-
2010-01-26soldstatus $19,500 Sold
-
2010-01-26soldstatus $19,500
-
2010-01-15status Contract
-
2010-01-10historical
-
2010-01-05price $19,900
-
2010-01-02status Active
-
2010-01-01historical
-
2009-12-09price $22,500
-
2009-12-01status Active
-
2009-11-03status Contract
-
2009-07-23price $24,900 Active
-
2009-07-23status Active
-
2009-06-25historical
-
2009-05-29price $29,900
-
2009-05-13$35,000
-
2009-05-13$19,500
-
1986-03-20soldstatus $8,000
ⓘ Source: listings_history table (triggers on properties + properties_extension) + one-shot
backfill from property_details.listing_events for pre-trigger history.
Tax reassessment forecast MD · Partial reset (capped growth)
- Current annual tax
- $587 · $49/mo
- Projected year-2 tax
- $1,547 · $129/mo
- Expected delta
- +$959/yr (+$80/mo · 163.4%)
ⓘ Screening estimate from a state-policy table — verify with the county assessor before closing.
Climate risk First Street
- Flood 1/10 Low FEMA zone X (unshaded) · 0% chance over 30 yrs
- Wildfire 1/10 Low
- Heat 7/10 Severe 7 d/yr ≥103°F today · 15 d/yr by 30 yrs out
- Wind 6/10 Major 27% chance of damaging wind over 30 yrs
- Air quality 4/10 Moderate 6 unhealthy d/yr today · 7 by 30 yrs out
Nearby sold comps map
Loading sold comps map…
Walkable amenities ~0.75 mi
Loading nearby amenities…
Taxation est. · year 1
- Rental income
- $27,806
- − Mortgage interest
- −$12,878
- − Property taxes
- −$587
- − Insurance
- −$1,150
- − Repairs & maintenance
- −$2,224
- − Management
- −$2,224
- − Depreciation
- −$6,688
- Taxable income
- $2,054
- Est. tax owed @ 24.0%
- −$493
- After-tax cash flow
- $5,269/yr
For passive investors: Depreciation is non-cash, so a rental often shows a tax loss while cash-flowing — sheltering income. Rental losses are passive: they offset passive income freely, and up to $25,000/yr can offset ordinary (W-2) income if you actively participate and your MAGI is under $100k (phasing out to $0 by $150k); unused losses carry forward. On sale, claimed depreciation is recaptured at up to 25%, and gains may owe capital-gains tax (a 1031 exchange can defer both). Figures are a year-1 estimate at your 24.0% rate — not tax advice; consult a CPA.
Schools (NCES district)
- District
- Baltimore City Public Schools
- NCES district ID
- 2400090
- Math proficiency
- 7% ▼ -9.00%
- Reading proficiency
- 16% ▼ -5.00%
- Median HH income
- $42,108
- Composite
- 10.08/100
- National rank
- #9805
- State rank
- #24 of 24 in MD
Livability — Baltimore
- Score
- 76/100
- State rank
- #90
- US rank
- #3396
Category grades
Schools grade is shown separately in the Schools card above.
Census & demographics
- Census place
- Baltimore, MD
- County
- Baltimore City · 558,601 people
- City population
- 588,727
- Metro
- Baltimore-Columbia-Towson, MD
- Population (ZIP)
- 19,572
- Household income
- $45,840
- Rent vs Own
- Severe rent burden
- 1755.0
Population outlook (Baltimore County) Hauer SSP2
- Today (2025)
- 624,249 people
- By 2030
- 621,541 · -0.4%
- By 2040
- 609,756 · -2.3%
- By 2050
- 597,249 · -4.3%
- By 2075
- 552,236 · -11.5%
- By 2100
- 513,934 · -17.7%
Race, ethnicity, and origin ACS 2023
- Neighborhood character
- Predominantly Black (72%)
- Race & ethnicity
- Black 72% White 16% Hispanic / Latino 7% Two or more races 6% Asian 1%
- Hispanic origin (detail)
- Mexican 3% Puerto Rican 1%
- Common ancestry
- Romanian 1%
- Foreign-born
- 8% · Canada
- Languages at home
- 90% English-only · Spanish 6% French/Haitian/Cajun 2% Other Indo-European 1%
Political lean MEDSL · Baltimore
- 2024 margin
- Solid D (+73.0) · D 85.2% · R 12.2% · Other 2.6%
- 2008→2024 swing
- -2.5pp toward R · 2008: 75.5pp · 2024: 73.0pp
- All cycles
- 2024: D+73.0 2020: D+76.6 2016: D+74.6 2012: D+76.4 2008: D+75.5
Not yet ingested
- Civics
- —
Market trends
- HPI YoY
- ▼ -97.99%
- Current HPI
- 140.5836
- Rent YoY
- ▲ 7.51%
- Metro
- Baltimore-Columbia-Towson, MD
- State GDP YoY
- ▲ 2.97%
- F500 in state
- 12
Industry mix (Fortune 500 HQ in MD)
| Industry | F500 HQs | Revenue |
|---|---|---|
| Aerospace / Defense | 1 | $71B |
|
||
| Utilities | 1 | $25B |
|
||
| Hotels | 1 | $24B |
|
||
| Consumer Goods | 1 | $7B |
|
||
| Real Estate | 1 | $6B |
|
||
| Chemicals | 1 | $2B |
|
||
Price history
+2773.8% since first listed34 events — show timeline
- 2026-03-23 Price Changed $229,900 BRIGHT MLS
- 2026-02-09 Listed $249,900 BRIGHT MLS
- 2010-11-18 Price Changed — MRIS
- 2010-11-18 Delisted — MRIS
- 2010-11-18 Price Changed — MRIS
- 2010-11-18 Listing Removed — BRIGHT MLS
- 2010-10-26 Price Changed — MRIS
- 2010-10-21 Price Changed — MRIS
- 2010-10-18 Delisted — MRIS
- 2010-10-13 Price Changed — MRIS
- 2010-09-27 Price Changed — MRIS
- 2010-09-03 Price Changed — MRIS
- 2010-08-30 Price Changed — MRIS
- 2010-08-14 Listed — MRIS
- 2010-08-13 Listed $179,000 BRIGHT MLS
- 2010-08-05 Listed — MRIS
- 2010-01-26 Sold (MLS) $19,500 BRIGHT MLS
- 2010-01-26 Sold (MLS) $19,500 MRIS
- 2010-01-26 Price Changed $19,500 MRIS
- 2010-01-15 Pending — MRIS
- 2010-01-10 Listing Removed — BRIGHT MLS
- 2010-01-05 Price Changed $19,900 MRIS
- 2010-01-02 Relisted — MRIS
- 2010-01-01 Delisted — MRIS
- 2009-12-09 Price Changed $22,500 MRIS
- 2009-12-01 Relisted — MRIS
- 2009-11-03 Pending — MRIS
- 2009-07-23 Relisted — MRIS
- 2009-07-23 Price Changed $24,900 MRIS
- 2009-06-25 Delisted — MRIS
- 2009-05-29 Price Changed $29,900 MRIS
- 2009-05-13 Listed $35,000 MRIS
- 2009-05-13 Listed $19,500 BRIGHT MLS
- 1986-03-20 Sold (Public Records) $8,000 Public Records
Property tax history
+7.4%/yrLatest (2025): $587 · +0.0% YoY. Source: county tax records.
Cash-flow waterfall
monthlySold comps — $/sqft
last 12 mo · ≤1 miLoading sold comps…