12 County Road 1220 · Daingerfield, TX
Flood risk 1/10 · Minimal
- FEMA flood zone
- X
- Chance of flooding over 30 yrs
- 0.0%
- Est. flood insurance / yr
- $507 – $1,088
Fire risk 5/10 · Moderate
- Est. fire insurance / yr
- $1,222 – $2,270
Heat risk 7/10 · Major
- Hot days now (above 112°F)
- 7 days/yr
- Hot days in 30 yrs
- 23 days/yr
Wind risk 6/10 · Moderate
- Chance of severe wind over 30 yrs
- 27.0%
Air-quality risk 2/10 · Minimal
- Unhealthy air days now
- 0 days/yr
- Unhealthy air days in 30 yrs
- 1 days/yr
Risk factors via First Street. Map © Google.
Why this score? — see what drove the B grade
The composite is a weighted blend of 9 inputs, each scored 0–100. Each bar is that input's sub-score; the figure is the points it added to the 100-point composite (weight × sub-score).
- Cash flow +30.0/30.0
- 1% rule +10.0/10.0
- DSCR +10.0/10.0
- ARV discount +7.5/15.0
- Appreciation +6.6/10.0
- Livability +3.4/5.0
- Rent growth +2.5/5.0
- Condition / age +2.5/5.0
- Schools +2.3/10.0
$38,799
🖨 Deal sheet (PDF) 📄 Offer letter ✓ Due diligence
Listing remarks MLS
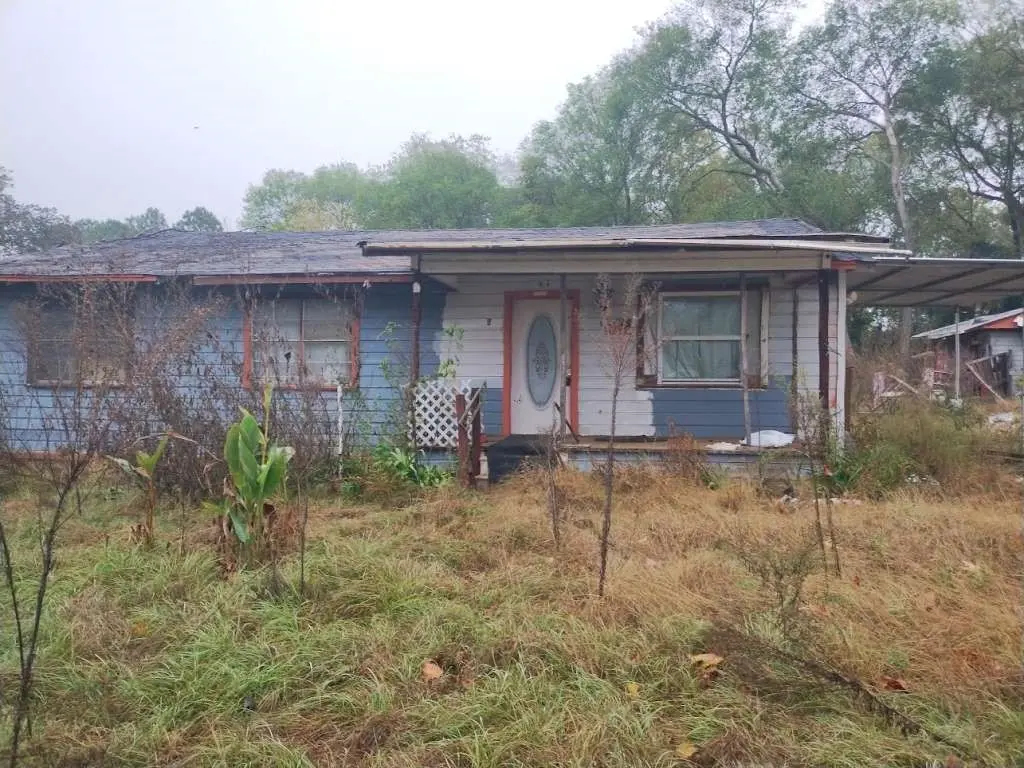
FIXER UPPER! We just listed this home within a small community available in the Daingerfield area. The home does need a bit of work and some renovations, but it has a great living space you can build off of. With 1,232 square feet, you can quickly transform it into a fantastic home. This property sits on a LARGE LOT which is nearly half an acre (19,602 Sq. Ft.). Here you will be directly off of TX-11 and approximately two hours away from Dallas. WE MAKE IT EASY TO OWN. This is a great opportunity! Don't wait, call us today to get more information on the owner's easy terms and smooth process that may be able to put the deed in your name and make this your dream home.
Key facts
- Large lot
- Great living space
- 0.45 acre lot
Tags
Neighborhood map
What this means for you Summary
Snapshot
- This is a 3-bed/1.0-bath single-family listed at $39k.
Deal economics
- At list price, monthly cash flow is $642 ($8k/yr) — positive.
- The deal already cash-flows at list — no discount required.
- Meets the 1% rule at list price ($1k rent vs $39k).
- Recommended offer: $34k (12.0% below list) — sets the bar for market timing.
- Cap rate 26.1% vs local median 3.5% in Daingerfield — top-decile yield for the area; either an underpriced asset or a hidden risk that comps aren't pricing in. Stress-test before assuming the spread holds.
Location & tenants
- Location reads 67/100 on livability (#536 in TX) — a middle-class / working-renter tenant base. Strengths: cost of living A+, housing A+, health & safety A+; Watch: crime F, amenities F, commute F.
- Daingerfield-Lone Star ISD (town): math 24% / reading 32% proficiency, ranked #679 of 826 in TX (top 82%) — low school quality limits family demand, transient renter base, plan for 1-2y turnover; 71% free/reduced lunch — lower-income household profile, screen leases tightly.
- Zoned schools: West El (270 students, 90% FRL); Daingerfield J H (math 26% / reading 30%, grade F, #1,143 of 1,662 statewide, top 69%, 228 students, 86% FRL); Daingerfield H S (math 12% / reading 47%, grade F, #1,112 of 1,632 statewide, top 70%, 297 students, 83% FRL) — zoned schools average 86% FRL vs 71% district-wide (16 pts higher); higher-poverty schools than district average — tighter screening recommended.
- Market conditions: 86 active listings in the ZIP; 3 units permitted in Morris County in 2024 (0 in 5+ unit buildings).
Forward outlook
- In year one you build about $1k of equity ($268 loan paydown + $1k appreciation (3.1% local appreciation)).
- Morris County population projected at -19% by 2050 — secular population decline; favor cash flow + early exit over multi-decade hold.
- At projected returns (3.1% appreciation + 3.0% rent growth), your $11k cash investment doubles in ~2 years — after that, you're playing with house money.
Negotiation context
- It's been on market 151 days — a 12% lower offer ($34k) is reasonable based on typical stale-listing flexibility.
Risks & watch-outs
- Climate carrying-cost: major wind risk, 27% chance of damaging wind over 30y; moderate wildfire risk; extreme-heat days projected 7→23/yr by 2055 (HVAC capex compounding) — expect insurance premiums to compound above CPI over the hold.
Questions for the listing agent
- It's been on market 151 days. Have you received any prior offers? Is the seller open to a 12% concession, seller financing, or rate buy-down credit?
- Built in 1967 — when were the roof, HVAC, electrical panel, plumbing, and water heater last replaced?
- Why hasn't it sold? Are there any deal-killer items the seller is aware of (foundation, flood, title, zoning, code violations)?
- Is there a deadline driving the sale (1031 exchange, divorce, estate, relocation)? That informs how much negotiation room exists.
- Schools are F-rated, which usually means shorter tenancies and higher turnover. Who's the typical renter profile here, and what's been the actual vacancy rate?
- Crime grade is F in this area — have there been break-ins, vandalism, or insurance claims at this property in the last 3 years? What carrier currently insures it and at what premium?
- What's the average days-on-market for RENTAL listings here right now (not sales)? A rising rental-DOM trend means longer vacancies and softer asking-rent achievability than the comps imply.
- What's the recent tenant-quality profile in this submarket — average credit score on applications, eviction rate, late-payment / NSF rate, and stable-employment percentage? A property-management company in the area should have these aggregated.
- How much new for-sale + rental construction is in the pipeline within 1–3 miles? Heavy new supply typically softens prices + rents 12–24 months out; constrained supply supports both.
Investment metrics
- 1% rule
- 2.84% ✓
- Cap rate
- 26.15%
- Cash-on-cash
- 70.91%
- DSCR
- 4.16
- GRM
- 2.9
CMA / ARV
No comps found within radius.
Projected returns pro-forma
3.11% appreciation · 3.0% rent growth · sell at horizon
- IRR
- 75.6%
- Equity multiple
- 5.21×
- Total profit
- $45,779
- Equity at exit
- $17,685
- IRR
- 75.0%
- Equity multiple
- 10.70×
- Total profit
- $105,386
- Equity at exit
- $27,443
Cash invested: $10,864 (down + closing). Projections, not guarantees.
Landlord ↔ Tenant lean methodology
- Overall (STATE)
- 87 Strongly Landlord-Friendly
- State Texas
- 87 Strongly Landlord-Friendly · R+5
- County
- — inherits STATE
- City
- — inherits STATE
ZIP-level market 75638
- Home prices YoY
- 1.7%
- Active inventory
- 86
- Price-to-rent
- 2.9×
Monthly cashflow live
- Estimated rent
- $1,103 medium interval (Pro) →
- Mortgage (P&I)
- −$203
- Tax from tax record
- −$10 /mo · $120/yr
- Insurance
- −$16
- HOA
- −$0
- Vacancy / Maint / Mgmt
- −$232
- Net cashflow
- $642
Break-even live
Sensitivity live
| Price | -10% $664 | -5% $653 | +0% $642 | +5% $631 | +10% $620 |
|---|---|---|---|---|---|
| Rent | -10% $555 | -5% $598 | +0% $642 | +5% $686 | +10% $729 |
| Rate | -1.0pp $662 | -0.5pp $652 | base $642 | +0.5pp $632 | +1.0pp $622 |
UW: 25.0% down · 7.5% · 30yr · 1.5% tax · 5.0% vac · 8.0% maint · 8.0% mgmt
Financing live
Cash to close
- Down payment
- $9,700
- Closing costs
- $1,164
- Reserves months
- —
- Total cash needed
- —
Loan-product check · same deal, 3 products live
Conventional
25% down · 7.5% · 30yr
- Down + closing
- —
- Monthly P&I
- —
- Monthly cashflow
- —
- DSCR
- —
- Eligible?
- —
Personal DTI + credit; lowest rate.
DSCR
20% down · 8.5% · 30yr
- Down + closing
- —
- Monthly P&I
- —
- Monthly cashflow
- —
- DSCR
- —
- Eligible?
- —
No personal income docs; deal must DSCR.
Hard money
10% down · 12.0% · 12mo
- Down + closing
- —
- Monthly P&I
- —
- Monthly cashflow
- —
- DSCR
- —
- Eligible?
- —
Short-term bridge; refi at stabilization.
Listing history 23 events
-
2026-06-21days on market $38,799 Active 151 DOM
-
2026-06-19days on market $38,799 Active 149 DOM
-
2026-06-18days on market $38,799 Active 148 DOM
-
2026-06-17days on market $38,799 Active 147 DOM
-
2026-06-16days on market $38,799 Active 146 DOM
-
2026-06-15days on market $38,799 Active 145 DOM
-
2026-06-14days on market $38,799 Active 143 DOM
-
2026-06-12days on market $38,799 Active 142 DOM
-
2026-06-09days on market $38,799 Active 139 DOM
-
2026-06-08days on market $38,799 Active 138 DOM
-
2026-06-07days on market $38,799 Active 137 DOM
-
2026-06-07days on market $38,799 Active 136 DOM
-
2026-06-02days on market $38,799 Active 132 DOM
-
2026-06-01days on market $38,799 Active 131 DOM
-
2026-05-31days on market $38,799 Active 130 DOM
-
2026-05-30days on market $38,799 Active 129 DOM
-
2026-01-21$38,799 Active 674-char remark
Show marketing remark (674 chars)
FIXER UPPER! We just listed this home within a small community available in the Daingerfield area. The home does need a bit of work and some renovations, but it has a great living space you can build off of. With 1,232 square feet, you can quickly transform it into a fantastic home. This property sits on a LARGE LOT which is nearly half an acre (19,602 Sq. Ft.). Here you will be directly off of TX-11 and approximately two hours away from Dallas. WE MAKE IT EASY TO OWN. This is a great opportunity! Don't wait, call us today to get more information on the owner's easy terms and smooth process that may be able to put the deed in your name and make this your dream home.
-
2007-06-06soldstatus
-
2006-09-14soldstatus
-
1997-05-22soldstatus
-
1997-04-14soldstatus
-
1989-06-02soldstatus
-
1966-04-14soldstatus
ⓘ Source: listings_history table (triggers on properties + properties_extension) + one-shot
backfill from property_details.listing_events for pre-trigger history.
Tax reassessment forecast TX · Resets to sale price
- Current annual tax
- $120 · $10/mo
- Projected year-2 tax
- $710 · $59/mo
- Expected delta
- +$590/yr (+$49/mo · 490.1%)
ⓘ Screening estimate from a state-policy table — verify with the county assessor before closing.
Climate risk First Street
- Flood 1/10 Low FEMA zone X · 0% chance over 30 yrs
- Wildfire 5/10 Major
- Heat 7/10 Severe 7 d/yr ≥112°F today · 23 d/yr by 30 yrs out
- Wind 6/10 Major 27% chance of damaging wind over 30 yrs
- Air quality 2/10 Low 0 unhealthy d/yr today · 1 by 30 yrs out
Nearby sold comps map
Loading sold comps map…
Walkable amenities ~0.75 mi
Loading nearby amenities…
Taxation est. · year 1
- Rental income
- $13,240
- − Mortgage interest
- −$2,173
- − Property taxes
- −$120
- − Insurance
- −$194
- − Repairs & maintenance
- −$1,059
- − Management
- −$1,059
- − Depreciation
- −$1,129
- Taxable income
- $7,505
- Est. tax owed @ 24.0%
- −$1,801
- After-tax cash flow
- $5,902/yr
For passive investors: Depreciation is non-cash, so a rental often shows a tax loss while cash-flowing — sheltering income. Rental losses are passive: they offset passive income freely, and up to $25,000/yr can offset ordinary (W-2) income if you actively participate and your MAGI is under $100k (phasing out to $0 by $150k); unused losses carry forward. On sale, claimed depreciation is recaptured at up to 25%, and gains may owe capital-gains tax (a 1031 exchange can defer both). Figures are a year-1 estimate at your 24.0% rate — not tax advice; consult a CPA.
Schools (NCES district)
- District
- Daingerfield-Lone Star ISD
- NCES district ID
- 4816180
- Math proficiency
- 24% ▼ -11.00%
- Reading proficiency
- 32% ▼ -4.00%
- Median HH income
- $39,097
- Composite
- 23.48/100
- National rank
- #7877
- State rank
- #679 of 826 in TX
Livability — Daingerfield
- Score
- 67/100
- State rank
- #536
- US rank
- #10463
Category grades
Schools grade is shown separately in the Schools card above.
Census & demographics
- Population (ZIP)
- 5,363
Population outlook (Morris County) Hauer SSP2
- Today (2025)
- 11,628 people
- By 2030
- 11,126 · -4.3%
- By 2040
- 10,181 · -12.4%
- By 2050
- 9,408 · -19.1%
- By 2075
- 8,268 · -28.9%
- By 2100
- 7,463 · -35.8%
Race, ethnicity, and origin ACS 2023
- Neighborhood character
- Diverse neighborhood (Simpson 0.60)
- Race & ethnicity
- White 59% Black 20% Hispanic / Latino 13% Two or more races 11% Asian 2%
- Hispanic origin (detail)
- Mexican 12%
- Common ancestry
- Scottish 4% Italian 2% Lithuanian 1%
- Foreign-born
- 6% · Canada, Vietnam
- Languages at home
- 87% English-only · Spanish 10% Vietnamese 1% Russian/Polish/Slavic 1%
Political lean MEDSL · Morris
- 2024 margin
- Solid R (+51.2) · D 24.1% · R 75.3%
- 2008→2024 swing
- -30.2pp toward R · 2008: -21.0pp · 2024: -51.2pp
- All cycles
- 2024: R+51.2 2020: R+39.4 2016: R+40.6 2012: R+26.7 2008: R+21.0
Not yet ingested
- Civics
- —
Market trends
- HPI YoY
- ▲ 3.11%
- Current HPI
- 186.7313
- Rent YoY
- —
- Metro
- —
- State GDP YoY
- ▲ 3.95%
- F500 in state
- 110
Industry mix (Fortune 500 HQ in TX)
| Industry | F500 HQs | Revenue |
|---|---|---|
| Energy | 16 | $1,198B |
|
||
| Technology | 5 | $198B |
|
||
| Engineering / Construction | 4 | $72B |
|
||
| Energy Services | 3 | $60B |
|
||
| Utilities | 3 | $41B |
|
||
| Healthcare | 2 | $330B |
|
||
Price history
7 events — show timeline
- 2026-01-21 Listed $38,799 HARMLS
- 2007-06-06 Sold (Public Records) — Public Records
- 2006-09-14 Sold (Public Records) — Public Records
- 1997-05-22 Sold (Public Records) — Public Records
- 1997-04-14 Sold (Public Records) — Public Records
- 1989-06-02 Sold (Public Records) — Public Records
- 1966-04-14 Sold (Public Records) — Public Records
Property tax history
-10.3%/yrLatest (2025): $120 · -82.5% YoY. Source: county tax records.
Cash-flow waterfall
monthlySold comps — $/sqft
last 12 mo · ≤1 miLoading sold comps…