 Multi-family
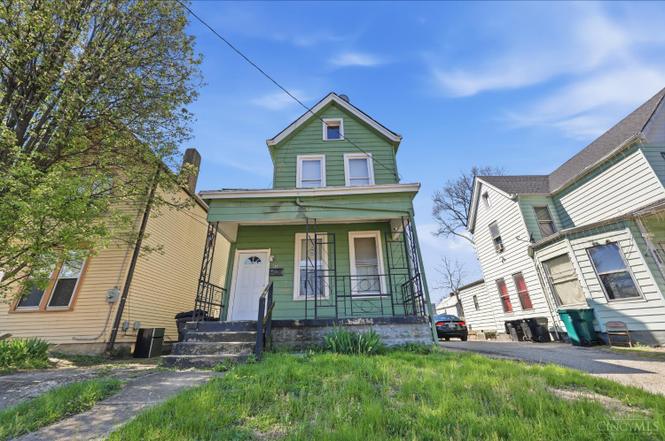
107 W Sixty Fifth St · Cincinnati, OH
Flood risk 9/10 · Severe
- FEMA flood zone
- X (shaded)
- Chance of flooding over 30 yrs
- 0.92%
- Est. flood insurance / yr
- $473 – $860
Fire risk 1/10 · Minimal
- Est. fire insurance / yr
- $713 – $1,323
Heat risk 5/10 · Moderate
- Hot days now (above 103°F)
- 7 days/yr
- Hot days in 30 yrs
- 20 days/yr
Wind risk 2/10 · Minimal
- Chance of severe wind over 30 yrs
- 1.0%
Air-quality risk 3/10 · Minor
- Unhealthy air days now
- 2 days/yr
- Unhealthy air days in 30 yrs
- 3 days/yr
Risk factors via First Street. Map © Google.
Why this score? — see what drove the C+ grade
The composite is a weighted blend of 9 inputs, each scored 0–100. Each bar is that input's sub-score; the figure is the points it added to the 100-point composite (weight × sub-score).
- Cash flow +23.4/30.0
- ARV discount +12.7/15.0
- DSCR +7.5/10.0
- 1% rule +5.7/10.0
- Livability +4.0/5.0
- Rent growth +2.5/5.0
- Schools +2.5/10.0
- Condition / age +2.5/5.0
- Appreciation +0.0/10.0
$150,000
🖨 Deal sheet (PDF) 📄 Offer letter ✓ Due diligence
Multi-family units
County records classify this as Multi-Family (2-4 Unit). Listing-text estimate: 1 unit. estimate disagrees with records
Listing remarks
Cash-flowing investment opportunity! 107 W Sixty-Fifth St is currently generating $1,500 per month in rental income with a tenant already in place, providing immediate returns from day one. This income-producing property offers stable cash flow and long-term appreciation potential in a high-demand rental area. Ideal for investors looking to expand their portfolio with a performing asset. Conveniently located near major highways, shopping, and employment centers, supporting continued rental demand. Secure a property that's already working for you and start collecting income at closing.
Key facts
- Stable cash flow
- 3,790 sq ft lot
- Built 1886
Tags
Property features AI
Finance
- Other: Lot size approximately 0.087 acres (3,790 sq ft); Census tract 61
- Financial info: Lease not considered
- HOA & community: No HOA
Exterior
- Parking: Driveway
- Utilities: Public water; Public sewer; Natural gas
- Home design: Single family tract home; Two levels; Entry level: 1
- Construction: Aluminum siding; Stone foundation; Shingle roof; Built with traditional construction materials
- Exterior features: City street access; Vinyl insulated windows
Interior
- Kitchen: Eat-in kitchen with tile floor and walkout; Appliances: Dishwasher, Microwave, Oven/Range, Refrigerator
- Bedrooms: 3 bedrooms; Primary bedroom on level 2 (18 x 14); Second bedroom on level 2 (16 x 15); Third bedroom on level 2 (15 x 14)
- Flooring: Wall-to-wall carpet in living room; Carpet in entry/foyer; Tile flooring in kitchen
- Bathrooms: 2 full bathrooms; One full bathroom on level 1; One full bathroom on level 2
- Heating & cooling: Forced air heating (gas); Water heating: Other
- Interior features: 9 total rooms; Full unfinished basement with concrete floor; Fireplace in living room
- Laundry & utility: Laundry/utility details not provided
Neighborhood map
What this means for you Summary
Snapshot
- This is a 2-bed/2.0-bath multifamily listed at $150k.
Deal economics
- At list price, monthly cash flow is $223 ($3k/yr) — positive.
- The deal already cash-flows at list — no discount required.
- Meets the 1% rule at list price ($2k rent vs $150k).
- Recommended offer: $136k (9.0% below list) — sets the bar for market timing.
- Cap rate 8.5% vs local median 3.9% in Cincinnati — top-decile yield for the area; either an underpriced asset or a hidden risk that comps aren't pricing in. Stress-test before assuming the spread holds.
Location & tenants
- Location reads 80/100 on livability (#130 in OH, #1,856 nationally) — a professional / high-income tenant draw. Strengths: amenities A+, commute A+, cost of living A+; Watch: employment D, crime F.
- Cincinnati Public Schools (urban): math 25% / reading 36% proficiency, ranked #581 of 656 in OH (top 89%) — families likely to look elsewhere, expect single-tenant / working-renter base with shorter leases; 70% free/reduced lunch — lower-income household profile, screen leases tightly.
- Market conditions: 19 active listings in the ZIP; 6 comparable units currently listed for rent nearby; rentals at typical pace (median 18d on market — plan ~3-4 weeks tenant-placement turnaround); lower-income renter base — watch delinquency; 801 units permitted in Hamilton County in 2024 (190 in 5+ unit buildings).
- This rent runs 43% of the median local income ($44k/yr) — at the standard rent-burdened threshold; future hikes will face affordability resistance.
Forward outlook
- Local home prices are declining (-3.0%/yr); year-one equity from $1k of loan paydown is wiped out by about $4k of value loss. Plan a longer hold.
Negotiation context
- It's been on market 109 days — a 9% lower offer ($136k) is reasonable based on typical stale-listing flexibility.
- Current owner paid $15k; list at $150k implies a 900% gain — meaningful room to come down on a strong offer.
Risks & watch-outs
- Watch-outs: flood insurance adds $56/mo; built in 1886 — expect roof / HVAC / electrical / plumbing capex.
- Climate carrying-cost: severe flood risk; extreme-heat days projected 7→20/yr by 2055 (HVAC capex compounding) — expect insurance premiums to compound above CPI over the hold.
Questions for the listing agent
- It's been on market 109 days. Have you received any prior offers? Is the seller open to a 9% concession, seller financing, or rate buy-down credit?
- Built in 1886 — when were the roof, HVAC, electrical panel, plumbing, and water heater last replaced?
- What's the actual annual flood-insurance premium (NFIP or private), and is the property in a SFHA with mandatory coverage?
- Why hasn't it sold? Are there any deal-killer items the seller is aware of (foundation, flood, title, zoning, code violations)?
- Is there a deadline driving the sale (1031 exchange, divorce, estate, relocation)? That informs how much negotiation room exists.
- Schools are B-rated — typically a magnet for longer-tenancy family renters. What's the average tenant stay here, and is there a school-zone premium baked into asking?
- Crime grade is F in this area — have there been break-ins, vandalism, or insurance claims at this property in the last 3 years? What carrier currently insures it and at what premium?
- What's the average days-on-market for RENTAL listings here right now (not sales)? A rising rental-DOM trend means longer vacancies and softer asking-rent achievability than the comps imply.
- What's the recent tenant-quality profile in this submarket — average credit score on applications, eviction rate, late-payment / NSF rate, and stable-employment percentage? A property-management company in the area should have these aggregated.
- How much new apartment / multifamily construction is in the pipeline within 1–3 miles? Heavy new supply (>2% of stock underway) typically softens rents 12–24 months out; light construction supports rent growth.
Investment metrics
- 1% rule
- 1.07% ✓
- Cap rate
- 8.52%
- Cash-on-cash
- 7.95%
- DSCR
- 1.35
- GRM
- 7.8
CMA / ARV
- ARV (on-the-fly)
- $169,604
- Comps found
- 1
Show comp detail 1 sale within ~0.75 mi
| Address | Dist | Beds/Ba | Sqft | Sold | Price | $/sf | Match |
|---|---|---|---|---|---|---|---|
| 18 Township Ave | 0.44mi | 3/2.0 (+1) | 1,696 (+9%) | 18mo | $185,000 | $109 | 44 |
Match score weights: distance 35% · size 25% · config 20% · recency 20%. Top-matched comps best support the ARV.
Projected returns pro-forma
-3.0% appreciation · 3.0% rent growth · sell at horizon
- IRR
- -6.5%
- Equity multiple
- 0.76×
- Total profit
- $-10,101
- Equity at exit
- $22,365
- IRR
- 3.2%
- Equity multiple
- 1.23×
- Total profit
- $9,569
- Equity at exit
- $12,969
Cash invested: $42,000 (down + closing). Projections, not guarantees.
Landlord ↔ Tenant lean methodology
- Overall (STATE)
- 73 Landlord-Friendly
- State Ohio
- 73 Landlord-Friendly · R+6
- County
- — inherits STATE
- City
- — inherits STATE
ZIP-level market 45216
- Home prices YoY
- -19.1%
- Active inventory
- 19
- Price-to-rent
- 7.8×
Monthly cashflow live
- Estimated rent
- $1,598 high interval (Pro) →
- Mortgage (P&I)
- −$787
- Tax from tax record
- −$135 /mo · $1,626/yr
- Insurance
- −$62
- Flood insurance flood zone
- −$56 /mo · $666/yr
- HOA
- −$0
- Vacancy / Maint / Mgmt
- −$336
- Net cashflow
- $223
Break-even live
Sensitivity live
| Price | -10% $308 | -5% $265 | +0% $223 | +5% $180 | +10% $138 |
|---|---|---|---|---|---|
| Rent | -10% $96 | -5% $159 | +0% $223 | +5% $286 | +10% $349 |
| Rate | -1.0pp $298 | -0.5pp $261 | base $223 | +0.5pp $184 | +1.0pp $144 |
UW: 25.0% down · 7.5% · 30yr · 1.5% tax · 5.0% vac · 8.0% maint · 8.0% mgmt
Financing live
Cash to close
- Down payment
- $37,500
- Closing costs
- $4,500
- Reserves months
- —
- Total cash needed
- —
Loan-product check · same deal, 3 products live
Conventional
25% down · 7.5% · 30yr
- Down + closing
- —
- Monthly P&I
- —
- Monthly cashflow
- —
- DSCR
- —
- Eligible?
- —
Personal DTI + credit; lowest rate.
DSCR
20% down · 8.5% · 30yr
- Down + closing
- —
- Monthly P&I
- —
- Monthly cashflow
- —
- DSCR
- —
- Eligible?
- —
No personal income docs; deal must DSCR.
Hard money
10% down · 12.0% · 12mo
- Down + closing
- —
- Monthly P&I
- —
- Monthly cashflow
- —
- DSCR
- —
- Eligible?
- —
Short-term bridge; refi at stabilization.
Rent comps 6 comps
| Address | Beds | Baths | Sqft | Rent | $/sqft | DOM | Units | Dist |
|---|---|---|---|---|---|---|---|---|
| 113 W 66th St Cincinnati, OH | 3.0 | 2.0 | 1166 | $1,800 | $1.54 | 5d | 1 | 0.06mi |
| 409 Locust St Cincinnati, OH | 1.0 | 1.0 | 1728 | $1,600 | $0.93 | 24d | 1 | 0.36mi |
| 5912 Elmwood Ave Cincinnati, OH | 3.0 | 1.0 | 1323 | $1,450 | $1.10 | 4d | 1 | 0.38mi |
| 1649 Anita Pl Unit 3 Cincinnati, OH | 2.0 | 1.0 | 1100 | $1,098 | $1.00 | 24d | 1 | 1.44mi |
| 7209 Brookcrest Dr Unit 1 Cincinnati, OH | 2.0 | 1.0 | 1100 | $1,395 | $1.27 | 5d | 1 | 1.46mi |
| 7209 Brookcrest Dr Unit 2 Cincinnati, OH | 2.0 | 1.0 | 1100 | $1,395 | $1.27 | 17d | 1 | 1.46mi |
Listing history 17 events
-
2026-06-18price $150,000 Active 109 DOM
-
2026-06-18days on market $180,000 Active 109 DOM
-
2026-06-17days on market $180,000 Active 108 DOM
-
2026-06-16days on market $180,000 Active 107 DOM
-
2026-06-15days on market $180,000 Active 106 DOM
-
2026-06-13days on market $180,000 Active 104 DOM
-
2026-06-13days on market $180,000 Active 103 DOM
-
2026-06-09days on market $180,000 Active 100 DOM
-
2026-06-08days on market $180,000 Active 99 DOM
-
2026-06-07days on market $180,000 Active 98 DOM
-
2026-06-03days on market $180,000 Active 94 DOM
-
2026-06-02days on market $180,000 Active 93 DOM
-
2026-06-01days on market $180,000 Active 92 DOM
-
2026-05-31days on market $180,000 Active 91 DOM
-
2026-02-23$180,000 Active
-
2010-05-05soldstatus $15,000
-
2002-12-05soldstatus $30,000
ⓘ Source: listings_history table (triggers on properties + properties_extension) + one-shot
backfill from property_details.listing_events for pre-trigger history.
Tax reassessment forecast OH · Partial reset (capped growth)
- Current annual tax
- $1,626 · $135/mo
- Projected year-2 tax
- $1,983 · $165/mo
- Expected delta
- +$357/yr (+$30/mo · 22.0%)
ⓘ Screening estimate from a state-policy table — verify with the county assessor before closing.
Climate risk First Street
- Flood 9/10 Extreme FEMA zone X (shaded) · 92% chance over 30 yrs
- Wildfire 1/10 Low
- Heat 5/10 Major 7 d/yr ≥103°F today · 20 d/yr by 30 yrs out
- Wind 2/10 Low 100% chance of damaging wind over 30 yrs
- Air quality 3/10 Moderate 2 unhealthy d/yr today · 3 by 30 yrs out
Nearby sold comps map
Loading sold comps map…
Walkable amenities ~0.75 mi
Loading nearby amenities…
Taxation est. · year 1
- Rental income
- $19,181
- − Mortgage interest
- −$8,402
- − Property taxes
- −$1,626
- − Insurance
- −$1,416
- − Repairs & maintenance
- −$1,534
- − Management
- −$1,534
- − Depreciation
- −$4,364
- Taxable income
- $304
- Est. tax owed @ 24.0%
- −$73
- After-tax cash flow
- $2,599/yr
For passive investors: Depreciation is non-cash, so a rental often shows a tax loss while cash-flowing — sheltering income. Rental losses are passive: they offset passive income freely, and up to $25,000/yr can offset ordinary (W-2) income if you actively participate and your MAGI is under $100k (phasing out to $0 by $150k); unused losses carry forward. On sale, claimed depreciation is recaptured at up to 25%, and gains may owe capital-gains tax (a 1031 exchange can defer both). Figures are a year-1 estimate at your 24.0% rate — not tax advice; consult a CPA.
Schools (NCES district)
- District
- Cincinnati Public Schools
- NCES district ID
- 3904375
- Math proficiency
- 25% ▼ -19.00%
- Reading proficiency
- 36% ▼ -14.00%
- Median HH income
- $35,743
- Composite
- 25.21/100
- National rank
- #7508
- State rank
- #581 of 656 in OH
Livability — Cincinnati
- Score
- 80/100
- State rank
- #130
- US rank
- #1856
Category grades
Schools grade is shown separately in the Schools card above.
Census & demographics
- Census place
- Cincinnati, OH
- County
- Hamilton County · 701,295 people
- City population
- 505,555
- Metro
- Cincinnati, OH-KY-IN
- Population (ZIP)
- 9,569
- Household income
- $44,099
- Rent vs Own
- Severe rent burden
- 407.0
Population outlook (Hamilton County) Hauer SSP2
- Today (2025)
- 826,054 people
- By 2030
- 830,947 · +0.6%
- By 2040
- 832,319 · +0.8%
- By 2050
- 822,428 · -0.4%
- By 2075
- 788,688 · -4.5%
- By 2100
- 710,674 · -14.0%
Race, ethnicity, and origin ACS 2023
- Neighborhood character
- Diverse neighborhood (Simpson 0.63)
- Race & ethnicity
- White 56% Black 20% Hispanic / Latino 15% Two or more races 10%
- Hispanic origin (detail)
- Mexican 5%
- Common ancestry
- Romanian 2% Serbian 2% Iranian 1%
- Foreign-born
- 12% · Canada, Guatemala
- Languages at home
- 88% English-only · Spanish 11%
Political lean MEDSL · Hamilton
- 2024 margin
- D (+14.9) · D 57.0% · R 42.1%
- 2008→2024 swing
- +7.9pp toward D · 2008: 7.0pp · 2024: 14.9pp
- All cycles
- 2024: D+14.9 2020: D+15.9 2016: D+9.5 2012: D+4.9 2008: D+7.0
Not yet ingested
- Civics
- —
Market trends
- HPI YoY
- ▼ -58.73%
- Current HPI
- 248.8995
- Rent YoY
- —
- Metro
- Cincinnati, OH-KY-IN
- State GDP YoY
- ▲ 1.98%
- F500 in state
- 48
Industry mix (Fortune 500 HQ in OH)
| Industry | F500 HQs | Revenue |
|---|---|---|
| Insurance | 3 | $145B |
|
||
| Industrial Machinery | 3 | $49B |
|
||
| Financial Services | 3 | $24B |
|
||
| Consumer Goods | 2 | $93B |
|
||
| Aerospace / Defense | 2 | $47B |
|
||
| Utilities | 2 | $33B |
|
||
Price history
+500.0% since first listed3 events — show timeline
- 2026-02-23 Listed $180,000 Cincy MLS
- 2010-05-05 Sold (Public Records) $15,000 Public Records
- 2002-12-05 Sold (Public Records) $30,000 Public Records
Property tax history
+15.1%/yrLatest (2025): $1,626 · +0.1% YoY. Source: county tax records.
Cash-flow waterfall
monthlySold comps — $/sqft
last 12 mo · ≤1 miLoading sold comps…