5665 Lakeview Mews Dr · Golf, FL
Flood risk 1/10 · Minimal
- FEMA flood zone
- X (unshaded)
- Chance of flooding over 30 yrs
- 0.0%
- Est. flood insurance / yr
- $507 – $1,088
Fire risk 1/10 · Minimal
- Est. fire insurance / yr
- $947 – $1,759
Heat risk 9/10 · Severe
- Hot days now (above 106°F)
- 7 days/yr
- Hot days in 30 yrs
- 26 days/yr
Wind risk 10/10 · Severe
- Chance of severe wind over 30 yrs
- 99.0%
Air-quality risk 2/10 · Minimal
- Unhealthy air days now
- 1 days/yr
- Unhealthy air days in 30 yrs
- 2 days/yr
Risk factors via First Street. Map © Google.
Why this score? — see what drove the C grade
The composite is a weighted blend of 9 inputs, each scored 0–100. Each bar is that input's sub-score; the figure is the points it added to the 100-point composite (weight × sub-score).
- Cash flow +15.6/30.0
- ARV discount +15.0/15.0
- 1% rule +5.0/10.0
- Appreciation +4.9/10.0
- DSCR +4.8/10.0
- Schools +4.3/10.0
- Livability +3.2/5.0
- Rent growth +2.8/5.0
- Condition / age +2.5/5.0
$340,000
🖨 Deal sheet (PDF) 📄 Offer letter ✓ Due diligence
Listing remarks MLS
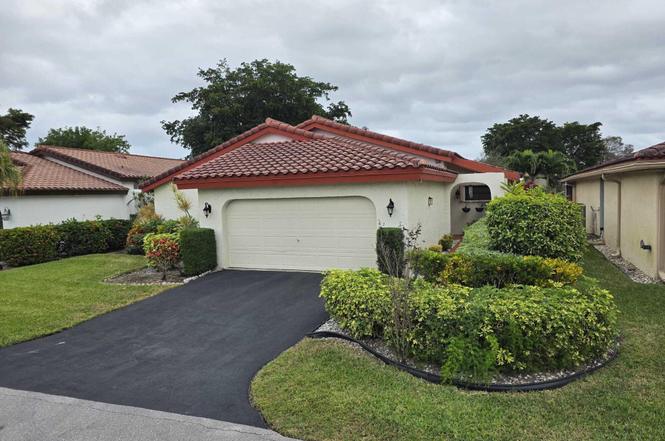
Well maintained home in The Mews. This home has an oversized hurricane rated glass enclosed Florida room perfect for entertaining. The room overlooks the pond in the back and has vaulted ceilings. There is a small patio off the kitchen perfect for doing your outdoor grilling. The living areas are all tiled and the bedrooms are carpeted. The kitchen has a newer refrigerator and dishwasher. Brand new ROOF December 2010.The home is close to all shopping and restaurants and much more. All measurements are deemed accurate, but are not guaranteed. The microwave is not in working order and is not guaranteed. Country Club membership is available but is not mandatory.
Key facts
- Great natural light
- Spacious living area
- Built-in unit
Tags
Property features AI
Finance
- Financial info: Pets allowed (with number and size limits)
- HOA & community: Homeowners association with monthly fee; HOA provides pool access; HOA fee includes cable TV
Exterior
- Parking: 2-car garage with garage door opener; 2 covered parking spaces; 2 open parking spaces
- Security: Gated community with guard; Security guard on site
- Utilities: Public sewer; Cable available; Sewer available
- Home design: Single-family residence; Multi/split levels; One story total; Faces northeast; Resale condition
- Construction: Concrete and stucco construction
- Exterior features: Waterfront property
Interior
- Kitchen: Dishwasher; Electric range; Microwave; Refrigerator; Trash compactor; Electric water heater
- Bedrooms: 1 main-level bedroom
- Flooring: Carpet
- Bathrooms: 2 full bathrooms; 1 half bathroom
- Heating & cooling: Central heating; Ceiling fans for cooling
- Interior features: Walk-in closets; Custom mirrors; Partially furnished
- Laundry & utility: Laundry area in garage
Neighborhood map
What this means for you Summary
Snapshot
- This is a 3-bed/2.0-bath single-family listed at $340k.
Deal economics
- At list price, monthly cash flow is $141 ($2k/yr) — positive.
- The deal already cash-flows at list — no discount required.
- Meets the 1% rule at list price ($3k rent vs $340k).
- Recommended offer: $299k (12.0% below list) — sets the bar for market timing.
Location & tenants
- Location reads 63/100 on livability (#703 in FL) — a middle-class / working-renter tenant base. Strengths: crime A+, employment A+, housing A+; Watch: amenities F, commute F, cost of living F.
- Palm Beach (suburban): math 46% / reading 53% proficiency, ranked #34 of 73 in FL (top 47%) — families likely to look elsewhere, expect single-tenant / working-renter base with shorter leases.
- Market conditions: Rents rising (+1.3%/yr); 479 active listings in the ZIP; 31 comparable units currently listed for rent nearby; rentals at typical pace (median 25d on market — plan ~3-4 weeks tenant-placement turnaround); solid renter incomes; 3,974 units permitted in Palm Beach County in 2024 (1,012 in 5+ unit buildings).
- At $3,407/mo this rent would consume 51% of the median local household income ($81k/yr) (locally 902% of renters already pay >50% of income on rent) — very limited rent-growth headroom before tenants either downsize or default.
Forward outlook
- In year one you build about $2k of equity ($2k loan paydown + $-822 appreciation (-0.2% local appreciation)).
- Palm Beach County population projected at +30% by 2050 — long-run rental-demand tailwind backs the buy-and-hold thesis.
Negotiation context
- It's been on market 191 days — a 12% lower offer ($299k) is reasonable based on typical stale-listing flexibility.
- 3 sale attempts since 16y ago with the ask held roughly flat each time — persistent listings suggest the price (not the market) is what's stuck; bring a comps-based counter.
- Current owner paid $150k; list at $340k implies a 127% gain — meaningful room to come down on a strong offer.
Risks & watch-outs
- Climate carrying-cost: severe wind risk, 99% chance of damaging wind over 30y; extreme-heat days projected 7→26/yr by 2055 (HVAC capex compounding) — expect insurance premiums to compound above CPI over the hold.
Questions for the listing agent
- It's been on market 191 days. Have you received any prior offers? Is the seller open to a 12% concession, seller financing, or rate buy-down credit?
- What does the HOA fee cover, when was the last increase, and are there any pending special assessments or reserve-fund shortfalls?
- Why hasn't it sold? Are there any deal-killer items the seller is aware of (foundation, flood, title, zoning, code violations)?
- Is there a deadline driving the sale (1031 exchange, divorce, estate, relocation)? That informs how much negotiation room exists.
- What's the average days-on-market for RENTAL listings here right now (not sales)? A rising rental-DOM trend means longer vacancies and softer asking-rent achievability than the comps imply.
- What's the recent tenant-quality profile in this submarket — average credit score on applications, eviction rate, late-payment / NSF rate, and stable-employment percentage? A property-management company in the area should have these aggregated.
- How much new for-sale + rental construction is in the pipeline within 1–3 miles? Heavy new supply typically softens prices + rents 12–24 months out; constrained supply supports both.
Investment metrics
- 1% rule
- 1.00% ✓
- Cap rate
- 6.79%
- Cash-on-cash
- 1.77%
- DSCR
- 1.08
- GRM
- 8.3
CMA / ARV
- ARV (on-the-fly)
- $590,427
- Comps found
- 2
Show comp detail 2 sales within ~0.75 mi
| Address | Dist | Beds/Ba | Sqft | Sold | Price | $/sf | Match |
|---|---|---|---|---|---|---|---|
| 5892 Seashell Ter | 0.53mi | 3/2.0 | 2,284 (+12%) | 2mo | $661,000 | $289 | 54 |
| 5767 Seashell Ter | 0.49mi | 3/2.0 | 1,782 (-13%) | 3mo | $460,000 | $258 | 53 |
Match score weights: distance 35% · size 25% · config 20% · recency 20%. Top-matched comps best support the ARV.
Projected returns pro-forma
-0.24% appreciation · 1.28% rent growth · sell at horizon
- IRR
- -2.4%
- Equity multiple
- 0.89×
- Total profit
- $-10,448
- Equity at exit
- $94,636
- IRR
- 2.2%
- Equity multiple
- 1.22×
- Total profit
- $20,487
- Equity at exit
- $110,544
Cash invested: $95,200 (down + closing). Projections, not guarantees.
Landlord ↔ Tenant lean methodology
- Overall (STATE)
- 87 Strongly Landlord-Friendly
- State Florida
- 87 Strongly Landlord-Friendly · R+3
- County
- — inherits STATE
- City
- — inherits STATE
ZIP-level market 33437
- Home prices YoY
- -0.1%
- Rents YoY
- 1.3%
- Active inventory
- 479
- Price-to-rent
- 8.3×
Monthly cashflow live
- Estimated rent
- $3,407 high interval (Pro) →
- Mortgage (P&I)
- −$1,783
- Tax from tax record
- −$259 /mo · $3,108/yr
- Insurance
- −$142
- HOA
- −$367
- Vacancy / Maint / Mgmt
- −$715
- Net cashflow
- $141
Break-even live
Sensitivity live
| Price | -10% $333 | -5% $237 | +0% $141 | +5% $45 | +10% $-52 |
|---|---|---|---|---|---|
| Rent | -10% $-128 | -5% $6 | +0% $141 | +5% $275 | +10% $410 |
| Rate | -1.0pp $312 | -0.5pp $227 | base $141 | +0.5pp $53 | +1.0pp $-37 |
UW: 25.0% down · 7.5% · 30yr · 1.5% tax · 5.0% vac · 8.0% maint · 8.0% mgmt
Financing live
Cash to close
- Down payment
- $85,000
- Closing costs
- $10,200
- Reserves months
- —
- Total cash needed
- —
Loan-product check · same deal, 3 products live
Conventional
25% down · 7.5% · 30yr
- Down + closing
- —
- Monthly P&I
- —
- Monthly cashflow
- —
- DSCR
- —
- Eligible?
- —
Personal DTI + credit; lowest rate.
DSCR
20% down · 8.5% · 30yr
- Down + closing
- —
- Monthly P&I
- —
- Monthly cashflow
- —
- DSCR
- —
- Eligible?
- —
No personal income docs; deal must DSCR.
Hard money
10% down · 12.0% · 12mo
- Down + closing
- —
- Monthly P&I
- —
- Monthly cashflow
- —
- DSCR
- —
- Eligible?
- —
Short-term bridge; refi at stabilization.
Rent comps 31 comps
| Address | Beds | Baths | Sqft | Rent | $/sqft | DOM | Units | Dist |
|---|---|---|---|---|---|---|---|---|
| 5570 Piping Rock Dr Boynton Beach, FL | 2.0 | 2.0 | 1478 | $2,850 | $1.93 | 25d | 1 | 0.13mi |
| 5570 Piping Rock Dr Boynton Beach, FL | 2.0 | 2.0 | 1478 | $3,000 | $2.03 | 0d | 1 | 0.13mi |
| 11115 Oakdale Rd Boynton Beach, FL | 3.0 | 2.0 | 1713 | $4,200 | $2.45 | 25d | 1 | 0.29mi |
| 11230 Green Lake Dr #204 Boynton Beach, FL | 3.0 | 2.0 | 1549 | $3,000 | $1.94 | 12d | 1 | 0.33mi |
| 10921 Royal Caribbean Cir Boynton Beach, FL | 3.0 | 2.0 | 1762 | $3,800 | $2.16 | 4d | 1 | 0.49mi |
| 10921 Royal Caribbean Cir Boynton Beach, FL | 3.0 | 2.0 | 1782 | $3,800 | $2.13 | 25d | 1 | 0.49mi |
| 11690 Briarwood Cir Boynton Beach, FL | 3.0 | 2.0 | 1952 | $3,400 | $1.74 | 25d | 1 | 0.50mi |
| 5256 Glenville Dr Boynton Beach, FL | 3.0 | 2.0 | 2015 | $5,000 | $2.48 | 2d | 1 | 0.55mi |
| 5916 Seashell Ter Boynton Beach, FL | 3.0 | 2.0 | 1882 | $2,900 | $1.54 | 16d | 1 | 0.56mi |
| 5750 Fairway Park Ct #101 Boynton Beach, FL | 3.0 | 2.0 | 1426 | $1,850 | $1.30 | 25d | 1 | 0.57mi |
| 6446 Aspen Glen Cir Unit 6446 Boynton Beach, FL | 3.0 | 2.0 | 1800 | $4,000 | $2.22 | 25d | 1 | 0.73mi |
| 6446 Aspen Glen Cir Boynton Beach, FL | 3.0 | 2.0 | 1800 | $3,800 | $2.11 | 21d | 1 | 0.73mi |
| 11177 Aspen Glen Dr Boynton Beach, FL | 3.0 | 2.0 | 1884 | $3,000 | $1.59 | 25d | 1 | 0.73mi |
| 10596 Sunset Isles Ct Boynton Beach, FL | 3.0 | 2.0 | 1769 | $4,500 | $2.54 | 25d | 1 | 0.75mi |
| 12118 Country Greens Blvd Boynton Beach, FL | 3.0 | 2.0 | 1566 | $3,000 | $1.92 | 11d | 1 | 0.76mi |
| 10839 Madison Dr Boynton Beach, FL | 4.0 | 2.0 | 2079 | $3,800 | $1.83 | 11d | 1 | 0.88mi |
| 10839 Madison Dr Boynton Beach, FL | 4.0 | 2.0 | 2079 | $3,800 | $1.83 | 2d | 1 | 0.88mi |
| 11853 Fountainside Cir Boynton Beach, FL | 3.0 | 3.5 | 2410 | $3,800 | $1.58 | 25d | 1 | 0.90mi |
| 12390 Summer Springs Dr Boynton Beach, FL | 3.0 | 2.0 | 1861 | $3,300 | $1.77 | 25d | 1 | 1.06mi |
| 5217 Cedar Lake Rd Boynton Beach, FL | 1.0–3.0 | 1.0–2.0 | 1030 | $2,811 | $2.73 | 2d | 51 | 1.07mi |
| 5335 Vernio Ln Boynton Beach, FL | 3.0 | 2.0 | 1798 | $3,700 | $2.06 | 25d | 1 | 1.12mi |
| 4907 Boxwood Cir Boynton Beach, FL | 3.0 | 2.0 | 1731 | $2,900 | $1.68 | 25d | 1 | 1.13mi |
| 6396 Park Lake Cir Boynton Beach, FL | 3.0 | 2.5 | 1422 | $2,950 | $2.07 | 15d | 1 | 1.15mi |
| 4944 Equestrian Cir Unit A Boynton Beach, FL | 2.0 | 2.0 | 1400 | $2,500 | $1.79 | 8d | 1 | 1.15mi |
| 6037 Rossmoor Lakes Ct Boynton Beach, FL | 3.0 | 2.0 | 1617 | $4,700 | $2.91 | 25d | 1 | 1.19mi |
| 4419 Sanderling Cir E Boynton Beach, FL | 3.0 | 3.5 | 1866 | $10,000 | $5.36 | 25d | 1 | 1.22mi |
| 12547 Imperial Isle Dr Boynton Beach, FL | 2.0–3.0 | 2.0 | 1500 | $4,500 | $3.00 | 25d | 2 | 1.25mi |
| 10390 Utopia Cir E Unit 10390 Boynton Beach, FL | 3.0 | 2.0 | 1845 | $4,200 | $2.28 | 25d | 1 | 1.27mi |
| 10390 Utopia Cir E Unit E Boynton Beach, FL | 3.0 | 2.0 | 1845 | $4,200 | $2.28 | 3d | 1 | 1.27mi |
| 5895 Autumn Lake Ln Unit A Boynton Beach, FL | 3.0 | 2.0 | 1469 | $2,600 | $1.77 | 25d | 1 | 1.30mi |
| 12654 Via Ravenna Boynton Beach, FL | 3.0 | 2.0 | 1729 | $3,500 | $2.02 | 25d | 1 | 1.36mi |
HOA detail
- Monthly dues
- $367 · $4,404/yr
Listing history 22 events
-
2026-06-18days on market $340,000 Active 191 DOM
-
2026-06-17days on market $340,000 Active 190 DOM
-
2026-06-16days on market $340,000 Active 189 DOM
-
2026-06-15days on market $340,000 Active 188 DOM
-
2026-06-13days on market $340,000 Active 186 DOM
-
2026-06-09days on market $340,000 Active 182 DOM
-
2026-06-07days on market $340,000 Active 180 DOM
-
2026-06-04days on market $340,000 Active 177 DOM
-
2026-06-03days on market $340,000 Active 176 DOM
-
2026-06-01days on market $340,000 Active 174 DOM
-
2026-05-31days on market $340,000 Active 173 DOM
-
2026-04-13price $340,000
-
2025-12-09$350,000 Active
-
2025-11-25historical
-
2025-11-17price $350,000
-
2025-11-05$369,900 Active
-
2011-03-11soldstatus $150,000
-
2011-02-20soldstatus $150,000 667-char remark
Show marketing remark (667 chars)
Well maintained home in The Mews. This home has an oversized hurricane rated glass enclosed Florida room perfect for entertaining. The room overlooks the pond in the back and has vaulted ceilings. There is a small patio off the kitchen perfect for doing your outdoor grilling. The living areas are all tiled and the bedrooms are carpeted. The kitchen has a newer refrigerator and dishwasher. Brand new ROOF December 2010.The home is close to all shopping and restaurants and much more. All measurements are deemed accurate, but are not guaranteed. The microwave is not in working order and is not guaranteed. Country Club membership is available but is not mandatory.
-
2011-02-16historical 667-char remark
Show marketing remark (667 chars)
Well maintained home in The Mews. This home has an oversized hurricane rated glass enclosed Florida room perfect for entertaining. The room overlooks the pond in the back and has vaulted ceilings. There is a small patio off the kitchen perfect for doing your outdoor grilling. The living areas are all tiled and the bedrooms are carpeted. The kitchen has a newer refrigerator and dishwasher. Brand new ROOF December 2010.The home is close to all shopping and restaurants and much more. All measurements are deemed accurate, but are not guaranteed. The microwave is not in working order and is not guaranteed. Country Club membership is available but is not mandatory.
-
2010-06-08$175,000 667-char remark
Show marketing remark (667 chars)
Well maintained home in The Mews. This home has an oversized hurricane rated glass enclosed Florida room perfect for entertaining. The room overlooks the pond in the back and has vaulted ceilings. There is a small patio off the kitchen perfect for doing your outdoor grilling. The living areas are all tiled and the bedrooms are carpeted. The kitchen has a newer refrigerator and dishwasher. Brand new ROOF December 2010.The home is close to all shopping and restaurants and much more. All measurements are deemed accurate, but are not guaranteed. The microwave is not in working order and is not guaranteed. Country Club membership is available but is not mandatory.
-
1997-05-07soldstatus $112,500
-
1993-04-26soldstatus $150,000
ⓘ Source: listings_history table (triggers on properties + properties_extension) + one-shot
backfill from property_details.listing_events for pre-trigger history.
Tax reassessment forecast FL · Resets to sale price
- Current annual tax
- $3,108 · $259/mo
- Projected year-2 tax
- $3,108 · $259/mo
- Expected delta
- $0/yr ($0/mo · 0.0%)
ⓘ Screening estimate from a state-policy table — verify with the county assessor before closing.
Climate risk First Street
- Flood 1/10 Low FEMA zone X (unshaded) · 0% chance over 30 yrs
- Wildfire 1/10 Low
- Heat 9/10 Extreme 7 d/yr ≥106°F today · 26 d/yr by 30 yrs out
- Wind 10/10 Extreme 99% chance of damaging wind over 30 yrs
- Air quality 2/10 Low 1 unhealthy d/yr today · 2 by 30 yrs out
Nearby sold comps map
Loading sold comps map…
Walkable amenities ~0.75 mi
Loading nearby amenities…
Taxation est. · year 1
- Rental income
- $40,883
- − Mortgage interest
- −$19,045
- − Property taxes
- −$3,108
- − Insurance
- −$1,700
- − Repairs & maintenance
- −$3,271
- − Management
- −$3,271
- − HOA
- −$4,404
- − Depreciation
- −$9,891
- Taxable loss
- −$3,807
- Est. tax savings @ 24.0%
- +$914
- After-tax cash flow
- $2,603/yr
For passive investors: Depreciation is non-cash, so a rental often shows a tax loss while cash-flowing — sheltering income. Rental losses are passive: they offset passive income freely, and up to $25,000/yr can offset ordinary (W-2) income if you actively participate and your MAGI is under $100k (phasing out to $0 by $150k); unused losses carry forward. On sale, claimed depreciation is recaptured at up to 25%, and gains may owe capital-gains tax (a 1031 exchange can defer both). Figures are a year-1 estimate at your 24.0% rate — not tax advice; consult a CPA.
Schools (NCES district)
- District
- Palm Beach
- NCES district ID
- 1201500
- Math proficiency
- 46% ▼ -16.00%
- Reading proficiency
- 53% ▼ -4.00%
- Median HH income
- $53,943
- Composite
- 42.72/100
- National rank
- #3160
- State rank
- #34 of 73 in FL
Livability — Golf
- Score
- 63/100
- State rank
- #703
- US rank
- #14941
Category grades
Schools grade is shown separately in the Schools card above.
Census & demographics
- County
- Palm Beach County · 1,438,312 people
- Metro
- Miami-Fort Lauderdale-Pompano Beach, FL
- Population (ZIP)
- 37,229
- Household income
- $80,710
- Rent vs Own
- Severe rent burden
- 902.0
Population outlook (Palm Beach County) Hauer SSP2
- Today (2025)
- 1,637,487 people
- By 2030
- 1,743,255 · +6.5%
- By 2040
- 1,948,712 · +19.0%
- By 2050
- 2,132,979 · +30.3%
- By 2075
- 2,530,027 · +54.5%
- By 2100
- 2,706,979 · +65.3%
Race, ethnicity, and origin ACS 2023
- Neighborhood character
- Predominantly White (68%)
- Race & ethnicity
- White 68% Two or more races 13% Hispanic / Latino 12% Black 10% Asian 3%
- Hispanic origin (detail)
- Mexican 1% Puerto Rican 2% Cuban 1% Dominican 1%
- Common ancestry
- Scotch-Irish 8% Romanian 8% Hispanic 6%
- Foreign-born
- 18% · Canada, Jamaica, Vietnam
- Languages at home
- 78% English-only · Spanish 10% French/Haitian/Cajun 6% Other Indo-European 2%
Political lean MEDSL · Palm Beach
- 2024 margin
- Toss-up / Even · D 50.0% · R 49.2%
- 2008→2024 swing
- -22.1pp toward R · 2008: 22.9pp · 2024: 0.8pp
- All cycles
- 2024: D+0.8 2020: D+12.8 2016: D+15.3 2012: D+17.0 2008: D+22.9
Not yet ingested
- Civics
- —
Market trends
- HPI YoY
- ▼ -0.24%
- Current HPI
- 257.5891
- Rent YoY
- ▲ 1.28%
- Metro
- Miami-Fort Lauderdale-Pompano Beach, FL
- State GDP YoY
- ▲ 3.28%
- F500 in state
- 36
Industry mix (Fortune 500 HQ in FL)
| Industry | F500 HQs | Revenue |
|---|---|---|
| Industrial Technology | 2 | $29B |
|
||
| Insurance | 2 | $17B |
|
||
| Retail | 1 | $60B |
|
||
| Technology Distribution | 1 | $58B |
|
||
| Homebuilding | 1 | $35B |
|
||
| Technology Manufacturing | 1 | $35B |
|
||
Price history
+126.7% since first listed11 events — show timeline
- 2026-04-13 Price Changed $340,000 Beaches MLS
- 2025-12-09 Listed $350,000 Beaches MLS
- 2025-11-25 Listing Removed — MARMLS
- 2025-11-17 Price Changed $350,000 MARMLS
- 2025-11-05 Listed $369,900 MARMLS
- 2011-03-11 Sold (Public Records) $150,000 Public Records
- 2011-02-20 Sold (MLS) $150,000 Beaches MLS
- 2011-02-16 Listing Removed — Beaches MLS
- 2010-06-08 Listed $175,000 Beaches MLS
- 1997-05-07 Sold (Public Records) $112,500 Public Records
- 1993-04-26 Sold (Public Records) $150,000 Public Records
Property tax history
+1.5%/yrLatest (2025): $3,108 · +3.3% YoY. Source: county tax records.
Cash-flow waterfall
monthlySold comps — $/sqft
last 12 mo · ≤1 miLoading sold comps…