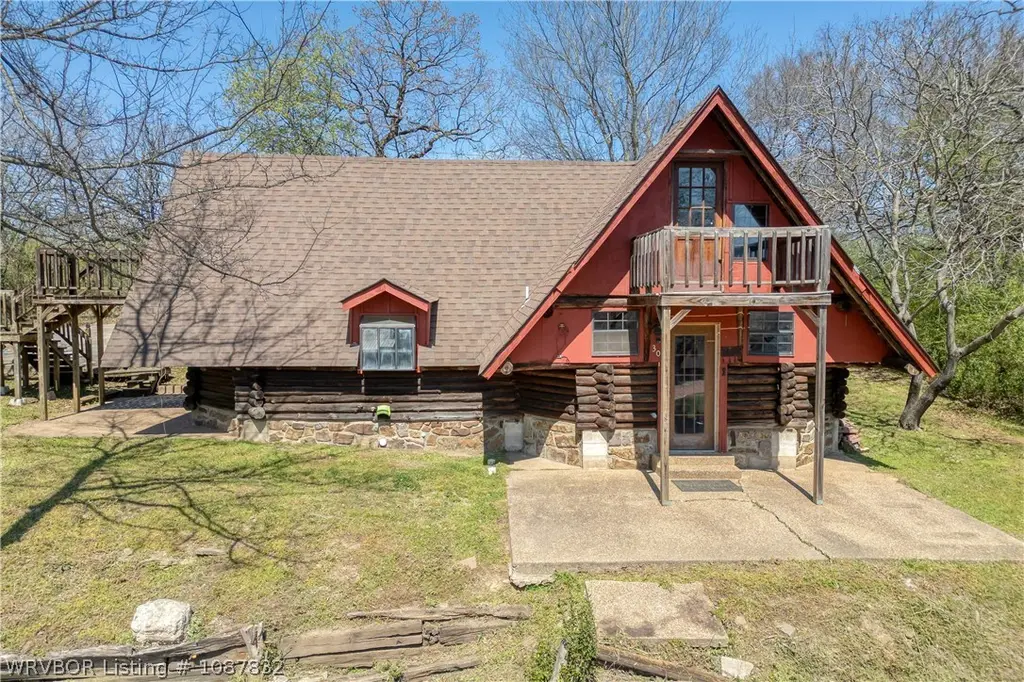
304 Stone St · Mansfield, AR
Flood risk 1/10 · Minimal
- FEMA flood zone
- X
- Chance of flooding over 30 yrs
- 0.0%
- Est. flood insurance / yr
- $507 – $1,088
Fire risk 7/10 · Major
- Est. fire insurance / yr
- $1,499 – $2,785
Heat risk 6/10 · Moderate
- Hot days now (above 111°F)
- 7 days/yr
- Hot days in 30 yrs
- 20 days/yr
Wind risk 2/10 · Minimal
- Chance of severe wind over 30 yrs
- 2.0%
Air-quality risk 2/10 · Minimal
- Unhealthy air days now
- 0 days/yr
- Unhealthy air days in 30 yrs
- 1 days/yr
Risk factors via First Street. Map © Google.
Why this score? — see what drove the C+ grade
The composite is a weighted blend of 9 inputs, each scored 0–100. Each bar is that input's sub-score; the figure is the points it added to the 100-point composite (weight × sub-score).
- Cash flow +20.2/30.0
- ARV discount +12.6/15.0
- Appreciation +8.1/10.0
- DSCR +6.4/10.0
- 1% rule +4.2/10.0
- Livability +3.1/5.0
- Schools +3.0/10.0
- Rent growth +2.5/5.0
- Condition / age +2.5/5.0
$120,000
🖨 Deal sheet 📄 Offer letter ✓ Due diligence
Listing remarks MLS
Nestled in Mansfield yet reminiscent of a cozy Swiss Alps retreat, this custom-built chalet offers a truly distinctive feel for the area. The lower level welcomes you with beautiful flagstone flooring, a spacious kitchen with dining area, a comfortable family room, utility room, and a convenient guest bath—perfect for everyday living and entertaining. A charming spiral staircase leads upstairs to three bedrooms, all featuring fresh new carpet, along with a full bath. Two of the bedrooms open to private balconies, offering peaceful spots to relax and take in the surroundings. The driveway is accessed from Willis Street and includes a permanent easement for shared parking with the neighboring property. Ideally situated near schools, shopping, and dining, this home blends character, comfort, and convenience in one inviting package.
Key facts
- Private balconies
- Spiral staircase
- Flagstone flooring
Tags
Neighborhood map
What this means for you Summary
Snapshot
- This is a 3-bed/2.0-bath single-family listed at $120k.
Deal economics
- At list price, monthly cash flow is $151 ($2k/yr) — positive.
- The deal already cash-flows at list — no discount required.
- To meet the 1% rule (rent ≥ 1% of price), the offer needs to be $111k (7.9% below list).
- Recommended offer: $111k (7.9% below list) — sets the bar for 1% rule.
Location & tenants
- Location reads 61/100 on livability (#255 in AR) — a middle-class / working-renter tenant base. Strengths: cost of living A+, housing A+, crime B+; Watch: schools F, amenities F, commute F.
- Mansfield School District (rural): math 37% / reading 34% proficiency, ranked #110 of 238 in AR (top 46%) — families likely to look elsewhere, expect single-tenant / working-renter base with shorter leases.
- Market conditions: 26 active listings in the ZIP.
Forward outlook
- In year one you build about $8k of equity ($830 loan paydown + $7k appreciation (6.1% local appreciation)).
- Scott County population projected at -42% by 2050 — secular population decline; favor cash flow + early exit over multi-decade hold.
- At projected returns (6.1% appreciation + 3.0% rent growth), your $34k cash investment doubles in ~4 years — after that, you're playing with house money.
- By year 5, paydown + projected appreciation supports a ~$36k cash-out refi (75% LTV) — recoverable capital for the next deal without selling this one.
Negotiation context
- It's been on market 88 days — a 6% lower offer ($113k) is reasonable based on typical stale-listing flexibility.
- 6 sale attempts since 4y ago with the ask held roughly flat each time — persistent listings suggest the price (not the market) is what's stuck; bring a comps-based counter.
- Current owner paid $68k; list at $120k implies a 76% gain — meaningful room to come down on a strong offer.
Risks & watch-outs
- Climate carrying-cost: major wildfire risk; extreme-heat days projected 7→20/yr by 2055 (HVAC capex compounding) — expect insurance premiums to compound above CPI over the hold.
Questions for the listing agent
- It's been on market 88 days. Have you received any prior offers? Is the seller open to a 8% concession, seller financing, or rate buy-down credit?
- Why hasn't it sold? Are there any deal-killer items the seller is aware of (foundation, flood, title, zoning, code violations)?
- Is there a deadline driving the sale (1031 exchange, divorce, estate, relocation)? That informs how much negotiation room exists.
- Schools are F-rated, which usually means shorter tenancies and higher turnover. Who's the typical renter profile here, and what's been the actual vacancy rate?
- What's the average days-on-market for RENTAL listings here right now (not sales)? A rising rental-DOM trend means longer vacancies and softer asking-rent achievability than the comps imply.
- What's the recent tenant-quality profile in this submarket — average credit score on applications, eviction rate, late-payment / NSF rate, and stable-employment percentage? A property-management company in the area should have these aggregated.
- How much new for-sale + rental construction is in the pipeline within 1–3 miles? Heavy new supply typically softens prices + rents 12–24 months out; constrained supply supports both.
Investment metrics
- 1% rule
- 0.92% ✗
- Cap rate
- 7.80%
- Cash-on-cash
- 5.39%
- DSCR
- 1.24
- GRM
- 9.0
CMA / ARV
- ARV (median comp)
- $135,297
- List price
- $120,000
- Delta
- -11.31%
- Verdict
- UNDERPRICED
- Comps
- 20 within 1.0 mi
Show comp detail 8 sales within ~0.75 mi
| Address | Dist | Beds/Ba | Sqft | Sold | Price | $/sf | Match |
|---|---|---|---|---|---|---|---|
| 507 Darlene Dr | 0.63mi | 3/2.0 | 1,253 (-1%) | 2mo | $150,000 | $120 | 68 |
| 700 Grove St | 0.38mi | 3/1.5 | 1,344 (+7%) | 5mo | $122,000 | $91 | 65 |
| 510 Darlene Dr | 0.60mi | 3/2.0 | 1,316 (+4%) | 6mo | $116,000 | $88 | 60 |
| 506 Huntington Ave | 0.10mi | 2/1.0 (-1) | 1,180 (-6%) | 21mo | $154,000 | $131 | 58 |
| 520 Sunset Ridge Rd | 0.43mi | 3/2.0 | 1,144 (-9%) | 15mo | $148,700 | $130 | 52 |
| 903 Broadway St | 0.70mi | 2/1.0 (-1) | 1,198 (-5%) | 3mo | $138,100 | $115 | 47 |
| 201 S Division Ave | 0.51mi | 3/1.5 | 1,439 (+14%) | 21mo | $165,250 | $115 | 33 |
| 413 Darlene Dr | 0.64mi | 3/1.5 | 1,420 (+13%) | 19mo | $170,000 | $120 | 31 |
Match score weights: distance 35% · size 25% · config 20% · recency 20%. Top-matched comps best support the ARV.
Projected returns pro-forma
6.12% appreciation · 3.0% rent growth · sell at horizon
- IRR
- 20.0%
- Equity multiple
- 2.34×
- Total profit
- $45,041
- Equity at exit
- $76,320
- IRR
- 19.2%
- Equity multiple
- 4.71×
- Total profit
- $124,644
- Equity at exit
- $139,170
Cash invested: $33,600 (down + closing). Projections, not guarantees.
Landlord ↔ Tenant lean methodology
- Overall (STATE)
- 92 Strongly Landlord-Friendly
- State Arkansas
- 92 Strongly Landlord-Friendly · R+14
- County
- — inherits STATE
- City
- — inherits STATE
ZIP-level market 72944
- Home prices YoY
- 2.3%
- Active inventory
- 26
- Price-to-rent
- 9.0×
Monthly cashflow live
- Estimated rent
- $1,106 medium interval (Pro) →
- Mortgage (P&I)
- −$629
- Tax from tax record
- −$43 /mo · $520/yr
- Insurance
- −$50
- HOA
- −$0
- Vacancy / Maint / Mgmt
- −$232
- Net cashflow
- $151
Break-even live
UW: 25.0% down · 7.5% · 30yr · 1.5% tax · 5.0% vac · 8.0% maint · 8.0% mgmt
Financing live
Cash to close
- Down payment
- $30,000
- Closing costs
- $3,600
- Reserves months
- —
- Total cash needed
- —
Loan-product check · same deal, 3 products live
Conventional
25% down · 7.5% · 30yr
- Down + closing
- —
- Monthly P&I
- —
- Monthly cashflow
- —
- DSCR
- —
- Eligible?
- —
Personal DTI + credit; lowest rate.
DSCR
20% down · 8.5% · 30yr
- Down + closing
- —
- Monthly P&I
- —
- Monthly cashflow
- —
- DSCR
- —
- Eligible?
- —
No personal income docs; deal must DSCR.
Hard money
10% down · 12.0% · 12mo
- Down + closing
- —
- Monthly P&I
- —
- Monthly cashflow
- —
- DSCR
- —
- Eligible?
- —
Short-term bridge; refi at stabilization.
Listing history 34 events
-
2026-06-19days on market $120,000 Active 88 DOM
-
2026-06-18days on market $120,000 Active 87 DOM
-
2026-06-17days on market $120,000 Active 86 DOM
-
2026-06-16days on market $120,000 Active 85 DOM
-
2026-06-15days on market $120,000 Active 84 DOM
-
2026-06-14days on market $120,000 Active 82 DOM
-
2026-06-12days on market $120,000 Active 81 DOM
-
2026-06-09days on market $120,000 Active 78 DOM
-
2026-06-08days on market $120,000 Active 77 DOM
-
2026-06-07days on market $120,000 Active 76 DOM
-
2026-06-07days on market $120,000 Active 75 DOM
-
2026-06-04days on market $120,000 Active 72 DOM
-
2026-06-02days on market $120,000 Active 71 DOM
-
2026-06-01days on market $120,000 Active 70 DOM
-
2026-05-31days on market $120,000 Active 69 DOM
-
2026-05-31days on market $120,000 Active 68 DOM
-
2026-03-23$120,000 Active 846-char remark
Show marketing remark (846 chars)
Nestled in Mansfield yet reminiscent of a cozy Swiss Alps retreat, this custom-built chalet offers a truly distinctive feel for the area. The lower level welcomes you with beautiful flagstone flooring, a spacious kitchen with dining area, a comfortable family room, utility room, and a convenient guest bath—perfect for everyday living and entertaining. A charming spiral staircase leads upstairs to three bedrooms, all featuring fresh new carpet, along with a full bath. Two of the bedrooms open to private balconies, offering peaceful spots to relax and take in the surroundings. The driveway is accessed from Willis Street and includes a permanent easement for shared parking with the neighboring property. Ideally situated near schools, shopping, and dining, this home blends character, comfort, and convenience in one inviting package.
-
2025-12-19soldstatus $68,200 Closed 210-char remark
Show marketing remark (210 chars)
Auction 11/17/25 @ 1 pm. Charming A-frame with log and wood siding! Appx. 1,260 sq. ft. , featuring 3 bedrooms, 2 baths, and rock floors. Full of character—perfect for a cozy home or investment property.
-
2025-11-18status Pending 210-char remark
Show marketing remark (210 chars)
Auction 11/17/25 @ 1 pm. Charming A-frame with log and wood siding! Appx. 1,260 sq. ft. , featuring 3 bedrooms, 2 baths, and rock floors. Full of character—perfect for a cozy home or investment property.
-
2025-11-17price $68,200 210-char remark
Show marketing remark (210 chars)
Auction 11/17/25 @ 1 pm. Charming A-frame with log and wood siding! Appx. 1,260 sq. ft. , featuring 3 bedrooms, 2 baths, and rock floors. Full of character—perfect for a cozy home or investment property.
-
2025-10-21$1 Active 210-char remark
Show marketing remark (210 chars)
Auction 11/17/25 @ 1 pm. Charming A-frame with log and wood siding! Appx. 1,260 sq. ft. , featuring 3 bedrooms, 2 baths, and rock floors. Full of character—perfect for a cozy home or investment property.
-
2025-09-09soldstatus $50,000 Closed
-
2025-07-21status Pending
-
2025-07-10$1 Active
-
2025-06-05price $125,000
-
2025-05-18price $135,000
-
2025-05-07$140,000 Active
-
2023-02-17soldstatus $55,000
-
2023-02-16soldstatus $55,000
-
2023-02-16
-
2023-02-15soldstatus $55,000
-
2022-10-10$75,000
-
2009-11-23soldstatus $26,818
-
2003-02-26soldstatus $51,000
ⓘ Source: listings_history table (triggers on properties + properties_extension) + one-shot
backfill from property_details.listing_events for pre-trigger history.
Tax reassessment forecast AR · Resets to sale price
- Current annual tax
- $520 · $43/mo
- Projected year-2 tax
- $768 · $64/mo
- Expected delta
- +$248/yr (+$21/mo · 47.7%)
ⓘ Screening estimate from a state-policy table — verify with the county assessor before closing.
Climate risk First Street
- Flood 1/10 Low FEMA zone X · 0% chance over 30 yrs
- Wildfire 7/10 Severe
- Heat 6/10 Major 7 d/yr ≥111°F today · 20 d/yr by 30 yrs out
- Wind 2/10 Low 2% chance of damaging wind over 30 yrs
- Air quality 2/10 Low 0 unhealthy d/yr today · 1 by 30 yrs out
Nearby sold comps map
Loading sold comps map…
Walkable amenities ~0.75 mi
Loading nearby amenities…
Taxation est. · year 1
- Rental income
- $13,269
- − Mortgage interest
- −$6,722
- − Property taxes
- −$520
- − Insurance
- −$600
- − Repairs & maintenance
- −$1,062
- − Management
- −$1,062
- − Depreciation
- −$3,491
- Taxable loss
- −$186
- Est. tax savings @ 24.0%
- +$45
- After-tax cash flow
- $1,856/yr
For passive investors: Depreciation is non-cash, so a rental often shows a tax loss while cash-flowing — sheltering income. Rental losses are passive: they offset passive income freely, and up to $25,000/yr can offset ordinary (W-2) income if you actively participate and your MAGI is under $100k (phasing out to $0 by $150k); unused losses carry forward. On sale, claimed depreciation is recaptured at up to 25%, and gains may owe capital-gains tax (a 1031 exchange can defer both). Figures are a year-1 estimate at your 24.0% rate — not tax advice; consult a CPA.
Schools (NCES district)
- District
- Mansfield School District
- NCES district ID
- 0509330
- Math proficiency
- 37% ▼ -8.00%
- Reading proficiency
- 34% ▼ -8.00%
- Median HH income
- $46,056
- Composite
- 30.41/100
- National rank
- #6245
- State rank
- #110 of 238 in AR
Livability — Mansfield
- Score
- 61/100
- State rank
- #255
- US rank
- #18362
Category grades
Schools grade is shown separately in the Schools card above.
Census & demographics
- Census place
- Mansfield, AR
- Population (ZIP)
- 2,669
Population outlook (Scott County) Hauer SSP2
- Today (2025)
- 8,981 people
- By 2030
- 8,188 · -8.8%
- By 2040
- 6,675 · -25.7%
- By 2050
- 5,228 · -41.8%
- By 2075
- 2,745 · -69.4%
- By 2100
- 1,302 · -85.5%
Race, ethnicity, and origin ACS 2023
- Neighborhood character
- Predominantly White (88%)
- Race & ethnicity
- White 88% Two or more races 7% Hispanic / Latino 4% Black 1% Native American 1%
- Common ancestry
- Slovak 1% Serbian 1% Iranian 1%
- Foreign-born
- 1% · Canada
Political lean MEDSL · Scott
- 2024 margin
- Solid R (+73.5) · D 12.6% · R 86.1% · Other 1.4%
- 2008→2024 swing
- -30.0pp toward R · 2008: -43.5pp · 2024: -73.5pp
- All cycles
- 2024: R+73.5 2020: R+69.8 2016: R+62.0 2012: R+47.7 2008: R+43.5
Not yet ingested
- Civics
- —
Market trends
- HPI YoY
- ▲ 6.12%
- Current HPI
- 273.7329
- Rent YoY
- —
- Metro
- —
- State GDP YoY
- ▲ 3.80%
- F500 in state
- 10
Industry mix (Fortune 500 HQ in AR)
| Industry | F500 HQs | Revenue |
|---|---|---|
| Retail | 1 | $681B |
|
||
| Food / Agriculture | 1 | $53B |
|
||
| Retail / Energy | 1 | $22B |
|
||
| Transportation / Logistics | 1 | $12B |
|
||
| Energy | 1 | $4B |
|
||
Price history
+135.3% since first listed18 events — show timeline
- 2026-03-23 Listed $120,000 WRVBOR
- 2025-12-19 Sold (MLS) $68,200 WRVBOR
- 2025-11-18 Pending — WRVBOR
- 2025-11-17 Price Changed $68,200 WRVBOR
- 2025-10-21 Listed $1 WRVBOR
- 2025-09-09 Sold (MLS) $50,000 WRVBOR
- 2025-07-21 Pending — WRVBOR
- 2025-07-10 Listed $1 WRVBOR
- 2025-06-05 Price Changed $125,000 WRVBOR
- 2025-05-18 Price Changed $135,000 WRVBOR
- 2025-05-07 Listed $140,000 WRVBOR
- 2023-02-17 Sold (Public Records) $55,000 Public Records
- 2023-02-16 Listed — WRVBOR
- 2023-02-16 Sold (MLS) $55,000 WRVBOR
- 2023-02-15 Sold (MLS) $55,000 CARMLS
- 2022-10-10 Listed $75,000 CARMLS
- 2009-11-23 Sold (Public Records) $26,818 Public Records
- 2003-02-26 Sold (Public Records) $51,000 Public Records
Property tax history
+1.2%/yrLatest (2025): $520 · +0.0% YoY. Source: county tax records.
Cash-flow waterfall
monthlySold comps — $/sqft
last 12 mo · ≤1 miLoading sold comps…