 🏗️ New Construction
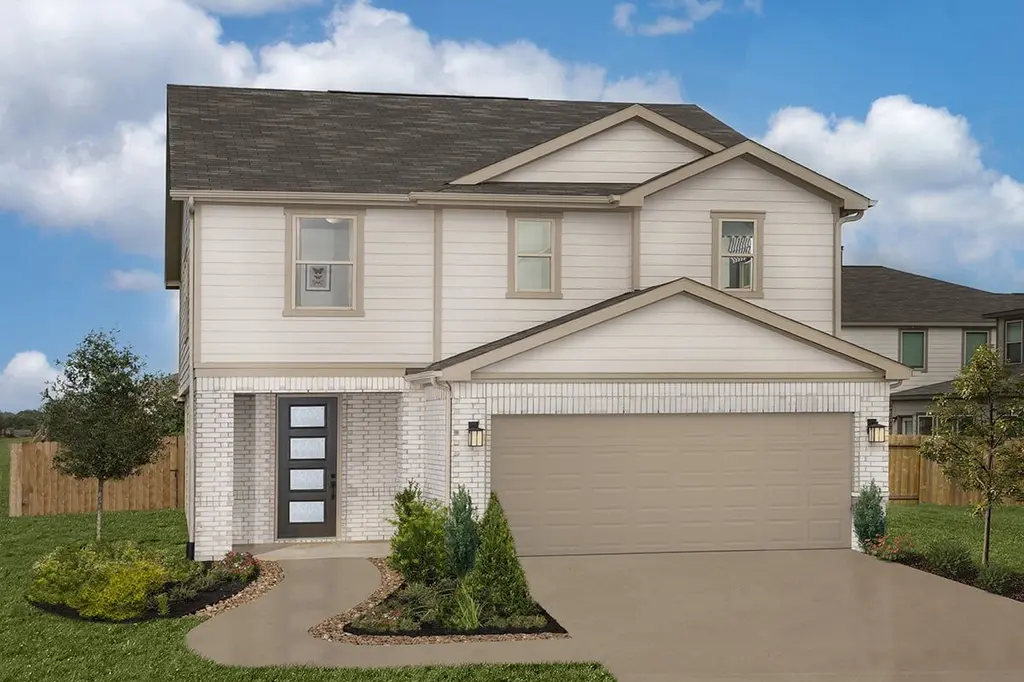
Plan 2070 Plan · Hitchcock, TX
Flood risk No data
- FEMA flood zone
- —
- Chance of flooding over 30 yrs
- —
- Est. flood insurance / yr
- —
Fire risk No data
- Est. fire insurance / yr
- —
Heat risk No data
- Hot days now (above threshold)
- —
- Hot days in 30 yrs
- —
Wind risk No data
- Chance of severe wind over 30 yrs
- —
Air-quality risk No data
- Unhealthy air days now
- —
- Unhealthy air days in 30 yrs
- —
Risk factors via First Street. Map © Google.
Why this score? — see what drove the F grade
The composite is a weighted blend of 9 inputs, each scored 0–100. Each bar is that input's sub-score; the figure is the points it added to the 100-point composite (weight × sub-score).
- Cash flow +9.2/30.0
- ARV discount +7.5/15.0
- Condition / age +4.0/5.0
- Livability +3.4/5.0
- 1% rule +2.8/10.0
- DSCR +2.6/10.0
- Schools +2.6/10.0
- Rent growth +2.5/5.0
- Appreciation +0.0/10.0
$245,995
🖨 Deal sheet (PDF) 📄 Offer letter ✓ Due diligence
Listing remarks MLS
* Granite kitchen countertops * Gas range * Kitchen USB charging receptacle * Dedicated laundry room * Stainless steel appliances * Smart thermostat * 5-panel interior doors * Low-E windows * Walk-in kitchen pantry * Loft * Spacious great room * ENERGY STAR® certified home * Close to ocean * Community park * Commuter-friendly location * Near entertainment and leisure * Volleyball court * Walking paths
Key facts
- Smart thermostat
- Gas range
- 2 garage spots
Tags
Neighborhood map
What this means for you Summary
Snapshot
- This is a 3-bed/2.5-bath single-family listed at $246k. Condition is rated good.
Deal economics
- At list price, monthly cash flow is $-203 ($-2k/yr) — negative.
- To cash-flow at today's rent, offer at most $241k (2.1% below list).
- To meet the 1% rule (rent ≥ 1% of price), the offer needs to be $211k (14.4% below list).
- Recommended offer: $211k (14.4% below list) — sets the bar for 1% rule.
- Cap rate 5.4% vs local median 1.0% in Hitchcock — top-decile yield for the area; either an underpriced asset or a hidden risk that comps aren't pricing in. Stress-test before assuming the spread holds.
Location & tenants
- Location reads 67/100 on livability (#560 in TX) — a middle-class / working-renter tenant base. Strengths: cost of living A+, housing A+; Watch: crime C-, employment D+, amenities F.
- Hitchcock ISD (suburban): math 28% / reading 31% proficiency, ranked #628 of 826 in TX (top 76%) — low school quality limits family demand, transient renter base, plan for 1-2y turnover; 72% free/reduced lunch — lower-income household profile, screen leases tightly.
- Zoned schools: Hitchcock Pri (453 students, 85% FRL); Crosby Middle (math 25% / reading 33%, grade F, #1,103 of 1,662 statewide, top 67%, 410 students, 84% FRL); Hitchcock H S (math 47% / reading 47%, grade D-, #591 of 1,632 statewide, top 38%, 470 students, 77% FRL).
- Market conditions: 302 active listings in the ZIP; 2 comparable units currently listed for rent nearby; solid renter incomes; 3,258 units permitted in Galveston County in 2024 (0 in 5+ unit buildings).
- This rent runs 33% of the median local income ($76k/yr) — at the standard rent-burdened threshold; future hikes will face affordability resistance.
Forward outlook
- Local home prices are declining (-3.0%/yr); year-one equity from $2k of loan paydown is wiped out by about $8k of value loss. Plan a longer hold.
- Galveston County population projected at +43% by 2050 — long-run rental-demand tailwind backs the buy-and-hold thesis.
Negotiation context
- It's been on market 388 days — a 12% lower offer ($216k) is reasonable based on typical stale-listing flexibility.
Questions for the listing agent
- What do current leases actually rent for vs. the listed asking? Can we see a recent rent roll and the last 12 months of T-12 income?
- It's been on market 388 days. Have you received any prior offers? Is the seller open to a 14% concession, seller financing, or rate buy-down credit?
- Why hasn't it sold? Are there any deal-killer items the seller is aware of (foundation, flood, title, zoning, code violations)?
- Is there a deadline driving the sale (1031 exchange, divorce, estate, relocation)? That informs how much negotiation room exists.
- Schools are D-rated, which usually means shorter tenancies and higher turnover. Who's the typical renter profile here, and what's been the actual vacancy rate?
- The area grade is low — what's the realistic commute time and amenity access for the typical tenant pool here? Any planned neighborhood developments (good or bad) we should know about?
- What's the average days-on-market for RENTAL listings here right now (not sales)? A rising rental-DOM trend means longer vacancies and softer asking-rent achievability than the comps imply.
- What's the recent tenant-quality profile in this submarket — average credit score on applications, eviction rate, late-payment / NSF rate, and stable-employment percentage? A property-management company in the area should have these aggregated.
- How much new for-sale + rental construction is in the pipeline within 1–3 miles? Heavy new supply typically softens prices + rents 12–24 months out; constrained supply supports both.
Investment metrics
- 1% rule
- 0.78% ✗
- Cap rate
- 5.39%
- Cash-on-cash
- -3.22%
- DSCR
- 0.86
- GRM
- 10.7
CMA / ARV
- ARV (median comp)
- $270,265
- List price
- $245,995
- Delta
- -8.98%
- Verdict
- FAIR
- Comps
- 20 within 1.0 mi
Show comp detail 12 sales within ~0.75 mi
| Address | Dist | Beds/Ba | Sqft | Sold | Price | $/sf | Match |
|---|---|---|---|---|---|---|---|
| 26251 Astral Way | 0.47mi | 4/2.5 (+1) | 2,139 (+3%) | 2mo | $299,990 | $140 | 66 |
| 1226 Sacred Light Ln | 0.63mi | 4/3.0 (+1) | 2,069 (-0%) | 1mo | $292,990 | $142 | 63 |
| 1333 Blue Moon Ln | 0.66mi | 4/2.5 (+1) | 2,169 (+5%) | 3mo | $292,990 | $135 | 54 |
| 106 Wedgewood Ave | 0.68mi | 4/2.0 (+1) | 2,155 (+4%) | 2mo | $274,900 | $128 | 52 |
| 640 Burlina Rd | 0.68mi | 4/2.5 (+1) | 1,922 (-7%) | 2mo | $283,990 | $148 | 50 |
| 862 Sand Crab Ln | 0.67mi | 3/2.0 | 1,873 (-10%) | 1mo | $255,000 | $136 | 50 |
| 612 Burlina Rd | 0.68mi | 4/2.5 (+1) | 1,922 (-7%) | 2mo | $283,990 | $148 | 50 |
| 604 Burlina Rd | 0.68mi | 4/2.5 (+1) | 1,922 (-7%) | 3mo | $285,990 | $149 | 49 |
| 1341 Blue Moon Ln | 0.68mi | 4/2.0 (+1) | 1,872 (-10%) | 1mo | $295,990 | $158 | 45 |
| 656 Blackberry Ln | 0.70mi | 4/3.5 (+1) | 2,231 (+8%) | 2mo | $317,810 | $142 | 44 |
| 759 Red Mulberry St | 0.72mi | 4/2.0 (+1) | 1,897 (-8%) | 3mo | $304,775 | $161 | 43 |
| 1234 Sacred Light Ln | 0.63mi | 4/3.0 (+1) | 2,364 (+14%) | 1mo | $318,990 | $135 | 39 |
Match score weights: distance 35% · size 25% · config 20% · recency 20%. Top-matched comps best support the ARV.
Projected returns pro-forma
-3.0% appreciation · 3.0% rent growth · sell at horizon
- IRR
- -21.7%
- Equity multiple
- 0.25×
- Total profit
- $-56,714
- Equity at exit
- $40,297
- IRR
- -15.4%
- Equity multiple
- 0.13×
- Total profit
- $-65,934
- Equity at exit
- $23,368
Cash invested: $75,674 (down + closing). Projections, not guarantees.
Landlord ↔ Tenant lean methodology
- Overall (STATE)
- 87 Strongly Landlord-Friendly
- State Texas
- 87 Strongly Landlord-Friendly · R+5
- County
- — inherits STATE
- City
- — inherits STATE
ZIP-level market 77563
- Active inventory
- 302
- Price-to-rent
- 9.7×
Monthly cashflow live
- Estimated rent
- $2,107 medium interval (Pro) →
- Mortgage (P&I)
- −$1,417
- Tax est. 1.5%
- −$338 /mo · $4,054/yr
- Insurance
- −$113
- HOA
- −$0
- Vacancy / Maint / Mgmt
- −$442
- Net cashflow
- $-203
Break-even live
Sensitivity live
| Price | -10% $-17 | -5% $-110 | +0% $-203 | +5% $-297 | +10% $-390 |
|---|---|---|---|---|---|
| Rent | -10% $-370 | -5% $-287 | +0% $-203 | +5% $-120 | +10% $-37 |
| Rate | -1.0pp $-67 | -0.5pp $-135 | base $-203 | +0.5pp $-273 | +1.0pp $-345 |
UW: 25.0% down · 7.5% · 30yr · 1.5% tax · 5.0% vac · 8.0% maint · 8.0% mgmt
Financing live
Cash to close
- Down payment
- $67,566
- Closing costs
- $8,108
- Reserves months
- —
- Total cash needed
- —
Loan-product check · same deal, 3 products live
Conventional
25% down · 7.5% · 30yr
- Down + closing
- —
- Monthly P&I
- —
- Monthly cashflow
- —
- DSCR
- —
- Eligible?
- —
Personal DTI + credit; lowest rate.
DSCR
20% down · 8.5% · 30yr
- Down + closing
- —
- Monthly P&I
- —
- Monthly cashflow
- —
- DSCR
- —
- Eligible?
- —
No personal income docs; deal must DSCR.
Hard money
10% down · 12.0% · 12mo
- Down + closing
- —
- Monthly P&I
- —
- Monthly cashflow
- —
- DSCR
- —
- Eligible?
- —
Short-term bridge; refi at stabilization.
Rent comps 2 comps
| Address | Beds | Baths | Sqft | Rent | $/sqft | DOM | Units | Dist |
|---|---|---|---|---|---|---|---|---|
| 453 Maple Bend Ln La Marque, TX | 3.0 | 2.0 | 1860 | $2,071 | $1.11 | 22d | 1 | 1.35mi |
| 14403 Daniel Shores Dr La Marque, TX | 4.0 | 3.0–3.5 | 1872 | $2,600 | $1.39 | 0d | 12 | 1.39mi |
Listing history 21 events
-
2026-06-21days on market $245,995 Active 388 DOM
-
2026-06-18days on market $245,995 Active 385 DOM
-
2026-06-17days on market $245,995 Active 384 DOM
-
2026-06-16days on market $245,995 Active 383 DOM
-
2026-06-15days on market $245,995 Active 382 DOM
-
2026-06-13days on market $245,995 Active 380 DOM
-
2026-06-13days on market $245,995 Active 379 DOM
-
2026-06-09days on market $245,995 Active 376 DOM
-
2026-06-08days on market $245,995 Active 375 DOM
-
2026-06-07days on market $245,995 Active 374 DOM
-
2026-06-04days on market $245,995 Active 371 DOM
-
2026-06-03days on market $245,995 Active 370 DOM
-
2026-06-02days on market $245,995 Active 369 DOM
-
2026-06-01days on market $245,995 Active 368 DOM
-
2026-05-31days on market $245,995 Active 367 DOM
-
2026-01-22price $245,995 443-char remark
Show marketing remark (443 chars)
* Granite kitchen countertops * Gas range * Kitchen USB charging receptacle * Dedicated laundry room * Stainless steel appliances * Smart thermostat * 5-panel interior doors * Low-E windows * Walk-in kitchen pantry * Loft * Spacious great room * ENERGY STAR® certified home * Close to ocean * Community park * Commuter-friendly location * Near entertainment and leisure * Volleyball court * Walking paths
-
2025-11-18price $250,995 443-char remark
Show marketing remark (443 chars)
* Granite kitchen countertops * Gas range * Kitchen USB charging receptacle * Dedicated laundry room * Stainless steel appliances * Smart thermostat * 5-panel interior doors * Low-E windows * Walk-in kitchen pantry * Loft * Spacious great room * ENERGY STAR® certified home * Close to ocean * Community park * Commuter-friendly location * Near entertainment and leisure * Volleyball court * Walking paths
-
2025-11-10price $246,995 443-char remark
Show marketing remark (443 chars)
* Granite kitchen countertops * Gas range * Kitchen USB charging receptacle * Dedicated laundry room * Stainless steel appliances * Smart thermostat * 5-panel interior doors * Low-E windows * Walk-in kitchen pantry * Loft * Spacious great room * ENERGY STAR® certified home * Close to ocean * Community park * Commuter-friendly location * Near entertainment and leisure * Volleyball court * Walking paths
-
2025-09-16price $244,995 443-char remark
Show marketing remark (443 chars)
* Granite kitchen countertops * Gas range * Kitchen USB charging receptacle * Dedicated laundry room * Stainless steel appliances * Smart thermostat * 5-panel interior doors * Low-E windows * Walk-in kitchen pantry * Loft * Spacious great room * ENERGY STAR® certified home * Close to ocean * Community park * Commuter-friendly location * Near entertainment and leisure * Volleyball court * Walking paths
-
2025-06-14price $239,995 443-char remark
Show marketing remark (443 chars)
* Granite kitchen countertops * Gas range * Kitchen USB charging receptacle * Dedicated laundry room * Stainless steel appliances * Smart thermostat * 5-panel interior doors * Low-E windows * Walk-in kitchen pantry * Loft * Spacious great room * ENERGY STAR® certified home * Close to ocean * Community park * Commuter-friendly location * Near entertainment and leisure * Volleyball court * Walking paths
-
2025-05-29$237,995 Active 443-char remark
Show marketing remark (443 chars)
* Granite kitchen countertops * Gas range * Kitchen USB charging receptacle * Dedicated laundry room * Stainless steel appliances * Smart thermostat * 5-panel interior doors * Low-E windows * Walk-in kitchen pantry * Loft * Spacious great room * ENERGY STAR® certified home * Close to ocean * Community park * Commuter-friendly location * Near entertainment and leisure * Volleyball court * Walking paths
ⓘ Source: listings_history table (triggers on properties + properties_extension) + one-shot
backfill from property_details.listing_events for pre-trigger history.
Nearby sold comps map
Loading sold comps map…
Walkable amenities ~0.75 mi
Loading nearby amenities…
Taxation est. · year 1
- Rental income
- $25,282
- − Mortgage interest
- −$15,139
- − Property taxes
- −$4,054
- − Insurance
- −$1,351
- − Repairs & maintenance
- −$2,023
- − Management
- −$2,023
- − Depreciation
- −$7,862
- Taxable loss
- −$7,170
- Est. tax savings @ 24.0%
- +$1,721
- After-tax cash flow
- $-719/yr
For passive investors: Depreciation is non-cash, so a rental often shows a tax loss while cash-flowing — sheltering income. Rental losses are passive: they offset passive income freely, and up to $25,000/yr can offset ordinary (W-2) income if you actively participate and your MAGI is under $100k (phasing out to $0 by $150k); unused losses carry forward. On sale, claimed depreciation is recaptured at up to 25%, and gains may owe capital-gains tax (a 1031 exchange can defer both). Figures are a year-1 estimate at your 24.0% rate — not tax advice; consult a CPA.
Condition & rehab AI · 3 photos
The home is in good condition with a good exterior and interior. It has a good foundation and structure, and the systems and appliances are in good condition. The home is close to amenities and has a good location. The home is ready for a fresh coat of paint and some landscaping improvements to enhance its curb appeal and rental value.
Value-add opportunities
- Resale Paint exterior siding — Fresh paint can enhance curb appeal and property value.
- Rental Landscaping improvements — Well-maintained landscaping can attract tenants and increase rental value.
- Both Update kitchen appliances — Upgrading to modern appliances can attract buyers and renters alike.
Renovation cost estimate screening
Value-add ROI direction
- Resale Paint exterior siding — Fresh paint can enhance curb appeal and property value. ↑
- Rental Landscaping improvements — Well-maintained landscaping can attract tenants and increase rental value. ↑
- Both Update kitchen appliances — Upgrading to modern appliances can attract buyers and renters alike. ↑
ⓘ Cost ranges are severity-bucket heuristics (US national rule-of-thumb). Get contractor quotes + a written scope before underwriting a rehab budget.
Schools (NCES district)
- District
- Hitchcock ISD
- NCES district ID
- 4823310
- Math proficiency
- 28% ▼ -2.00%
- Reading proficiency
- 31% ▼ -4.00%
- Median HH income
- $47,041
- Composite
- 25.5/100
- National rank
- #7439
- State rank
- #628 of 826 in TX
Livability — Hitchcock
- Score
- 67/100
- State rank
- #560
- US rank
- #10752
Category grades
Schools grade is shown separately in the Schools card above.
Census & demographics
- Census place
- Hitchcock, TX
- County
- Galveston County · 357,330 people
- City population
- 9,955
- Metro
- Houston-The Woodlands-Sugar Land, TX
- Population (ZIP)
- 9,955
- Household income
- $75,806
- Rent vs Own
- Severe rent burden
- 317.0
Population outlook (Galveston County) Hauer SSP2
- Today (2025)
- 390,640 people
- By 2030
- 425,226 · +8.9%
- By 2040
- 493,765 · +26.4%
- By 2050
- 559,698 · +43.3%
- By 2075
- 719,260 · +84.1%
- By 2100
- 819,628 · +109.8%
Race, ethnicity, and origin ACS 2023
- Neighborhood character
- Diverse neighborhood (Simpson 0.66)
- Race & ethnicity
- White 49% Hispanic / Latino 25% Black 21% Two or more races 14%
- Hispanic origin (detail)
- Mexican 24%
- Common ancestry
- Italian 4% Slovak 2% Serbian 2%
- Foreign-born
- 7% · Canada, Vietnam
- Languages at home
- 83% English-only · Spanish 16%
Political lean MEDSL · Galveston
- 2024 margin
- Strong R (+27.4) · D 35.7% · R 63.1% · Other 1.2%
- 2008→2024 swing
- -7.9pp toward R · 2008: -19.5pp · 2024: -27.4pp
- All cycles
- 2024: R+27.4 2020: R+22.6 2016: R+22.6 2012: R+26.9 2008: R+19.5
Not yet ingested
- Civics
- —
Market trends
- HPI YoY
- ▼ -145.04%
- Current HPI
- 261.4711
- Rent YoY
- —
- Metro
- Houston-The Woodlands-Sugar Land, TX
- State GDP YoY
- ▲ 3.95%
- F500 in state
- 110
Industry mix (Fortune 500 HQ in TX)
| Industry | F500 HQs | Revenue |
|---|---|---|
| Energy | 16 | $1,198B |
|
||
| Technology | 5 | $198B |
|
||
| Engineering / Construction | 4 | $72B |
|
||
| Energy Services | 3 | $60B |
|
||
| Utilities | 3 | $41B |
|
||
| Healthcare | 2 | $330B |
|
||
Price history
+3.4% since first listed6 events — show timeline
- 2026-01-22 Price Changed $245,995 Zillow
- 2025-11-18 Price Changed $250,995 Zillow
- 2025-11-10 Price Changed $246,995 Zillow
- 2025-09-16 Price Changed $244,995 Zillow
- 2025-06-14 Price Changed $239,995 Zillow
- 2025-05-29 Listed $237,995 Zillow
Cash-flow waterfall
monthlySold comps — $/sqft
last 12 mo · ≤1 miLoading sold comps…