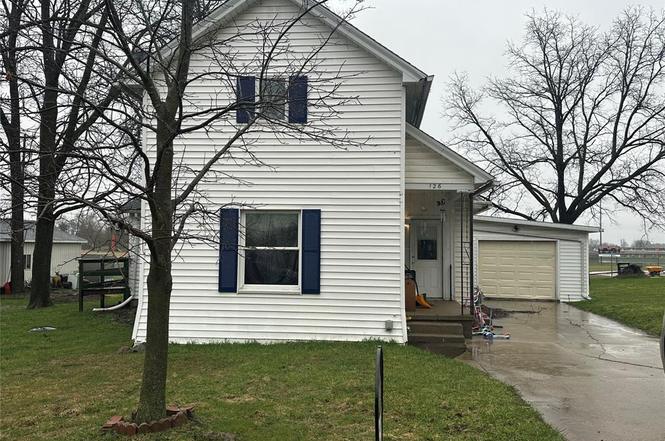
126 W Mason · Perry, MI
Flood risk 1/10 · Minimal
- FEMA flood zone
- X (unshaded)
- Chance of flooding over 30 yrs
- 0.0%
- Est. flood insurance / yr
- $473 – $860
Fire risk 1/10 · Minimal
- Est. fire insurance / yr
- $784 – $1,456
Heat risk 2/10 · Minimal
- Hot days now (above 96°F)
- 7 days/yr
- Hot days in 30 yrs
- 15 days/yr
Wind risk 2/10 · Minimal
- Chance of severe wind over 30 yrs
- —
Air-quality risk 2/10 · Minimal
- Unhealthy air days now
- 1 days/yr
- Unhealthy air days in 30 yrs
- 2 days/yr
Risk factors via First Street. Map © Google.
Why this score? — see what drove the C+ grade
The composite is a weighted blend of 9 inputs, each scored 0–100. Each bar is that input's sub-score; the figure is the points it added to the 100-point composite (weight × sub-score).
- Cash flow +21.9/30.0
- ARV discount +15.0/15.0
- DSCR +7.0/10.0
- 1% rule +6.0/10.0
- Livability +3.8/5.0
- Schools +2.8/10.0
- Rent growth +2.5/5.0
- Condition / age +2.5/5.0
- Appreciation +0.0/10.0
$139,900
🖨 Deal sheet 📄 Offer letter ✓ Due diligence
Listing remarks MLS
Spacious 4-bedroom, 2-bath home with a 1.5-car attached garage, ideally located near schools and a park. This home offers a functional layout and a nice backyard perfect for outdoor enjoyment or future entertaining. With a little TLC, this property presents a great opportunity to add value and make it your own, or to continue to use as a rental for income. Convenient location and solid potential make this one worth a look!
Key facts
- Attached garage
- Nice backyard
- Functional layout
Tags
Neighborhood map
What this means for you Summary
Snapshot
- This is a 4-bed/2.0-bath single-family listed at $140k.
Deal economics
- At list price, monthly cash flow is $220 ($3k/yr) — positive.
- The deal already cash-flows at list — no discount required.
- Meets the 1% rule at list price ($2k rent vs $140k).
- Recommended offer: $123k (12.0% below list) — sets the bar for market timing.
- Cap rate 8.2% vs local median 2.2% in Perry — top-decile yield for the area; either an underpriced asset or a hidden risk that comps aren't pricing in. Stress-test before assuming the spread holds.
Location & tenants
- Location reads 76/100 on livability (#142 in MI, #3,653 nationally) — a middle-class / working-renter tenant base. Strengths: crime A+, cost of living A+, housing A+; Watch: amenities F, commute F, health & safety D-.
- Morrice Area Schools (rural): math 20% / reading 43% proficiency, ranked #323 of 540 in MI (top 60%) — families likely to look elsewhere, expect single-tenant / working-renter base with shorter leases.
- Market conditions: 14 active listings in the ZIP; 74 units permitted in Shiawassee County in 2024 (0 in 5+ unit buildings).
Forward outlook
- Local home prices are declining (-3.0%/yr); year-one equity from $967 of loan paydown is wiped out by about $4k of value loss. Plan a longer hold.
- Shiawassee County population projected at -25% by 2050 — secular population decline; favor cash flow + early exit over multi-decade hold.
Negotiation context
- It's been on market 134 days — a 12% lower offer ($123k) is reasonable based on typical stale-listing flexibility.
- 8 sale attempts since 14y ago with the ask held roughly flat each time — persistent listings suggest the price (not the market) is what's stuck; bring a comps-based counter.
- Current owner paid $92k; list at $140k implies a 51% gain — meaningful room to come down on a strong offer.
Risks & watch-outs
- Watch-outs: built in 1900 — expect roof / HVAC / electrical / plumbing capex.
Questions for the listing agent
- It's been on market 134 days. Have you received any prior offers? Is the seller open to a 12% concession, seller financing, or rate buy-down credit?
- Built in 1900 — when were the roof, HVAC, electrical panel, plumbing, and water heater last replaced?
- Why hasn't it sold? Are there any deal-killer items the seller is aware of (foundation, flood, title, zoning, code violations)?
- Is there a deadline driving the sale (1031 exchange, divorce, estate, relocation)? That informs how much negotiation room exists.
- What's the average days-on-market for RENTAL listings here right now (not sales)? A rising rental-DOM trend means longer vacancies and softer asking-rent achievability than the comps imply.
- What's the recent tenant-quality profile in this submarket — average credit score on applications, eviction rate, late-payment / NSF rate, and stable-employment percentage? A property-management company in the area should have these aggregated.
- How much new for-sale + rental construction is in the pipeline within 1–3 miles? Heavy new supply typically softens prices + rents 12–24 months out; constrained supply supports both.
Investment metrics
- 1% rule
- 1.10% ✓
- Cap rate
- 8.18%
- Cash-on-cash
- 6.73%
- DSCR
- 1.30
- GRM
- 7.6
CMA / ARV
- ARV (median comp)
- $169,364
- List price
- $139,900
- Delta
- -17.40%
- Verdict
- UNDERPRICED
- Comps
- 20 within 1.0 mi
Show comp detail 12 sales within ~0.75 mi
| Address | Dist | Beds/Ba | Sqft | Sold | Price | $/sf | Match |
|---|---|---|---|---|---|---|---|
| 120 W Mason St | 0.01mi | 3/1.0 (-1) | 1,956 (+10%) | 1mo | $200,000 | $102 | 73 |
| 335 Main St | 0.22mi | 4/1.0 | 1,885 (+6%) | 11mo | $154,000 | $82 | 68 |
| 102 E Second St | 0.31mi | 3/2.0 (-1) | 1,608 (-10%) | 12mo | $190,000 | $118 | 54 |
| 231 E South St | 0.57mi | 3/2.5 (-1) | 1,944 (+9%) | 3mo | $260,000 | $134 | 49 |
| 520 Pond Vw | 0.41mi | 3/2.0 (-1) | 1,568 (-12%) | 12mo | $40,000 | $26 | 46 |
| 730 W Lansing Rd | 0.66mi | 3/2.0 (-1) | 1,779 (-0%) | 22mo | $150,000 | $84 | 46 |
| 301 Saphire St | 0.69mi | 4/2.5 | 1,764 (-1%) | 22mo | $305,000 | $173 | 45 |
| 337 E Second St | 0.42mi | 3/1.0 (-1) | 1,536 (-14%) | 4mo | $190,000 | $124 | 45 |
| 148 Hidden Rdg | 0.52mi | 3/2.0 (-1) | 1,620 (-9%) | 17mo | $45,000 | $28 | 41 |
| 228 Hidden Rdg | 0.52mi | 4/3.0 | 1,976 (+11%) | 19mo | $87,500 | $44 | 38 |
| 11175 S Morrice Rd | 0.68mi | 3/2.0 (-1) | 1,568 (-12%) | 6mo | $154,500 | $99 | 38 |
| 126 Walker Dr | 0.52mi | 3/2.0 (-1) | 1,544 (-14%) | 20mo | $242,000 | $157 | 32 |
Match score weights: distance 35% · size 25% · config 20% · recency 20%. Top-matched comps best support the ARV.
Projected returns pro-forma
-3.0% appreciation · 3.0% rent growth · sell at horizon
- IRR
- -5.9%
- Equity multiple
- 0.78×
- Total profit
- $-8,637
- Equity at exit
- $20,860
- IRR
- 3.7%
- Equity multiple
- 1.27×
- Total profit
- $10,667
- Equity at exit
- $12,096
Cash invested: $39,172 (down + closing). Projections, not guarantees.
Landlord ↔ Tenant lean methodology
- Overall (STATE)
- 62 Landlord-Friendly
- State Michigan
- 62 Landlord-Friendly · EVEN
- County
- — inherits STATE
- City
- — inherits STATE
ZIP-level market 48857
- Home prices YoY
- -7.5%
- Active inventory
- 14
- Price-to-rent
- 7.6×
Monthly cashflow live
- Estimated rent
- $1,542 medium interval (Pro) →
- Mortgage (P&I)
- −$734
- Tax from tax record
- −$206 /mo · $2,476/yr
- Insurance
- −$58
- HOA
- −$0
- Vacancy / Maint / Mgmt
- −$324
- Net cashflow
- $220
Break-even live
UW: 25.0% down · 7.5% · 30yr · 1.5% tax · 5.0% vac · 8.0% maint · 8.0% mgmt
Financing live
Cash to close
- Down payment
- $34,975
- Closing costs
- $4,197
- Reserves months
- —
- Total cash needed
- —
Loan-product check · same deal, 3 products live
Conventional
25% down · 7.5% · 30yr
- Down + closing
- —
- Monthly P&I
- —
- Monthly cashflow
- —
- DSCR
- —
- Eligible?
- —
Personal DTI + credit; lowest rate.
DSCR
20% down · 8.5% · 30yr
- Down + closing
- —
- Monthly P&I
- —
- Monthly cashflow
- —
- DSCR
- —
- Eligible?
- —
No personal income docs; deal must DSCR.
Hard money
10% down · 12.0% · 12mo
- Down + closing
- —
- Monthly P&I
- —
- Monthly cashflow
- —
- DSCR
- —
- Eligible?
- —
Short-term bridge; refi at stabilization.
Listing history 36 events
-
2026-06-18days on market $139,900 Active 134 DOM
-
2026-06-17days on market $139,900 Active 133 DOM
-
2026-06-16days on market $139,900 Active 132 DOM
-
2026-06-15days on market $139,900 Active 131 DOM
-
2026-06-13days on market $139,900 Active 129 DOM
-
2026-06-12days on market $139,900 Active 128 DOM
-
2026-06-09days on market $139,900 Active 125 DOM
-
2026-06-08days on market $139,900 Active 124 DOM
-
2026-06-07days on market $139,900 Active 123 DOM
-
2026-06-05days on market $139,900 Active 121 DOM
-
2026-06-04days on market $139,900 Active 119 DOM
-
2026-06-02days on market $139,900 Active 118 DOM
-
2026-06-01days on market $139,900 Active 117 DOM
-
2026-05-31days on market $139,900 Active 116 DOM
-
2026-05-31days on market $139,900 Active 115 DOM
-
2026-04-09price $139,900 426-char remark
Show marketing remark (426 chars)
Spacious 4-bedroom, 2-bath home with a 1.5-car attached garage, ideally located near schools and a park. This home offers a functional layout and a nice backyard perfect for outdoor enjoyment or future entertaining. With a little TLC, this property presents a great opportunity to add value and make it your own, or to continue to use as a rental for income. Convenient location and solid potential make this one worth a look!
-
2026-04-08price $139,900 426-char remark
Show marketing remark (426 chars)
Spacious 4-bedroom, 2-bath home with a 1.5-car attached garage, ideally located near schools and a park. This home offers a functional layout and a nice backyard perfect for outdoor enjoyment or future entertaining. With a little TLC, this property presents a great opportunity to add value and make it your own, or to continue to use as a rental for income. Convenient location and solid potential make this one worth a look!
-
2026-02-04$145,000 Active 426-char remark
Show marketing remark (426 chars)
Spacious 4-bedroom, 2-bath home with a 1.5-car attached garage, ideally located near schools and a park. This home offers a functional layout and a nice backyard perfect for outdoor enjoyment or future entertaining. With a little TLC, this property presents a great opportunity to add value and make it your own, or to continue to use as a rental for income. Convenient location and solid potential make this one worth a look!
-
2022-05-31soldstatus $92,500
-
2022-05-27soldstatus $92,500 Sold
-
2022-05-27soldstatus $92,500 Closed
-
2022-05-18status Pending
-
2022-05-18status Pending
-
2022-05-13$99,900 Active
-
2022-05-13$99,900 Active
-
2022-05-09historical $99,900
-
2022-05-09historical $99,900
-
2017-06-23soldstatus $46,550
-
2012-06-08soldstatus $11,394
-
2012-06-08soldstatus $11,394
-
2012-06-08soldstatus $11,394
-
2012-03-20$32,000
-
2012-03-20$32,000
-
2012-03-19$32,000
-
2012-03-19$32,000
ⓘ Source: listings_history table (triggers on properties + properties_extension) + one-shot
backfill from property_details.listing_events for pre-trigger history.
Tax reassessment forecast MI · Partial reset (capped growth)
- Current annual tax
- $2,476 · $206/mo
- Projected year-2 tax
- $2,476 · $206/mo
- Expected delta
- $0/yr ($0/mo · -0.0%)
ⓘ Screening estimate from a state-policy table — verify with the county assessor before closing.
Climate risk First Street
- Flood 1/10 Low FEMA zone X (unshaded) · 0% chance over 30 yrs
- Wildfire 1/10 Low
- Heat 2/10 Low 7 d/yr ≥96°F today · 15 d/yr by 30 yrs out
- Wind 2/10 Low
- Air quality 2/10 Low 1 unhealthy d/yr today · 2 by 30 yrs out
Nearby sold comps map
Loading sold comps map…
Walkable amenities ~0.75 mi
Loading nearby amenities…
Taxation est. · year 1
- Rental income
- $18,500
- − Mortgage interest
- −$7,837
- − Property taxes
- −$2,476
- − Insurance
- −$700
- − Repairs & maintenance
- −$1,480
- − Management
- −$1,480
- − Depreciation
- −$4,070
- Taxable income
- $458
- Est. tax owed @ 24.0%
- −$110
- After-tax cash flow
- $2,526/yr
For passive investors: Depreciation is non-cash, so a rental often shows a tax loss while cash-flowing — sheltering income. Rental losses are passive: they offset passive income freely, and up to $25,000/yr can offset ordinary (W-2) income if you actively participate and your MAGI is under $100k (phasing out to $0 by $150k); unused losses carry forward. On sale, claimed depreciation is recaptured at up to 25%, and gains may owe capital-gains tax (a 1031 exchange can defer both). Figures are a year-1 estimate at your 24.0% rate — not tax advice; consult a CPA.
Schools (NCES district)
- District
- Morrice Area Schools
- NCES district ID
- 2624630
- Math proficiency
- 20% ▼ -5.00%
- Reading proficiency
- 43% ▼ -1.00%
- Median HH income
- $57,064
- Composite
- 28.03/100
- National rank
- #6845
- State rank
- #323 of 540 in MI
Livability — Perry
- Score
- 76/100
- State rank
- #142
- US rank
- #3653
Category grades
Schools grade is shown separately in the Schools card above.
Census & demographics
- Census place
- Morrice, MI
- Population (ZIP)
- 3,488
Population outlook (Shiawassee County) Hauer SSP2
- Today (2025)
- 64,238 people
- By 2030
- 61,434 · -4.4%
- By 2040
- 55,054 · -14.3%
- By 2050
- 48,426 · -24.6%
- By 2075
- 35,995 · -44.0%
- By 2100
- 26,678 · -58.5%
Race, ethnicity, and origin ACS 2023
- Neighborhood character
- Predominantly White (93%)
- Race & ethnicity
- White 93% Two or more races 4% Hispanic / Latino 2%
- Common ancestry
- Italian 7% Lithuanian 6% Slovak 3%
- Foreign-born
- 0%
- Languages at home
- 98% English-only · German/W. Germanic 1% Spanish 1%
Political lean MEDSL · Shiawassee
- 2024 margin
- Strong R (+23.1) · D 37.7% · R 60.8% · Other 1.6%
- 2008→2024 swing
- -31.7pp toward R · 2008: 8.6pp · 2024: -23.1pp
- All cycles
- 2024: R+23.1 2020: R+19.9 2016: R+19.6 2012: D+3.7 2008: D+8.6
Not yet ingested
- Civics
- —
Market trends
- HPI YoY
- ▼ -22.21%
- Current HPI
- 273.1644
- Rent YoY
- —
- Metro
- —
- State GDP YoY
- ▲ 1.37%
- F500 in state
- 28
Industry mix (Fortune 500 HQ in MI)
| Industry | F500 HQs | Revenue |
|---|---|---|
| Automotive Parts | 3 | $48B |
|
||
| Automotive | 2 | $372B |
|
||
| Chemicals | 1 | $45B |
|
||
| Automotive Retail | 1 | $29B |
|
||
| Healthcare / Medical Devices | 1 | $23B |
|
||
| Automotive Technology | 1 | $20B |
|
||
Price history
+337.2% since first listed21 events — show timeline
- 2026-04-09 Price Changed $139,900 MiRealSource-MiMLS
- 2026-04-08 Price Changed $139,900 REALCOMP
- 2026-02-04 Listed $145,000 REALCOMP
- 2026-02-04 Listed $145,000 MiRealSource-MiMLS
- 2022-05-31 Sold (Public Records) $92,500 Public Records
- 2022-05-27 Sold (MLS) $92,500 MiRealSource-MiMLS
- 2022-05-27 Sold (MLS) $92,500 REALCOMP
- 2022-05-18 Pending — REALCOMP
- 2022-05-18 Pending — MiRealSource-MiMLS
- 2022-05-13 Listed $99,900 REALCOMP
- 2022-05-13 Listed $99,900 MiRealSource-MiMLS
- 2022-05-09 Coming Soon $99,900 REALCOMP
- 2022-05-09 Coming Soon $99,900 MiRealSource-MiMLS
- 2017-06-23 Sold (Public Records) $46,550 Public Records
- 2012-06-08 Sold (MLS) $11,394 REALCOMP
- 2012-06-08 Sold (MLS) $11,394 MiRealSource-MiMLS
- 2012-06-08 Sold (MLS) $11,394 REALCOMP
- 2012-03-20 Listed $32,000 MiRealSource-MiMLS
- 2012-03-20 Listed $32,000 REALCOMP
- 2012-03-19 Listed $32,000 REALCOMP
- 2012-03-19 Listed $32,000 MiRealSource-MiMLS
Property tax history
+1.6%/yrLatest (2025): $2,476 · -46.1% YoY. Source: county tax records.
Cash-flow waterfall
monthlySold comps — $/sqft
last 12 mo · ≤1 miLoading sold comps…