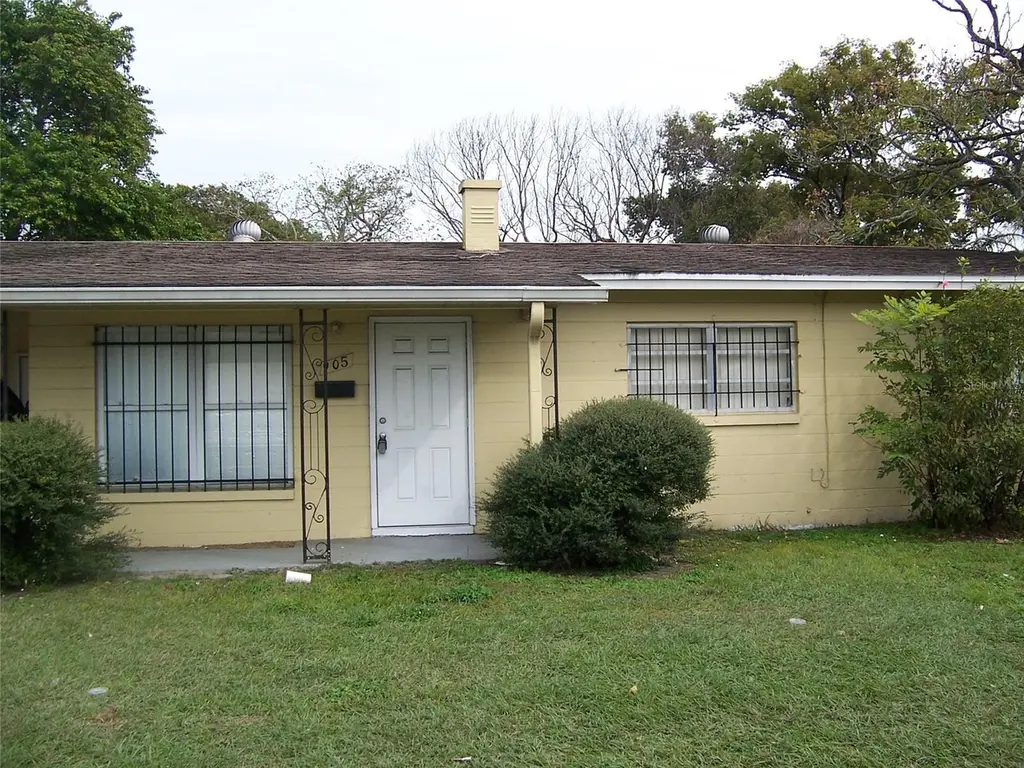
905 N Pine Hills Rd · Pine Hills, FL
Flood risk 1/10 · Minimal
- FEMA flood zone
- X (unshaded)
- Chance of flooding over 30 yrs
- 0.0%
- Est. flood insurance / yr
- $507 – $1,088
Fire risk 1/10 · Minimal
- Est. fire insurance / yr
- $947 – $1,759
Heat risk 9/10 · Severe
- Hot days now (above 108°F)
- 7 days/yr
- Hot days in 30 yrs
- 23 days/yr
Wind risk 9/10 · Severe
- Chance of severe wind over 30 yrs
- 99.0%
Air-quality risk 2/10 · Minimal
- Unhealthy air days now
- 0 days/yr
- Unhealthy air days in 30 yrs
- 1 days/yr
Risk factors via First Street. Map © Google.
Why this score? — see what drove the F grade
The composite is a weighted blend of 9 inputs, each scored 0–100. Each bar is that input's sub-score; the figure is the points it added to the 100-point composite (weight × sub-score).
- Cash flow +13.5/30.0
- DSCR +4.1/10.0
- Schools +4.1/10.0
- Livability +3.7/5.0
- 1% rule +3.6/10.0
- Condition / age +2.5/5.0
- Rent growth +2.4/5.0
- ARV discount +0.7/15.0
- Appreciation +0.0/10.0
$240,000
🖨 Deal sheet 📄 Offer letter ✓ Due diligence
Listing remarks
This unusual 3 bedroom, 1.5 bath home is offered for sale or lease and is ideally located near Colonial Dr and N. Pine Hills Rd. Zoned as PO/ Professional Office, this would be ideal as a family home or as a business office. A huge back yard with vehicle gates and fencing provides for ample parking of fleet or family vehicles. As an investment property, this home could be used as a single family home for leasing. No HOA or restrictions on pets or leasing. New carpet, new paint inside and out.
Key facts
- New carpet
- Ample parking
- Vehicle gates
Tags
Neighborhood map
What this means for you Summary
Snapshot
- This is a 3-bed/2.0-bath single-family listed at $240k.
Deal economics
- At list price, monthly cash flow is $9 ($106/yr) — positive.
- The deal already cash-flows at list — no discount required.
- To meet the 1% rule (rent ≥ 1% of price), the offer needs to be $207k (13.6% below list).
- Recommended offer: $207k (13.6% below list) — sets the bar for 1% rule.
- Cap rate 6.3% vs local median 4.9% in Pine Hills — top-decile yield for the area; either an underpriced asset or a hidden risk that comps aren't pricing in. Stress-test before assuming the spread holds.
Location & tenants
- Location reads 73/100 on livability (#317 in FL) — a middle-class / working-renter tenant base. Strengths: commute A+, cost of living A+, housing A+; Watch: crime D+, employment D, amenities F.
- Orange (suburban): math 46% / reading 51% proficiency, ranked #43 of 73 in FL (top 59%) — families likely to look elsewhere, expect single-tenant / working-renter base with shorter leases.
- Zoned schools: Mollie Ray Elementary (math 37% / reading 17%, grade F, #1,969 of 2,144 statewide, top 94%, 429 students, 82% FRL); Maynard Evans High (math 12% / reading 27%, grade F, #562 of 667 statewide, top 85%, 2,417 students, 69% FRL) — zoned schools average 75% FRL vs 56% district-wide (19 pts higher); higher-poverty schools than district average — tighter screening recommended.
- Zoned-school proficiency averages 23% at this address vs 48% district-wide (-25 pts) — the specific schools serving this property underperform the Orange average; the district grade overstates school quality for this exact location.
- Market conditions: Rents soft (-0.3%/yr); 246 active listings in the ZIP; 28 comparable units currently listed for rent nearby; rentals at typical pace (median 22d on market — plan ~3-4 weeks tenant-placement turnaround); 8,053 units permitted in Orange County in 2024 (3,133 in 5+ unit buildings).
- At $2,075/mo this rent would consume 50% of the median local household income ($50k/yr) (locally 4039% of renters already pay >50% of income on rent) — very limited rent-growth headroom before tenants either downsize or default.
Forward outlook
- Local home prices are declining (-3.0%/yr); year-one equity from $2k of loan paydown is wiped out by about $7k of value loss. Plan a longer hold.
- Orange County population projected at +52% by 2050 — long-run rental-demand tailwind backs the buy-and-hold thesis.
Negotiation context
- Only 14 days on market — expect competitive offers; lowballing is unlikely to land.
- Current owner paid $48k; list at $240k implies a 395% gain — meaningful room to come down on a strong offer.
Risks & watch-outs
- Watch-outs: built in 1958 — expect roof / HVAC / electrical / plumbing capex.
- Climate carrying-cost: severe wind risk, 99% chance of damaging wind over 30y; extreme-heat days projected 7→23/yr by 2055 (HVAC capex compounding) — expect insurance premiums to compound above CPI over the hold.
Questions for the listing agent
- Built in 1958 — when were the roof, HVAC, electrical panel, plumbing, and water heater last replaced?
- Is there a deadline driving the sale (1031 exchange, divorce, estate, relocation)? That informs how much negotiation room exists.
- Schools are B-rated — typically a magnet for longer-tenancy family renters. What's the average tenant stay here, and is there a school-zone premium baked into asking?
- Crime grade is D in this area — have there been break-ins, vandalism, or insurance claims at this property in the last 3 years? What carrier currently insures it and at what premium?
- The area grade is low — what's the realistic commute time and amenity access for the typical tenant pool here? Any planned neighborhood developments (good or bad) we should know about?
- What's the average days-on-market for RENTAL listings here right now (not sales)? A rising rental-DOM trend means longer vacancies and softer asking-rent achievability than the comps imply.
- What's the recent tenant-quality profile in this submarket — average credit score on applications, eviction rate, late-payment / NSF rate, and stable-employment percentage? A property-management company in the area should have these aggregated.
- How much new for-sale + rental construction is in the pipeline within 1–3 miles? Heavy new supply typically softens prices + rents 12–24 months out; constrained supply supports both.
Investment metrics
- 1% rule
- 0.86% ✗
- Cap rate
- 6.34%
- Cash-on-cash
- 0.16%
- DSCR
- 1.01
- GRM
- 9.6
CMA / ARV
- ARV (on-the-fly)
- $208,332
- Comps found
- 6
Show comp detail 6 sales within ~0.75 mi
| Address | Dist | Beds/Ba | Sqft | Sold | Price | $/sf | Match |
|---|---|---|---|---|---|---|---|
| 928 Alecon Dr | 0.12mi | 4/3.0 (+1) | 1,430 (+11%) | 2mo | $231,580 | $162 | 65 |
| 907 W Sunniland Dr | 0.10mi | 4/2.0 (+1) | 1,412 (+10%) | 23mo | $299,000 | $212 | 55 |
| 1202 Elinore Dr | 0.47mi | 3/1.0 | 1,218 (-5%) | 24mo | $185,000 | $152 | 46 |
| 1607 Pontiac Ct | 0.30mi | 3/1.0 | 1,105 (-14%) | 16mo | $170,000 | $154 | 46 |
| 327 Dover St | 0.75mi | 3/1.5 | 1,260 (-2%) | 22mo | $152,000 | $121 | 42 |
| 1521 N Hastings St | 0.74mi | 3/1.0 | 1,101 (-14%) | 24mo | $190,000 | $173 | 18 |
Match score weights: distance 35% · size 25% · config 20% · recency 20%. Top-matched comps best support the ARV.
Projected returns pro-forma
-3.0% appreciation · 0.0% rent growth · sell at horizon
- IRR
- -19.4%
- Equity multiple
- 0.34×
- Total profit
- $-44,395
- Equity at exit
- $35,785
- IRR
- -19.9%
- Equity multiple
- 0.09×
- Total profit
- $-61,376
- Equity at exit
- $20,751
Cash invested: $67,200 (down + closing). Projections, not guarantees.
Landlord ↔ Tenant lean methodology
- Overall (STATE)
- 87 Strongly Landlord-Friendly
- State Florida
- 87 Strongly Landlord-Friendly · R+3
- County
- — inherits STATE
- City
- — inherits STATE
ZIP-level market 32808
- Home prices YoY
- -22.6%
- Rents YoY
- -0.3%
- Active inventory
- 246
- Price-to-rent
- 9.6×
Monthly cashflow live
- Estimated rent
- $2,075 high interval (Pro) →
- Mortgage (P&I)
- −$1,259
- Tax from tax record
- −$272 /mo · $3,259/yr
- Insurance
- −$100
- HOA
- −$0
- Vacancy / Maint / Mgmt
- −$436
- Net cashflow
- $9
Break-even live
UW: 25.0% down · 7.5% · 30yr · 1.5% tax · 5.0% vac · 8.0% maint · 8.0% mgmt
Financing live
Cash to close
- Down payment
- $60,000
- Closing costs
- $7,200
- Reserves months
- —
- Total cash needed
- —
Loan-product check · same deal, 3 products live
Conventional
25% down · 7.5% · 30yr
- Down + closing
- —
- Monthly P&I
- —
- Monthly cashflow
- —
- DSCR
- —
- Eligible?
- —
Personal DTI + credit; lowest rate.
DSCR
20% down · 8.5% · 30yr
- Down + closing
- —
- Monthly P&I
- —
- Monthly cashflow
- —
- DSCR
- —
- Eligible?
- —
No personal income docs; deal must DSCR.
Hard money
10% down · 12.0% · 12mo
- Down + closing
- —
- Monthly P&I
- —
- Monthly cashflow
- —
- DSCR
- —
- Eligible?
- —
Short-term bridge; refi at stabilization.
Rent comps 28 comps
| Address | Beds | Baths | Sqft | Rent | $/sqft | DOM | Units | Dist |
|---|---|---|---|---|---|---|---|---|
| 5009 Deauville Dr Orlando, FL | 4.0 | 3.0 | 1224 | $2,000 | $1.63 | 23d | 1 | 0.10mi |
| 686 Walkup Dr Orlando, FL | 4.0 | 2.0 | 1400 | $2,050 | $1.46 | 23d | 1 | 0.42mi |
| 1213 Roger Babson Rd Unit 1 Orlando, FL | 4.0 | 2.0 | 1380 | $2,499 | $1.81 | 7d | 1 | 0.46mi |
| 1020 barnett villas Dr Orlando, FL | 1.0–3.0 | 1.0–2.0 | 934 | $1,930 | $2.07 | 23d | 1 | 0.46mi |
| 1214 N Pine Hills Rd Unit 1 Orlando, FL | 4.0 | 2.0 | 1069 | $3,900 | $3.65 | 20d | 1 | 0.53mi |
| 1407 Sunridge Rd Orlando, FL | 3.0 | 2.0 | 1124 | $1,945 | $1.73 | 7d | 1 | 0.59mi |
| 5103 Cochita Dr Orlando, FL | 4.0 | 2.0 | 1168 | $1,995 | $1.71 | 23d | 1 | 0.74mi |
| 1216 Lawne Blvd Orlando, FL | 3.0 | 2.0 | 1000 | $1,800 | $1.80 | 23d | 1 | 0.75mi |
| 4901 Hernandes Dr Orlando, FL | 4.0 | 2.0 | 1124 | $1,830 | $1.63 | 23d | 1 | 0.76mi |
| 812 N Hudson St Pine Hills, FL | 2.0 | 2.0 | 950 | $1,600 | $1.68 | 23d | 1 | 0.87mi |
| 6033 Balboa Dr Orlando, FL | 3.0 | 2.0 | 1269 | $2,300 | $1.81 | 21d | 1 | 0.99mi |
| 1209 Carlsbad Pl Orlando, FL | 4.0 | 1.0 | 1500 | $1,800 | $1.20 | 23d | 1 | 1.02mi |
| 1303 Charles St Orlando, FL | 3.0 | 2.0 | 1780 | $2,200 | $1.24 | 21d | 1 | 1.12mi |
| 1529 Ridge Pointe Dr Orlando, FL | 3.0 | 2.0 | 1108 | $1,995 | $1.80 | 7d | 1 | 1.20mi |
| 1537 Ridge Pointe Dr Orlando, FL | 3.0 | 2.0 | 1108 | $2,200 | $1.99 | 23d | 1 | 1.22mi |
| 2203 Silver Pines Pl #601 Orlando, FL | 2.0 | 1.0 | 962 | $1,500 | $1.56 | 23d | 1 | 1.24mi |
| 4566 Chateau Rd Orlando, FL | 3.0 | 1.5 | 1377 | $1,800 | $1.31 | 23d | 1 | 1.24mi |
| 137 N Nowell St Orlando, FL | 3.0 | 1.5 | 1167 | $2,300 | $1.97 | 17d | 1 | 1.28mi |
| 2222 Silver Pines Pl #902 Orlando, FL | 3.0 | 2.5 | 1472 | $1,500 | $1.02 | 7d | 1 | 1.28mi |
| 6119 Melbourne Ave Orlando, FL | 3.0 | 2.0 | 1109 | $1,999 | $1.80 | 20d | 1 | 1.30mi |
| 1737 Hinckley Rd Orlando, FL | 4.0 | 2.0 | 1661 | $2,481 | $1.49 | 1d | 1 | 1.30mi |
| 6215 Melbourne Ave Orlando, FL | 3.0 | 2.0 | 1250 | $850 | $0.68 | 17d | 1 | 1.35mi |
| 5402 Pine Chase Dr Orlando, FL | 2.0–3.0 | 2.0 | 1133 | $1,695 | $1.50 | 1d | 4 | 1.35mi |
| 4333 Cynthia St Orlando, FL | 3.0 | 2.0 | 1039 | $1,813 | $1.74 | 21d | 1 | 1.35mi |
| 200 Fanfair Ave Orlando, FL | 3.0 | 1.0 | 941 | $1,730 | $1.84 | 7d | 1 | 1.36mi |
| 4995 Mercer St Orlando, FL | 3.0 | 2.0 | 1386 | $2,500 | $1.80 | 2d | 1 | 1.37mi |
| 4431 Barley St Orlando, FL | 4.0 | 1.0 | 1026 | $864 | $0.84 | 23d | 1 | 1.37mi |
| 3750 W D Judge Dr Orlando, FL | 1.0–2.0 | 1.0–2.0 | 805 | $1,612 | $2.00 | 7d | 1 | 1.42mi |
Listing history 6 events
-
2026-04-28status Pending
-
2026-04-14$240,000 Active
-
1981-11-01soldstatus $48,500
-
1978-12-01soldstatus $30,000
-
1975-06-01soldstatus $19,400
-
1972-06-01soldstatus $20,200
ⓘ Source: listings_history table (triggers on properties + properties_extension) + one-shot
backfill from property_details.listing_events for pre-trigger history.
Tax reassessment forecast FL · Resets to sale price
- Current annual tax
- $3,259 · $272/mo
- Projected year-2 tax
- $3,259 · $272/mo
- Expected delta
- $0/yr ($0/mo · 0.0%)
ⓘ Screening estimate from a state-policy table — verify with the county assessor before closing.
Climate risk First Street
- Flood 1/10 Low FEMA zone X (unshaded) · 0% chance over 30 yrs
- Wildfire 1/10 Low
- Heat 9/10 Extreme 7 d/yr ≥108°F today · 23 d/yr by 30 yrs out
- Wind 9/10 Extreme 99% chance of damaging wind over 30 yrs
- Air quality 2/10 Low 0 unhealthy d/yr today · 1 by 30 yrs out
Nearby sold comps map
Loading sold comps map…
Walkable amenities ~0.75 mi
Loading nearby amenities…
Taxation est. · year 1
- Rental income
- $24,895
- − Mortgage interest
- −$13,444
- − Property taxes
- −$3,259
- − Insurance
- −$1,200
- − Repairs & maintenance
- −$1,992
- − Management
- −$1,992
- − Depreciation
- −$6,982
- Taxable loss
- −$3,972
- Est. tax savings @ 24.0%
- +$953
- After-tax cash flow
- $1,059/yr
For passive investors: Depreciation is non-cash, so a rental often shows a tax loss while cash-flowing — sheltering income. Rental losses are passive: they offset passive income freely, and up to $25,000/yr can offset ordinary (W-2) income if you actively participate and your MAGI is under $100k (phasing out to $0 by $150k); unused losses carry forward. On sale, claimed depreciation is recaptured at up to 25%, and gains may owe capital-gains tax (a 1031 exchange can defer both). Figures are a year-1 estimate at your 24.0% rate — not tax advice; consult a CPA.
Schools (NCES district)
- District
- Orange
- NCES district ID
- 1201440
- Math proficiency
- 46% ▼ -9.00%
- Reading proficiency
- 51% ▼ -2.00%
- Median HH income
- $49,350
- Composite
- 41.47/100
- National rank
- #3461
- State rank
- #43 of 73 in FL
Livability — Pine Hills
- Score
- 73/100
- State rank
- #317
- US rank
- #5362
Category grades
Schools grade is shown separately in the Schools card above.
Census & demographics
- Census place
- Pine Hills, FL
- County
- Orange County · 1,471,359 people
- City population
- 60,203
- Metro
- Orlando-Kissimmee-Sanford, FL
- Population (ZIP)
- 60,203
- Household income
- $49,700
- Rent vs Own
- Severe rent burden
- 4039.0
Population outlook (Orange County) Hauer SSP2
- Today (2025)
- 1,618,226 people
- By 2030
- 1,787,404 · +10.5%
- By 2040
- 2,125,621 · +31.4%
- By 2050
- 2,454,016 · +51.6%
- By 2075
- 3,173,711 · +96.1%
- By 2100
- 3,607,781 · +122.9%
Race, ethnicity, and origin ACS 2023
- Neighborhood character
- Predominantly Black (71%)
- Race & ethnicity
- Black 71% Hispanic / Latino 13% White 10% Two or more races 7% Asian 1%
- Hispanic origin (detail)
- Mexican 2% Puerto Rican 5% Dominican 2%
- Common ancestry
- Hispanic 20% Lithuanian 1% Scandinavian 0%
- Foreign-born
- 25% · Canada, Vietnam, Jamaica
- Languages at home
- 69% English-only · French/Haitian/Cajun 18% Spanish 11% Other Indo-European 1%
Political lean MEDSL · Orange
- 2024 margin
- D (+13.6) · D 56.1% · R 42.5% · Other 1.3%
- 2008→2024 swing
- -5.0pp toward R · 2008: 18.6pp · 2024: 13.6pp
- All cycles
- 2024: D+13.6 2020: D+23.1 2016: D+24.6 2012: D+18.2 2008: D+18.6
Not yet ingested
- Civics
- —
Market trends
- HPI YoY
- ▼ -110.15%
- Current HPI
- 376.3801
- Rent YoY
- ▼ -0.27%
- Metro
- Orlando-Kissimmee-Sanford, FL
- State GDP YoY
- ▲ 3.28%
- F500 in state
- 36
Industry mix (Fortune 500 HQ in FL)
| Industry | F500 HQs | Revenue |
|---|---|---|
| Industrial Technology | 2 | $29B |
|
||
| Insurance | 2 | $17B |
|
||
| Retail | 1 | $60B |
|
||
| Technology Distribution | 1 | $58B |
|
||
| Homebuilding | 1 | $35B |
|
||
| Technology Manufacturing | 1 | $35B |
|
||
Price history
+1088.1% since first listed6 events — show timeline
- 2026-04-28 Pending — Stellar MLS as Distributed by MLS Grid
- 2026-04-14 Listed $240,000 Stellar MLS as Distributed by MLS Grid
- 1981-11-01 Sold (Public Records) $48,500 Public Records
- 1978-12-01 Sold (Public Records) $30,000 Public Records
- 1975-06-01 Sold (Public Records) $19,400 Public Records
- 1972-06-01 Sold (Public Records) $20,200 Public Records
Property tax history
+6.2%/yrLatest (2025): $3,259 · +9.4% YoY. Source: county tax records.
Cash-flow waterfall
monthlySold comps — $/sqft
last 12 mo · ≤1 miLoading sold comps…