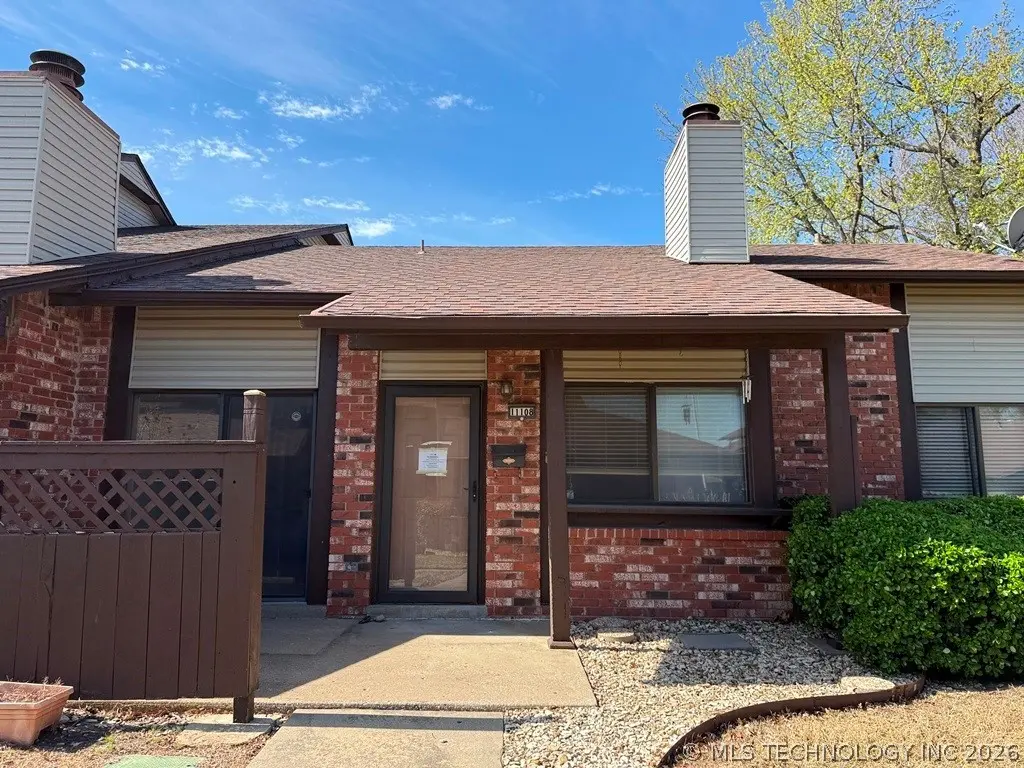
11108 E 13th St Unit 29-4A · Tulsa, OK
Flood risk 1/10 · Minimal
- FEMA flood zone
- X (unshaded)
- Chance of flooding over 30 yrs
- 0.0%
- Est. flood insurance / yr
- $473 – $860
Fire risk 2/10 · Minimal
- Est. fire insurance / yr
- $2,463 – $4,575
Heat risk 7/10 · Major
- Hot days now (above 110°F)
- 7 days/yr
- Hot days in 30 yrs
- 18 days/yr
Wind risk 2/10 · Minimal
- Chance of severe wind over 30 yrs
- 4.0%
Air-quality risk 2/10 · Minimal
- Unhealthy air days now
- 1 days/yr
- Unhealthy air days in 30 yrs
- 1 days/yr
Risk factors via First Street. Map © Google.
Why this score? — see what drove the D- grade
The composite is a weighted blend of 9 inputs, each scored 0–100. Each bar is that input's sub-score; the figure is the points it added to the 100-point composite (weight × sub-score).
- Cash flow +10.1/30.0
- 1% rule +9.5/10.0
- ARV discount +7.5/15.0
- Livability +3.8/5.0
- DSCR +2.9/10.0
- Rent growth +2.5/5.0
- Condition / age +2.2/5.0
- Schools +0.8/10.0
- Appreciation +0.0/10.0
$76,500
🖨 Deal sheet 📄 Offer letter ✓ Due diligence
Listing remarks
Corner lot condo unit on OAKBROOK VILLAGE. Living room with fireplace and large kitchen with all electric appliances. Stainless Steel. 2 spacious bedrooms. Rear entry 2 car garage parking. Conveniently located near major highways, schools, grocery stores, and others. Make it your own! Sold As-Is. This property may qualify for Seller Financing (Vendee). If property was built prior to 1978, Lead Based Paint Potentially Exists.
Key facts
- $394 HOA
- 2 garage spots
- Community pool
Property features AI
Finance
- Other: Insulation listed as a green/energy-efficient feature
- Financial info: Pets allowed
- HOA & community: Homeowners association with monthly fee; HOA amenities include clubhouse, park, pool, and gated/guard; Community features include gutters and sidewalks
Exterior
- Parking: Attached garage; Garage faces rear; Asphalt driveway; 2-car garage
- Security: Smoke detector(s); No safety shelter
- Utilities: Public water; Public sewer; Electricity available; Cable available; Phone available
- Home design: Single-story home; Faces east; Entry on first level
- Construction: Brick, vinyl siding, and wood frame construction; Asphalt/fiberglass roof; Slab foundation; Year built per public records
- Exterior features: Landscaping; Rain gutters; Covered, enclosed porch/patio
Interior
- Kitchen: Dishwasher; Electric oven; Range / Stove; Oven; Refrigerator; Disposal; Plumbed for ice maker
- Bedrooms: Master bedroom with separate closets (first level); Additional bedroom (first level)
- Flooring: Carpet; Tile
- Bathrooms: One full bathroom (hall/full) (first level)
- Heating & cooling: Central heating (electric); Central air conditioning
- Interior features: High ceilings; Vaulted ceilings; Ceiling fan(s); Laminate counters; Cable TV; Aluminum frame windows; Electric oven and range connections
- Laundry & utility: Washer hookup; Electric water heater; Utility room (first level)
Neighborhood map
What this means for you Summary
Snapshot
- This is a 2-bed/1.0-bath condo listed at $76k. Condition is rated fair.
Deal economics
- At list price, monthly cash flow is $-45 ($-542/yr) — negative.
- To cash-flow at today's rent, offer at most $70k (8.5% below list).
- Meets the 1% rule at list price ($1k rent vs $76k).
- Recommended offer: $70k (8.5% below list) — sets the bar for cash-flow.
- Cap rate 5.6% vs local median 3.9% in Tulsa — top-decile yield for the area; either an underpriced asset or a hidden risk that comps aren't pricing in. Stress-test before assuming the spread holds.
Location & tenants
- Location reads 75/100 on livability (#13 in OK, #4,058 nationally) — a middle-class / working-renter tenant base. Strengths: amenities A+, commute A+, cost of living A+; Watch: schools F, crime F, employment D-.
- Tulsa (urban): math 7% / reading 12% proficiency, ranked #250 of 270 in OK (top 93%) — low school quality limits family demand, transient renter base, plan for 1-2y turnover; 76% free/reduced lunch — lower-income household profile, screen leases tightly.
- Market conditions: 38 active listings in the ZIP; 22 comparable units currently listed for rent nearby; rentals at typical pace (median 16d on market — plan ~3-4 weeks tenant-placement turnaround); 2,818 units permitted in Tulsa County in 2024 (518 in 5+ unit buildings).
Forward outlook
- Local home prices are declining (-3.0%/yr); year-one equity from $529 of loan paydown is wiped out by about $2k of value loss. Plan a longer hold.
- Tulsa County population projected at +30% by 2050 — long-run rental-demand tailwind backs the buy-and-hold thesis.
Negotiation context
- It's been on market 33 days — a 3% lower offer ($74k) is reasonable based on typical stale-listing flexibility.
Risks & watch-outs
- Watch-outs: HOA is 35% of rent.
- Climate carrying-cost: extreme-heat days projected 7→18/yr by 2055 (HVAC capex compounding) — expect insurance premiums to compound above CPI over the hold.
Questions for the listing agent
- What do current leases actually rent for vs. the listed asking? Can we see a recent rent roll and the last 12 months of T-12 income?
- It's been on market 33 days. Have you received any prior offers? Is the seller open to a 9% concession, seller financing, or rate buy-down credit?
- Have any recent inspections been done? Can we get a copy of the seller's disclosures and any deferred-maintenance estimates?
- What does the HOA fee cover, when was the last increase, and are there any pending special assessments or reserve-fund shortfalls?
- Any open or pending special assessments — roof, HVAC, plumbing, elevator, façade? What's the per-unit balance and payoff schedule, and is the seller paying it off at close or rolling it to the buyer?
- Is there a deadline driving the sale (1031 exchange, divorce, estate, relocation)? That informs how much negotiation room exists.
- Schools are F-rated, which usually means shorter tenancies and higher turnover. Who's the typical renter profile here, and what's been the actual vacancy rate?
- Crime grade is F in this area — have there been break-ins, vandalism, or insurance claims at this property in the last 3 years? What carrier currently insures it and at what premium?
- The area grade is low — what's the realistic commute time and amenity access for the typical tenant pool here? Any planned neighborhood developments (good or bad) we should know about?
- What's the average days-on-market for RENTAL listings here right now (not sales)? A rising rental-DOM trend means longer vacancies and softer asking-rent achievability than the comps imply.
- What's the recent tenant-quality profile in this submarket — average credit score on applications, eviction rate, late-payment / NSF rate, and stable-employment percentage? A property-management company in the area should have these aggregated.
- How much new apartment / multifamily construction is in the pipeline within 1–3 miles? Heavy new supply (>2% of stock underway) typically softens rents 12–24 months out; light construction supports rent growth.
Investment metrics
- 1% rule
- 1.45% ✓
- Cap rate
- 5.58%
- Cash-on-cash
- -2.53%
- DSCR
- 0.89
- GRM
- 5.7
CMA / ARV
No comps found within radius.
Projected returns pro-forma
-3.0% appreciation · 3.0% rent growth · sell at horizon
- IRR
- -20.0%
- Equity multiple
- 0.30×
- Total profit
- $-15,016
- Equity at exit
- $11,406
- IRR
- -12.2%
- Equity multiple
- 0.27×
- Total profit
- $-15,731
- Equity at exit
- $6,614
Cash invested: $21,420 (down + closing). Projections, not guarantees.
Landlord ↔ Tenant lean methodology
- Overall (STATE)
- 83 Strongly Landlord-Friendly
- State Oklahoma
- 83 Strongly Landlord-Friendly · R+20
- County
- — inherits STATE
- City
- — inherits STATE
ZIP-level market 74128
- Home prices YoY
- -21.6%
- Active inventory
- 38
- Price-to-rent
- 5.7×
Monthly cashflow live
- Estimated rent
- $1,111 high interval (Pro) →
- Mortgage (P&I)
- −$401
- Tax est. 1.5%
- −$96 /mo · $1,148/yr
- Insurance
- −$32
- HOA
- −$394
- Vacancy / Maint / Mgmt
- −$233
- Net cashflow
- $-45
Break-even live
UW: 25.0% down · 7.5% · 30yr · 1.5% tax · 5.0% vac · 8.0% maint · 8.0% mgmt
Financing live
Cash to close
- Down payment
- $19,125
- Closing costs
- $2,295
- Reserves months
- —
- Total cash needed
- —
Loan-product check · same deal, 3 products live
Conventional
25% down · 7.5% · 30yr
- Down + closing
- —
- Monthly P&I
- —
- Monthly cashflow
- —
- DSCR
- —
- Eligible?
- —
Personal DTI + credit; lowest rate.
DSCR
20% down · 8.5% · 30yr
- Down + closing
- —
- Monthly P&I
- —
- Monthly cashflow
- —
- DSCR
- —
- Eligible?
- —
No personal income docs; deal must DSCR.
Hard money
10% down · 12.0% · 12mo
- Down + closing
- —
- Monthly P&I
- —
- Monthly cashflow
- —
- DSCR
- —
- Eligible?
- —
Short-term bridge; refi at stabilization.
Rent comps 22 comps
| Address | Beds | Baths | Sqft | Rent | $/sqft | DOM | Units | Dist |
|---|---|---|---|---|---|---|---|---|
| 1018 S 107th East Ave Tulsa, OK | 1.0–2.0 | 1.0 | 807 | $925 | $1.15 | 23d | 6 | 0.24mi |
| 1433 S 107th East Ave Tulsa, OK | 1.0–3.0 | 1.0–1.5 | 840 | $999 | $1.19 | 19d | 3 | 0.35mi |
| 1448 S 108th East Pl Tulsa, OK | 2.0 | 1.0 | 982 | $1,350 | $1.37 | 16d | 1 | 0.52mi |
| 717 S 101st East Ave Tulsa, OK | 1.0–2.0 | 1.0 | 786 | $1,049 | $1.33 | 2d | 11 | 0.58mi |
| 9743 E 12th St Tulsa, OK | 1.0–2.0 | 1.0–1.5 | 875 | $975 | $1.11 | 16d | 3 | 0.71mi |
| 1645 S 101st East Ave Tulsa, OK | 1.0–3.0 | 1.0–2.0 | 1013 | $1,624 | $1.60 | 2d | 35 | 0.80mi |
| 1129 S 124th East Ave Tulsa, OK | 2.0 | 1.0 | 1100 | $1,100 | $1.00 | 16d | 1 | 0.92mi |
| 912 S 95th East Ave Tulsa, OK | 1.0 | 1.0 | 650 | $765 | $1.18 | 3d | 2 | 0.98mi |
| 444 S Mingo Rd Tulsa, OK | 3.0 | 1.0 | 800 | $1,045 | $1.31 | 16d | 5 | 1.06mi |
| 2140 S 109th East Ave Unit 2142C Tulsa, OK | 2.0 | 1.5 | 1000 | $895 | $0.90 | 23d | 1 | 1.11mi |
| 2140 S 109th East Ave Unit 2158A Tulsa, OK | 1.0 | 1.0 | 864 | $600 | $0.69 | 23d | 1 | 1.11mi |
| 11107 E Brady St Unit 458 Tulsa, OK | 2.0 | 1.0 | 964 | $1,155 | $1.20 | 11d | 1 | 1.15mi |
| 11107 E Brady St Unit 132 Tulsa, OK | 2.0 | 1.0 | 964 | $995 | $1.03 | 23d | 1 | 1.15mi |
| 11107 E Brady St Unit 211 Tulsa, OK | 2.0 | 1.0 | 964 | $1,155 | $1.20 | 23d | 1 | 1.15mi |
| 11107 E Brady St Unit 338 Tulsa, OK | 2.0 | 1.0 | 964 | $1,095 | $1.14 | 3d | 1 | 1.15mi |
| 10951 E 23rd St Unit 10967 Tulsa, OK | 2.0 | 1.5 | 800 | $1,149 | $1.44 | 3d | 1 | 1.22mi |
| 10951 E 23rd St Unit 10959 Tulsa, OK | 2.0 | 1.5 | 767 | $1,149 | $1.50 | 23d | 1 | 1.22mi |
| 10951 E 23rd St Unit 10967 D Tulsa, OK | 1.0 | 1.5 | 767 | $1,075 | $1.40 | 23d | 1 | 1.22mi |
| 10124 E 22nd St Tulsa, OK | 3.0 | 2.0 | 1117 | $1,350 | $1.21 | 14d | 1 | 1.28mi |
| 1801 S 132nd East Pl Tulsa, OK | 2.0–3.0 | 1.0–2.0 | 950 | $1,184 | $1.25 | 1d | 4 | 1.40mi |
| 1801 S 132nd East Pl Tulsa, OK | 2.0–3.0 | 1.5–2.0 | 975 | $1,199 | $1.23 | 21d | 4 | 1.40mi |
| 2319 S 119th East Ave Tulsa, OK | 3.0 | 1.0 | 990 | $1,365 | $1.38 | 23d | 1 | 1.43mi |
HOA detail condo
- Monthly dues
- $394 · $4,728/yr
- Likely covers
- electric
- Assessments
- None detected in remarks — confirm with the listing agent.
Listing history 4 events
-
2026-06-02statusdays on market $76,500 Pending 33 DOM
-
2026-06-01days on market $76,500 Active 32 DOM
-
2026-05-31days on market $76,500 Active 31 DOM
-
2026-04-28$76,500 Active
ⓘ Source: listings_history table (triggers on properties + properties_extension) + one-shot
backfill from property_details.listing_events for pre-trigger history.
Climate risk First Street
- Flood 1/10 Low FEMA zone X (unshaded) · 0% chance over 30 yrs
- Wildfire 2/10 Low
- Heat 7/10 Severe 7 d/yr ≥110°F today · 18 d/yr by 30 yrs out
- Wind 2/10 Low 4% chance of damaging wind over 30 yrs
- Air quality 2/10 Low 1 unhealthy d/yr today · 1 by 30 yrs out
Nearby sold comps map
Loading sold comps map…
Walkable amenities ~0.75 mi
Loading nearby amenities…
Taxation est. · year 1
- Rental income
- $13,329
- − Mortgage interest
- −$4,285
- − Property taxes
- −$1,148
- − Insurance
- −$382
- − Repairs & maintenance
- −$1,066
- − Management
- −$1,066
- − HOA
- −$4,728
- − Depreciation
- −$2,225
- Taxable loss
- −$1,572
- Est. tax savings @ 24.0%
- +$377
- After-tax cash flow
- $-165/yr
For passive investors: Depreciation is non-cash, so a rental often shows a tax loss while cash-flowing — sheltering income. Rental losses are passive: they offset passive income freely, and up to $25,000/yr can offset ordinary (W-2) income if you actively participate and your MAGI is under $100k (phasing out to $0 by $150k); unused losses carry forward. On sale, claimed depreciation is recaptured at up to 25%, and gains may owe capital-gains tax (a 1031 exchange can defer both). Figures are a year-1 estimate at your 24.0% rate — not tax advice; consult a CPA.
Condition & rehab AI · 12 photos
This townhouse requires moderate repairs and maintenance, with a focus on exterior and interior painting to improve its curb appeal and resale value.
Repairs flagged
- Major Brick siding — Weathered and in need of repainting
- Minor Carpeted floors — Worn but could be cleaned
Value-add opportunities
- Both Paint interior walls — Enhances curb appeal and interior aesthetics
- Both Replace carpet with hardwood or tile — Improves durability and resale value
- Both Paint exterior brick — Enhances curb appeal and protects brick
Renovation cost estimate screening
| Repair item | Severity | Est. cost |
|---|---|---|
| Brick siding · Weathered and in need of repainting | Major | $15,000–50,000 |
| Carpeted floors · Worn but could be cleaned | Minor | $500–3,000 |
| Total estimated repair cost · 2 items | $15,500–53,000 |
Value-add ROI direction
- Both Paint interior walls — Enhances curb appeal and interior aesthetics ↑
- Both Replace carpet with hardwood or tile — Improves durability and resale value ↑
- Both Paint exterior brick — Enhances curb appeal and protects brick ↑
ⓘ Cost ranges are severity-bucket heuristics (US national rule-of-thumb). Get contractor quotes + a written scope before underwriting a rehab budget.
Schools (NCES district)
- District
- Tulsa
- NCES district ID
- 4030240
- Math proficiency
- 7% ▼ -9.00%
- Reading proficiency
- 12% ▼ -7.00%
- Median HH income
- $37,895
- Composite
- 8.04/100
- National rank
- #9919
- State rank
- #250 of 270 in OK
Livability — Tulsa
- Score
- 75/100
- State rank
- #13
- US rank
- #4058
Category grades
Schools grade is shown separately in the Schools card above.
Census & demographics
- Census place
- Tulsa, OK
- County
- Tulsa County · 640,811 people
- City population
- 389,418
- Metro
- Tulsa, OK
- Population (ZIP)
- 13,751
- Household income
- $52,195
- Rent vs Own
- Severe rent burden
- 382.0
Population outlook (Tulsa County) Hauer SSP2
- Today (2025)
- 723,846 people
- By 2030
- 766,033 · +5.8%
- By 2040
- 851,386 · +17.6%
- By 2050
- 938,389 · +29.6%
- By 2075
- 1,166,011 · +61.1%
- By 2100
- 1,350,277 · +86.5%
Race, ethnicity, and origin ACS 2023
- Neighborhood character
- Diverse neighborhood (Simpson 0.69)
- Race & ethnicity
- Hispanic / Latino 39% White 38% Two or more races 23% Black 10% Asian 4% Native American 4%
- Hispanic origin (detail)
- Mexican 32%
- Common ancestry
- Italian 1% Slovak 1% Romanian 1%
- Foreign-born
- 19% · Canada
- Languages at home
- 59% English-only · Spanish 36% Other Asian/Pacific 2% Other Indo-European 1%
Political lean MEDSL · Tulsa
- 2024 margin
- R (+15.2) · D 41.3% · R 56.5% · Other 2.2%
- 2008→2024 swing
- +9.2pp toward D · 2008: -24.5pp · 2024: -15.2pp
- All cycles
- 2024: R+15.2 2020: R+15.6 2016: R+22.9 2012: R+27.4 2008: R+24.5
Not yet ingested
- Civics
- —
Market trends
- HPI YoY
- ▼ -66.16%
- Current HPI
- 240.6763
- Rent YoY
- —
- Metro
- Tulsa, OK
- State GDP YoY
- ▲ 1.55%
- F500 in state
- 6
Industry mix (Fortune 500 HQ in OK)
| Industry | F500 HQs | Revenue |
|---|---|---|
| Energy | 3 | $48B |
|
||
Price history
1 event — show timeline
- 2026-04-28 Listed $76,500 MLS Technology, Inc.
Cash-flow waterfall
monthlySold comps — $/sqft
last 12 mo · ≤1 miLoading sold comps…