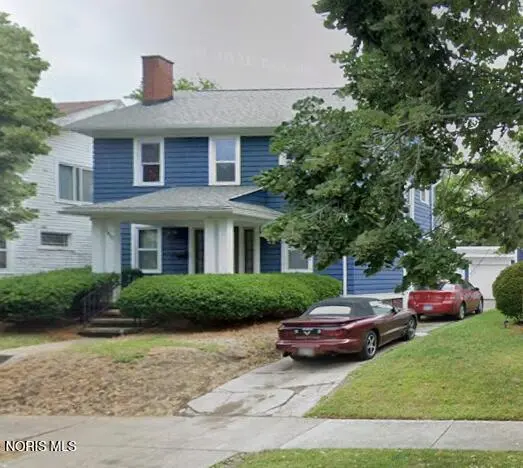
1412 Waverly Ave · Toledo, OH
Flood risk 1/10 · Minimal
- FEMA flood zone
- X (unshaded)
- Chance of flooding over 30 yrs
- 0.0%
- Est. flood insurance / yr
- $473 – $860
Fire risk 1/10 · Minimal
- Est. fire insurance / yr
- $713 – $1,323
Heat risk 3/10 · Minor
- Hot days now (above 101°F)
- 7 days/yr
- Hot days in 30 yrs
- 16 days/yr
Wind risk 2/10 · Minimal
- Chance of severe wind over 30 yrs
- —
Air-quality risk 2/10 · Minimal
- Unhealthy air days now
- 1 days/yr
- Unhealthy air days in 30 yrs
- 3 days/yr
Risk factors via First Street. Map © Google.
Why this score? — see what drove the C grade
The composite is a weighted blend of 9 inputs, each scored 0–100. Each bar is that input's sub-score; the figure is the points it added to the 100-point composite (weight × sub-score).
- Cash flow +26.8/30.0
- DSCR +9.2/10.0
- 1% rule +6.7/10.0
- Rent growth +4.5/5.0
- Livability +3.3/5.0
- Condition / age +2.5/5.0
- Schools +1.6/10.0
- ARV discount +0.6/15.0
- Appreciation +0.0/10.0
$99,900
🖨 Deal sheet 📄 Offer letter ✓ Due diligence
Listing remarks MLS
SPACIOUS 3 BED/1 BATH w/HARDWOOD FLOORING & LOADS OF WINDOWS. LARGE LIVING RM w/DECORATIVE FIREPLACE & WOOD MANTLE; GRACIOUS FORMAL DINING RM w/RECESSED AREA FOR BUFEET & FRENCH DOORS BETWEEN LIVING & DINING ROOM; KITCHEN w/BREAKFAST NOOK & ALL APPLIANCES. FINISHED REC ROOM w/DRYBAR & GLASS BLOCK WINDOWS. 2-CAR GARAGE w/NEWER GARAGE DOORS & CONCRETE DRIVEWAY. NEWER A/C; ROOF; & HW TANK. LARGE FRONT PORCH w/OVERHANG. POSSESSION AT CLOSING. SECURITY SYSTEM.
Key facts
- Breakfast nook
- Newer windows
- Walk-up attic
Tags
Property features AI
Exterior
- Parking: Detached garage; Driveway; On-street parking; Approximately 1–1.5 garage spaces (listed as 1.5)
- Security: Security system
- Utilities: Electricity connected; Public water; Public sewer
- Home design: Single-family house; Two levels
- Construction: Wood siding; Combination foundation; Asphalt roof
- Exterior features: Balcony; Front porch; Covered porch; Smart camera(s)/recording; Asphalt roof
Interior
- Kitchen: Gas range; Refrigerator; Eat-in kitchen layout
- Bedrooms: Bedroom (upper) about 12 x 12; Bedroom 2 (upper) about 13 x 8; Bedroom 3 (upper) about 12 x 11
- Flooring: Hardwood floors
- Bathrooms: 1 full bathroom
- Heating & cooling: Forced air heating; Central air conditioning
- Interior features: Eat-in kitchen; Insulated windows; Partial unfinished basement; Living room fireplace; 6 total rooms
- Laundry & utility: Washer; Dryer; Laundry located in basement
Neighborhood map
What this means for you Summary
Snapshot
- This is a 3-bed/1.0-bath single-family listed at $100k.
Deal economics
- At list price, monthly cash flow is $274 ($3k/yr) — positive.
- The deal already cash-flows at list — no discount required.
- Meets the 1% rule at list price ($1k rent vs $100k).
- Cap rate 9.6% vs local median 7.6% in Toledo — meaningfully above typical; check what's discounted (condition, days-on-market, listing class) to confirm the premium yield is real.
Location & tenants
- Location reads 66/100 on livability (#645 in OH) — a middle-class / working-renter tenant base. Strengths: cost of living A+, housing A+, health & safety A+; Watch: amenities C-, crime F, commute F.
- Toledo City (urban): math 15% / reading 24% proficiency, ranked #634 of 656 in OH (top 97%) — low school quality limits family demand, transient renter base, plan for 1-2y turnover; 72% free/reduced lunch — lower-income household profile, screen leases tightly.
- Zoned schools: Robinson Elementary School (math 2% / reading 2%, grade F, #1,580 of 1,584 statewide, top 100%, 358 students, 0% FRL); Start High School (math 11% / reading 33%, grade F, #672 of 781 statewide, top 86%, 1,242 students, 50% FRL) — zoned schools average 25% FRL vs 72% district-wide (47 pts lower); this property's tenant base skews higher-income than the district average.
- Market conditions: Rents rising fast (+8.2%/yr); 83 active listings in the ZIP; 24 comparable units currently listed for rent nearby; rentals lingering (median 44d on market — plan ~5-8 weeks vacancy on turnover, expect pricing pressure); 71% of comp listings sitting > 30 days — soft ceiling on asking rent; lower-income renter base — watch delinquency; 415 units permitted in Lucas County in 2024 (122 in 5+ unit buildings).
- This rent runs 34% of the median local income ($41k/yr) — at the standard rent-burdened threshold; future hikes will face affordability resistance.
Forward outlook
- Local home prices are declining (-3.0%/yr); year-one equity from $691 of loan paydown is wiped out by about $3k of value loss. Plan a longer hold.
- Lucas County population projected at -16% by 2050 — secular population decline; favor cash flow + early exit over multi-decade hold.
- At projected returns (-3.0% appreciation + 8.0% rent growth), your $28k cash investment doubles in ~7 years — after that, you're playing with house money.
Negotiation context
- Only 1 days on market — expect competitive offers; lowballing is unlikely to land.
- 3 sale attempts since 5y ago with the ask held roughly flat each time — persistent listings suggest the price (not the market) is what's stuck; bring a comps-based counter.
- Current owner paid $45k; list at $100k implies a 122% gain — meaningful room to come down on a strong offer.
Risks & watch-outs
- Watch-outs: built in 1922 — expect roof / HVAC / electrical / plumbing capex.
Questions for the listing agent
- Built in 1922 — when were the roof, HVAC, electrical panel, plumbing, and water heater last replaced?
- Is there a deadline driving the sale (1031 exchange, divorce, estate, relocation)? That informs how much negotiation room exists.
- Schools are D-rated, which usually means shorter tenancies and higher turnover. Who's the typical renter profile here, and what's been the actual vacancy rate?
- Crime grade is F in this area — have there been break-ins, vandalism, or insurance claims at this property in the last 3 years? What carrier currently insures it and at what premium?
- What's the average days-on-market for RENTAL listings here right now (not sales)? A rising rental-DOM trend means longer vacancies and softer asking-rent achievability than the comps imply.
- What's the recent tenant-quality profile in this submarket — average credit score on applications, eviction rate, late-payment / NSF rate, and stable-employment percentage? A property-management company in the area should have these aggregated.
- How much new for-sale + rental construction is in the pipeline within 1–3 miles? Heavy new supply typically softens prices + rents 12–24 months out; constrained supply supports both.
Investment metrics
- 1% rule
- 1.17% ✓
- Cap rate
- 9.58%
- Cash-on-cash
- 11.75%
- DSCR
- 1.52
- GRM
- 7.1
CMA / ARV
- ARV (median comp)
- $86,572
- List price
- $99,900
- Delta
- 15.39%
- Verdict
- OVERPRICED
- Comps
- 20 within 1.0 mi
Show comp detail 12 sales within ~0.75 mi
| Address | Dist | Beds/Ba | Sqft | Sold | Price | $/sf | Match |
|---|---|---|---|---|---|---|---|
| 2033 Crosswell Pl | 0.08mi | 3/1.0 | 1,328 (-6%) | 1mo | $101,500 | $76 | 85 |
| 1938 Fernwood Ave | 0.06mi | 3/1.0 | 1,502 (+6%) | 3mo | $95,900 | $64 | 84 |
| 1019 Woodstock Ave | 0.27mi | 3/1.0 | 1,272 (-10%) | 2mo | $21,100 | $17 | 69 |
| 1004 Waverly Ave | 0.26mi | 3/1.0 | 1,241 (-12%) | 2mo | $58,500 | $47 | 66 |
| 1675 Nebraska Ave | 0.66mi | 2/1.0 (-1) | 1,419 (+0%) | 1mo | $35,000 | $25 | 62 |
| 1652 Nebraska Ave | 0.66mi | 2/1.0 (-1) | 1,443 (+2%) | 2mo | $40,000 | $28 | 59 |
| 1901 Alvin St | 0.68mi | 3/1.0 | 1,344 (-5%) | 3mo | $105,000 | $78 | 58 |
| 1501 Fernwood Ave | 0.58mi | 3/1.0 | 1,259 (-11%) | 1mo | $60,000 | $48 | 54 |
| 630 Polonia Ct | 0.75mi | 3/1.5 | 1,510 (+7%) | 2mo | $140,000 | $93 | 50 |
| 742 Marmion Ave | 0.42mi | 3/1.5 | 1,202 (-15%) | 4mo | $95,000 | $79 | 50 |
| 1911 Alvin St | 0.69mi | 4/2.0 (+1) | 1,349 (-4%) | 4mo | $115,150 | $85 | 48 |
| 834 N Detroit Ave | 0.65mi | 4/1.0 (+1) | 1,552 (+10%) | 5mo | $35,000 | $23 | 44 |
Match score weights: distance 35% · size 25% · config 20% · recency 20%. Top-matched comps best support the ARV.
Projected returns pro-forma
-3.0% appreciation · 8.0% rent growth · sell at horizon
- IRR
- 6.5%
- Equity multiple
- 1.27×
- Total profit
- $7,447
- Equity at exit
- $14,895
- IRR
- 19.8%
- Equity multiple
- 3.04×
- Total profit
- $57,137
- Equity at exit
- $8,638
Cash invested: $27,972 (down + closing). Projections, not guarantees.
Landlord ↔ Tenant lean methodology
- Overall (STATE)
- 73 Landlord-Friendly
- State Ohio
- 73 Landlord-Friendly · R+6
- County
- — inherits STATE
- City
- — inherits STATE
ZIP-level market 43607
- Home prices YoY
- -27.5%
- Rents YoY
- 8.2%
- Active inventory
- 83
- Price-to-rent
- 7.1×
Monthly cashflow live
- Estimated rent
- $1,173 high interval (Pro) →
- Mortgage (P&I)
- −$524
- Tax from tax record
- −$87 /mo · $1,048/yr
- Insurance
- −$42
- HOA
- −$0
- Vacancy / Maint / Mgmt
- −$246
- Net cashflow
- $274
Break-even live
UW: 25.0% down · 7.5% · 30yr · 1.5% tax · 5.0% vac · 8.0% maint · 8.0% mgmt
Financing live
Cash to close
- Down payment
- $24,975
- Closing costs
- $2,997
- Reserves months
- —
- Total cash needed
- —
Loan-product check · same deal, 3 products live
Conventional
25% down · 7.5% · 30yr
- Down + closing
- —
- Monthly P&I
- —
- Monthly cashflow
- —
- DSCR
- —
- Eligible?
- —
Personal DTI + credit; lowest rate.
DSCR
20% down · 8.5% · 30yr
- Down + closing
- —
- Monthly P&I
- —
- Monthly cashflow
- —
- DSCR
- —
- Eligible?
- —
No personal income docs; deal must DSCR.
Hard money
10% down · 12.0% · 12mo
- Down + closing
- —
- Monthly P&I
- —
- Monthly cashflow
- —
- DSCR
- —
- Eligible?
- —
Short-term bridge; refi at stabilization.
Rent comps 24 comps
| Address | Beds | Baths | Sqft | Rent | $/sqft | DOM | Units | Dist |
|---|---|---|---|---|---|---|---|---|
| 1133 Parkside Blvd Toledo, OH | 2.0 | 1.0 | 960 | $850 | $0.89 | 43d | 1 | 0.28mi |
| 915 Woodstock Ave Toledo, OH | 3.0 | 1.5 | 1500 | $1,100 | $0.73 | 23d | 1 | 0.31mi |
| 2117 Clinton St Toledo, OH | 3.0 | 1.0 | 1256 | $1,115 | $0.89 | 43d | 1 | 0.66mi |
| 1785 Tecumseh St Toledo, OH | 2.0 | 1.0 | 930 | $900 | $0.97 | 43d | 1 | 0.70mi |
| 2037 Alvin St Toledo, OH | 3.0 | 1.0 | 1260 | $1,175 | $0.93 | 43d | 1 | 0.75mi |
| 2030 Wyndhurst Rd Toledo, OH | 2.0 | 1.0 | 1042 | $950 | $0.91 | 43d | 1 | 0.77mi |
| 319 N Detroit Ave Toledo, OH | 3.0 | 1.0 | 1341 | $845 | $0.63 | 43d | 1 | 0.80mi |
| 2637 Greenway St Toledo, OH | 2.0 | 1.0 | 1082 | $900 | $0.83 | 43d | 1 | 0.91mi |
| 2535 W Bancroft St Unit 8 Toledo, OH | 2.0 | 1.0 | 900 | $895 | $0.99 | 43d | 1 | 0.92mi |
| 2322 Upton Ave Toledo, OH | 3.0 | 1.0 | 1000 | $1,300 | $1.30 | 43d | 1 | 0.92mi |
| 1738 Milburn Ave Toledo, OH | 2.0 | 1.0 | 1016 | $650 | $0.64 | 23d | 1 | 0.94mi |
| 2356 Torrey Hill Dr Unit 11 Toledo, OH | 2.0 | 1.0 | 1050 | $800 | $0.76 | 43d | 1 | 0.98mi |
| 1919 Ottawa Dr Unit 7 Toledo, OH | 2.0 | 1.0 | 900 | $800 | $0.89 | 43d | 1 | 0.99mi |
| 1140 Palmwood Ave Toledo, OH | 3.0 | 1.0 | 1292 | $1,500 | $1.16 | 43d | 1 | 1.03mi |
| 1122 Pinewood Ave Toledo, OH | 3.0 | 1.0 | 1559 | $1,150 | $0.74 | 13d | 1 | 1.07mi |
| 932 Turner Ave Toledo, OH | 2.0 | 1.0 | 960 | $1,295 | $1.35 | 13d | 1 | 1.11mi |
| 1026 Oakwood Ave Toledo, OH | 2.0 | 1.0 | 1100 | $850 | $0.77 | 43d | 1 | 1.24mi |
| 2632 Algonquin Pkwy Toledo, OH | 3.0 | 1.5 | 1568 | $800 | $0.51 | 23d | 1 | 1.29mi |
| 3803 Monroe St Toledo, OH | 2.0 | 1.0 | 942 | $850 | $0.90 | 43d | 1 | 1.39mi |
| 2314 Airline Ave Toledo, OH | 3.0 | 1.0 | 1123 | $1,478 | $1.32 | 23d | 1 | 1.40mi |
| 307 Danberry St Toledo, OH | 2.0 | 1.0 | 988 | $950 | $0.96 | 43d | 1 | 1.41mi |
| 3835 Monroe St Toledo, OH | 2.0 | 1.0 | 1002 | $950 | $0.95 | 43d | 1 | 1.44mi |
| 1436 Palmetto Ave Toledo, OH | 3.0 | 1.0 | 1678 | $1,400 | $0.83 | 23d | 1 | 1.44mi |
| 2734 Powhattan Pkwy Toledo, OH | 2.0 | 1.0 | 1144 | $900 | $0.79 | 43d | 1 | 1.47mi |
Listing history 15 events
-
2026-06-17days on market $99,900 Active 1 DOM
-
2026-06-09days on market $99,900 Active 64 DOM
-
2026-06-08days on market $99,900 Active 63 DOM
-
2026-06-07days on market $99,900 Active 62 DOM
-
2026-06-05days on market $99,900 Active 59 DOM
-
2026-06-03days on market $99,900 Active 58 DOM
-
2026-06-02days on market $99,900 Active 57 DOM
-
2026-06-01days on market $99,900 Active 56 DOM
-
2026-05-31days on market $99,900 Active 55 DOM
-
2026-05-30days on market $99,900 Active 54 DOM
-
2026-04-06$99,900 Active 338-char remark
-
2026-04-02historical $99,900 338-char remark
-
2021-04-09soldstatus $45,000 491-char remark
Show marketing remark (491 chars)
SPACIOUS 3 BED/1 BATH w/HARDWOOD FLOORING & LOADS OF WINDOWS. LARGE LIVING RM w/DECORATIVE FIREPLACE & WOOD MANTLE; GRACIOUS FORMAL DINING RM w/RECESSED AREA FOR BUFEET & FRENCH DOORS BETWEEN LIVING & DINING ROOM; KITCHEN w/BREAKFAST NOOK & ALL APPLIANCES. FINISHED REC ROOM w/DRYBAR & GLASS BLOCK WINDOWS. 2-CAR GARAGE w/NEWER GARAGE DOORS & CONCRETE DRIVEWAY. NEWER A/C; ROOF; & HW TANK. LARGE FRONT PORCH w/OVERHANG. POSSESSION AT CLOSING. SECURITY SYSTEM.
-
2021-04-08price $45,000 491-char remark
Show marketing remark (491 chars)
SPACIOUS 3 BED/1 BATH w/HARDWOOD FLOORING & LOADS OF WINDOWS. LARGE LIVING RM w/DECORATIVE FIREPLACE & WOOD MANTLE; GRACIOUS FORMAL DINING RM w/RECESSED AREA FOR BUFEET & FRENCH DOORS BETWEEN LIVING & DINING ROOM; KITCHEN w/BREAKFAST NOOK & ALL APPLIANCES. FINISHED REC ROOM w/DRYBAR & GLASS BLOCK WINDOWS. 2-CAR GARAGE w/NEWER GARAGE DOORS & CONCRETE DRIVEWAY. NEWER A/C; ROOF; & HW TANK. LARGE FRONT PORCH w/OVERHANG. POSSESSION AT CLOSING. SECURITY SYSTEM.
-
2021-03-17$39,900 491-char remark
Show marketing remark (491 chars)
SPACIOUS 3 BED/1 BATH w/HARDWOOD FLOORING & LOADS OF WINDOWS. LARGE LIVING RM w/DECORATIVE FIREPLACE & WOOD MANTLE; GRACIOUS FORMAL DINING RM w/RECESSED AREA FOR BUFEET & FRENCH DOORS BETWEEN LIVING & DINING ROOM; KITCHEN w/BREAKFAST NOOK & ALL APPLIANCES. FINISHED REC ROOM w/DRYBAR & GLASS BLOCK WINDOWS. 2-CAR GARAGE w/NEWER GARAGE DOORS & CONCRETE DRIVEWAY. NEWER A/C; ROOF; & HW TANK. LARGE FRONT PORCH w/OVERHANG. POSSESSION AT CLOSING. SECURITY SYSTEM.
ⓘ Source: listings_history table (triggers on properties + properties_extension) + one-shot
backfill from property_details.listing_events for pre-trigger history.
Tax reassessment forecast OH · Partial reset (capped growth)
- Current annual tax
- $1,048 · $87/mo
- Projected year-2 tax
- $1,303 · $109/mo
- Expected delta
- +$255/yr (+$21/mo · 24.3%)
ⓘ Screening estimate from a state-policy table — verify with the county assessor before closing.
Climate risk First Street
- Flood 1/10 Low FEMA zone X (unshaded) · 0% chance over 30 yrs
- Wildfire 1/10 Low
- Heat 3/10 Moderate 7 d/yr ≥101°F today · 16 d/yr by 30 yrs out
- Wind 2/10 Low
- Air quality 2/10 Low 1 unhealthy d/yr today · 3 by 30 yrs out
Nearby sold comps map
Loading sold comps map…
Walkable amenities ~0.75 mi
Loading nearby amenities…
Taxation est. · year 1
- Rental income
- $14,077
- − Mortgage interest
- −$5,596
- − Property taxes
- −$1,048
- − Insurance
- −$500
- − Repairs & maintenance
- −$1,126
- − Management
- −$1,126
- − Depreciation
- −$2,906
- Taxable income
- $1,774
- Est. tax owed @ 24.0%
- −$426
- After-tax cash flow
- $2,860/yr
For passive investors: Depreciation is non-cash, so a rental often shows a tax loss while cash-flowing — sheltering income. Rental losses are passive: they offset passive income freely, and up to $25,000/yr can offset ordinary (W-2) income if you actively participate and your MAGI is under $100k (phasing out to $0 by $150k); unused losses carry forward. On sale, claimed depreciation is recaptured at up to 25%, and gains may owe capital-gains tax (a 1031 exchange can defer both). Figures are a year-1 estimate at your 24.0% rate — not tax advice; consult a CPA.
Schools (NCES district)
- District
- Toledo City
- NCES district ID
- 3904490
- Math proficiency
- 15% ▼ -16.00%
- Reading proficiency
- 24% ▼ -13.00%
- Median HH income
- $32,137
- Composite
- 15.76/100
- National rank
- #9276
- State rank
- #634 of 656 in OH
Livability — Toledo
- Score
- 66/100
- State rank
- #645
- US rank
- #11442
Category grades
Schools grade is shown separately in the Schools card above.
Census & demographics
- Census place
- Toledo, OH
- County
- Lucas County · 380,724 people
- City population
- 280,811
- Metro
- Toledo, OH
- Population (ZIP)
- 19,469
- Household income
- $41,335
- Rent vs Own
- Severe rent burden
- 1157.0
Population outlook (Lucas County) Hauer SSP2
- Today (2025)
- 420,751 people
- By 2030
- 410,187 · -2.5%
- By 2040
- 384,019 · -8.7%
- By 2050
- 355,125 · -15.6%
- By 2075
- 291,683 · -30.7%
- By 2100
- 233,670 · -44.5%
Race, ethnicity, and origin ACS 2023
- Neighborhood character
- Diverse neighborhood (Simpson 0.57)
- Race & ethnicity
- Black 59% White 27% Two or more races 6% Hispanic / Latino 6% Asian 3%
- Hispanic origin (detail)
- Mexican 3% Puerto Rican 2%
- Common ancestry
- Lithuanian 2% Romanian 2% Slovak 1%
- Foreign-born
- 4% · Canada
- Languages at home
- 94% English-only · Other Indo-European 1% Spanish 1% Russian/Polish/Slavic 1%
Political lean MEDSL · Lucas
- 2024 margin
- D (+12.6) · D 55.8% · R 43.2%
- 2008→2024 swing
- -18.9pp toward R · 2008: 31.4pp · 2024: 12.6pp
- All cycles
- 2024: D+12.6 2020: D+16.8 2016: D+17.4 2012: D+30.4 2008: D+31.4
Not yet ingested
- Civics
- —
Market trends
- HPI YoY
- ▼ -66.58%
- Current HPI
- 175.2772
- Rent YoY
- ▲ 8.19%
- Metro
- Toledo, OH
- State GDP YoY
- ▲ 1.98%
- F500 in state
- 48
Industry mix (Fortune 500 HQ in OH)
| Industry | F500 HQs | Revenue |
|---|---|---|
| Insurance | 3 | $145B |
|
||
| Industrial Machinery | 3 | $49B |
|
||
| Financial Services | 3 | $24B |
|
||
| Consumer Goods | 2 | $93B |
|
||
| Aerospace / Defense | 2 | $47B |
|
||
| Utilities | 2 | $33B |
|
||
Price history
+150.4% since first listed7 events — show timeline
- 2026-06-17 Listed $99,900 NORIS
- 2026-06-09 Listing Removed — NORIS
- 2026-04-06 Listed $99,900 NORIS
- 2026-04-02 Coming Soon — NORIS
- 2021-04-09 Sold (MLS) $45,000 NORIS
- 2021-04-08 Price Changed $45,000 NORIS
- 2021-03-17 Listed $39,900 NORIS
Property tax history
+10.6%/yrLatest (2025): $1,048 · +1.2% YoY. Source: county tax records.
Cash-flow waterfall
monthlySold comps — $/sqft
last 12 mo · ≤1 miLoading sold comps…