11 Walke Way · Mechanicville, NY
Flood risk No data
- FEMA flood zone
- —
- Chance of flooding over 30 yrs
- —
- Est. flood insurance / yr
- —
Fire risk No data
- Est. fire insurance / yr
- —
Heat risk No data
- Hot days now (above threshold)
- —
- Hot days in 30 yrs
- —
Wind risk No data
- Chance of severe wind over 30 yrs
- —
Air-quality risk No data
- Unhealthy air days now
- —
- Unhealthy air days in 30 yrs
- —
Risk factors via First Street. Map © Google.
Why this score? — see what drove the D grade
The composite is a weighted blend of 9 inputs, each scored 0–100. Each bar is that input's sub-score; the figure is the points it added to the 100-point composite (weight × sub-score).
- ARV discount +15.0/15.0
- Appreciation +10.0/10.0
- Schools +4.9/10.0
- Livability +3.4/5.0
- Rent growth +2.5/5.0
- Condition / age +2.5/5.0
- Cash flow +2.1/30.0
- 1% rule +0.0/10.0
- DSCR +0.0/10.0
$489,900
🖨 Deal sheet (PDF) 📄 Offer letter ✓ Due diligence
Listing remarks MLS
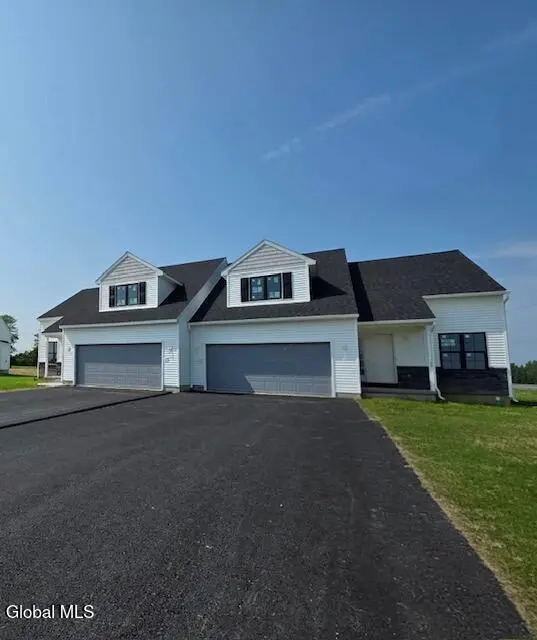
* TO BE BUILT* Harper Estates is a 34-unit twin townhome community located in the Town of Halfmoon, 6 minutes from I-87 and just minutes away from Clifton Park shopping. This home comes with a spacious floor plan and beautiful, mountain view. Kitchen includes 36-inch cabinets with crown molding, 4-foot Island, quartz counter tops and stainless-steel appliances. Living room offers vaulted ceilings with gas fireplace and LVP flooring. Primary bedroom, primary bath and laundry are on first floor. Second floor features 2 bedrooms, full bath, loft, and bonus room. Full basement for plenty of storage and an attached two car garage.
Key facts
- 4 foot island
- 36 inch cabinets
- Mountain view
Tags
Neighborhood map
What this means for you Summary
Snapshot
- This is a 3-bed/2.5-bath single-family listed at $490k.
Deal economics
- At list price, monthly cash flow is $-2k ($-21k/yr) — negative.
- To cash-flow at today's rent, offer at most $231k (52.9% below list).
- To meet the 1% rule (rent ≥ 1% of price), the offer needs to be $202k (58.8% below list).
- Recommended offer: $202k (58.8% below list) — sets the bar for 1% rule.
Location & tenants
- Location reads 67/100 on livability (#568 in NY) — a middle-class / working-renter tenant base. Strengths: housing A+, health & safety A+, cost of living B+; Watch: amenities C-, crime D+, employment D.
- Mechanicville City School District (rural): math 57% / reading 57% proficiency, ranked #270 of 590 in NY (top 46%) — acceptable for families but not a draw, mixed tenant base, ~2y average lease.
- Market conditions: 144 active listings in the ZIP; solid renter incomes; 1,132 units permitted in Saratoga County in 2024 (378 in 5+ unit buildings).
Forward outlook
- In year one you build about $52k of equity ($3k loan paydown + $49k appreciation (10.0% local appreciation)).
- Saratoga County population projected at +4% by 2050 — modest demand growth; plan on rents tracking national, not racing it.
- By year 2, paydown + projected appreciation supports a ~$84k cash-out refi (75% LTV) — recoverable capital for the next deal without selling this one.
Negotiation context
- It's been on market 76 days — a 6% lower offer ($461k) is reasonable based on typical stale-listing flexibility.
Questions for the listing agent
- What do current leases actually rent for vs. the listed asking? Can we see a recent rent roll and the last 12 months of T-12 income?
- It's been on market 76 days. Have you received any prior offers? Is the seller open to a 59% concession, seller financing, or rate buy-down credit?
- Why hasn't it sold? Are there any deal-killer items the seller is aware of (foundation, flood, title, zoning, code violations)?
- Is there a deadline driving the sale (1031 exchange, divorce, estate, relocation)? That informs how much negotiation room exists.
- Schools are B-rated — typically a magnet for longer-tenancy family renters. What's the average tenant stay here, and is there a school-zone premium baked into asking?
- Crime grade is D in this area — have there been break-ins, vandalism, or insurance claims at this property in the last 3 years? What carrier currently insures it and at what premium?
- The area grade is low — what's the realistic commute time and amenity access for the typical tenant pool here? Any planned neighborhood developments (good or bad) we should know about?
- What's the average days-on-market for RENTAL listings here right now (not sales)? A rising rental-DOM trend means longer vacancies and softer asking-rent achievability than the comps imply.
- What's the recent tenant-quality profile in this submarket — average credit score on applications, eviction rate, late-payment / NSF rate, and stable-employment percentage? A property-management company in the area should have these aggregated.
- How much new for-sale + rental construction is in the pipeline within 1–3 miles? Heavy new supply typically softens prices + rents 12–24 months out; constrained supply supports both.
Investment metrics
- 1% rule
- 0.41% ✗
- Cap rate
- 1.91%
- Cash-on-cash
- -15.66%
- DSCR
- 0.30
- GRM
- 20.2
CMA / ARV
- ARV (median comp)
- $668,728
- List price
- $489,900
- Delta
- -26.74%
- Verdict
- UNDERPRICED
- Comps
- 20 within 1.0 mi
Show comp detail 4 sales within ~0.75 mi
| Address | Dist | Beds/Ba | Sqft | Sold | Price | $/sf | Match |
|---|---|---|---|---|---|---|---|
| 27 Vosburgh Rd | 0.70mi | 3/2.5 | 1,743 (+2%) | 15mo | $525,100 | $301 | 51 |
| 6 Meridian Ct | 0.58mi | 3/3.0 | 1,580 (-7%) | 23mo | $625,000 | $396 | 40 |
| 23 Bedford Cir | 0.72mi | 3/2.0 | 1,650 (-3%) | 23mo | $480,000 | $291 | 40 |
| 41 Mcbride Rd | 0.75mi | 3/2.5 | 1,926 (+13%) | 3mo | $713,850 | $371 | 40 |
Match score weights: distance 35% · size 25% · config 20% · recency 20%. Top-matched comps best support the ARV.
Projected returns pro-forma
10.0% appreciation · 3.0% rent growth · sell at horizon
- IRR
- 13.4%
- Equity multiple
- 2.11×
- Total profit
- $152,842
- Equity at exit
- $441,341
- IRR
- 13.6%
- Equity multiple
- 4.94×
- Total profit
- $539,804
- Equity at exit
- $951,768
Cash invested: $137,172 (down + closing). Projections, not guarantees.
Landlord ↔ Tenant lean methodology
- Overall (STATE)
- 15 Strongly Tenant-Friendly
- State New York
- 15 Strongly Tenant-Friendly · D+10
- County
- — inherits STATE
- City
- — inherits STATE
ZIP-level market 12118
- Home prices YoY
- 8.3%
- Active inventory
- 144
- Price-to-rent
- 20.2×
Monthly cashflow live
- Estimated rent
- $2,020 medium interval (Pro) →
- Mortgage (P&I)
- −$2,569
- Tax est. 1.5%
- −$612 /mo · $7,348/yr
- Insurance
- −$204
- HOA
- −$0
- Vacancy / Maint / Mgmt
- −$424
- Net cashflow
- $-1,790
Break-even live
Sensitivity live
| Price | -10% $-1,451 | -5% $-1,621 | +0% $-1,790 | +5% $-1,959 | +10% $-2,128 |
|---|---|---|---|---|---|
| Rent | -10% $-1,949 | -5% $-1,870 | +0% $-1,790 | +5% $-1,710 | +10% $-1,630 |
| Rate | -1.0pp $-1,543 | -0.5pp $-1,665 | base $-1,790 | +0.5pp $-1,917 | +1.0pp $-2,046 |
UW: 25.0% down · 7.5% · 30yr · 1.5% tax · 5.0% vac · 8.0% maint · 8.0% mgmt
Financing live
Cash to close
- Down payment
- $122,475
- Closing costs
- $14,697
- Reserves months
- —
- Total cash needed
- —
Loan-product check · same deal, 3 products live
Conventional
25% down · 7.5% · 30yr
- Down + closing
- —
- Monthly P&I
- —
- Monthly cashflow
- —
- DSCR
- —
- Eligible?
- —
Personal DTI + credit; lowest rate.
DSCR
20% down · 8.5% · 30yr
- Down + closing
- —
- Monthly P&I
- —
- Monthly cashflow
- —
- DSCR
- —
- Eligible?
- —
No personal income docs; deal must DSCR.
Hard money
10% down · 12.0% · 12mo
- Down + closing
- —
- Monthly P&I
- —
- Monthly cashflow
- —
- DSCR
- —
- Eligible?
- —
Short-term bridge; refi at stabilization.
Listing history 17 events
-
2026-06-18days on market $489,900 Active 76 DOM
-
2026-06-17days on market $489,900 Active 75 DOM
-
2026-06-16days on market $489,900 Active 74 DOM
-
2026-06-15days on market $489,900 Active 73 DOM
-
2026-06-14days on market $489,900 Active 71 DOM
-
2026-06-13days on market $489,900 Active 70 DOM
-
2026-06-10days on market $489,900 Active 68 DOM
-
2026-06-09days on market $489,900 Active 67 DOM
-
2026-06-08days on market $489,900 Active 66 DOM
-
2026-06-07days on market $489,900 Active 65 DOM
-
2026-06-05days on market $489,900 Active 62 DOM
-
2026-06-03days on market $489,900 Active 61 DOM
-
2026-06-02days on market $489,900 Active 60 DOM
-
2026-06-01days on market $489,900 Active 59 DOM
-
2026-05-31days on market $489,900 Active 58 DOM
-
2026-05-31days on market $489,900 Active 57 DOM
-
2026-04-02$489,900 Active 636-char remark
Show marketing remark (636 chars)
* TO BE BUILT* Harper Estates is a 34-unit twin townhome community located in the Town of Halfmoon, 6 minutes from I-87 and just minutes away from Clifton Park shopping. This home comes with a spacious floor plan and beautiful, mountain view. Kitchen includes 36-inch cabinets with crown molding, 4-foot Island, quartz counter tops and stainless-steel appliances. Living room offers vaulted ceilings with gas fireplace and LVP flooring. Primary bedroom, primary bath and laundry are on first floor. Second floor features 2 bedrooms, full bath, loft, and bonus room. Full basement for plenty of storage and an attached two car garage.
ⓘ Source: listings_history table (triggers on properties + properties_extension) + one-shot
backfill from property_details.listing_events for pre-trigger history.
Nearby sold comps map
Loading sold comps map…
Walkable amenities ~0.75 mi
Loading nearby amenities…
Taxation est. · year 1
- Rental income
- $24,238
- − Mortgage interest
- −$27,442
- − Property taxes
- −$7,348
- − Insurance
- −$2,450
- − Repairs & maintenance
- −$1,939
- − Management
- −$1,939
- − Depreciation
- −$14,252
- Taxable loss
- −$31,132
- Est. tax savings @ 24.0%
- +$7,472
- After-tax cash flow
- $-14,007/yr
For passive investors: Depreciation is non-cash, so a rental often shows a tax loss while cash-flowing — sheltering income. Rental losses are passive: they offset passive income freely, and up to $25,000/yr can offset ordinary (W-2) income if you actively participate and your MAGI is under $100k (phasing out to $0 by $150k); unused losses carry forward. On sale, claimed depreciation is recaptured at up to 25%, and gains may owe capital-gains tax (a 1031 exchange can defer both). Figures are a year-1 estimate at your 24.0% rate — not tax advice; consult a CPA.
Schools (NCES district)
- District
- Mechanicville City School District
- NCES district ID
- 3618900
- Math proficiency
- 57% ▼ -3.00%
- Reading proficiency
- 57% ▲ 5.00%
- Median HH income
- $57,701
- Composite
- 49.33/100
- National rank
- #2021
- State rank
- #270 of 590 in NY
Livability — Mechanicville
- Score
- 67/100
- State rank
- #568
- US rank
- #10227
Category grades
Schools grade is shown separately in the Schools card above.
Census & demographics
- County
- Saratoga County · 166,192 people
- City population
- 17,069
- Metro
- Albany-Schenectady-Troy, NY
- Population (ZIP)
- 17,069
- Household income
- $92,710
- Rent vs Own
- Severe rent burden
- 552.0
Population outlook (Saratoga County) Hauer SSP2
- Today (2025)
- 238,889 people
- By 2030
- 243,681 · +2.0%
- By 2040
- 249,118 · +4.3%
- By 2050
- 248,638 · +4.1%
- By 2075
- 241,675 · +1.2%
- By 2100
- 213,150 · -10.8%
Race, ethnicity, and origin ACS 2023
- Neighborhood character
- Predominantly White (88%)
- Race & ethnicity
- White 88% Two or more races 5% Hispanic / Latino 4% Asian 3%
- Common ancestry
- Lithuanian 8% Romanian 8% Iranian 2%
- Foreign-born
- 5% · Canada, China
- Languages at home
- 92% English-only · Spanish 3% Other Indo-European 2% Chinese 1%
Political lean MEDSL · Saratoga
- 2024 margin
- Toss-up / Even · D 50.9% · R 49.1%
- 2008→2024 swing
- -1.6pp toward R · 2008: 3.4pp · 2024: 1.8pp
- All cycles
- 2024: D+1.8 2020: D+5.4 2016: R+4.4 2012: D+2.1 2008: D+3.4
Not yet ingested
- Civics
- —
Market trends
- HPI YoY
- ▲ 26.43%
- Current HPI
- 343.9893
- Rent YoY
- —
- Metro
- Albany-Schenectady-Troy, NY
- State GDP YoY
- ▲ 2.60%
- F500 in state
- 92
Industry mix (Fortune 500 HQ in NY)
| Industry | F500 HQs | Revenue |
|---|---|---|
| Financial Services | 10 | $950B |
|
||
| Consumer Goods | 9 | $162B |
|
||
| Insurance | 4 | $225B |
|
||
| Telecommunications | 2 | $144B |
|
||
| Pharmaceuticals | 2 | $112B |
|
||
| Media / Entertainment | 2 | $69B |
|
||
Price history
1 event — show timeline
- 2026-04-02 Listed $489,900 Global MLS
Cash-flow waterfall
monthlySold comps — $/sqft
last 12 mo · ≤1 miLoading sold comps…