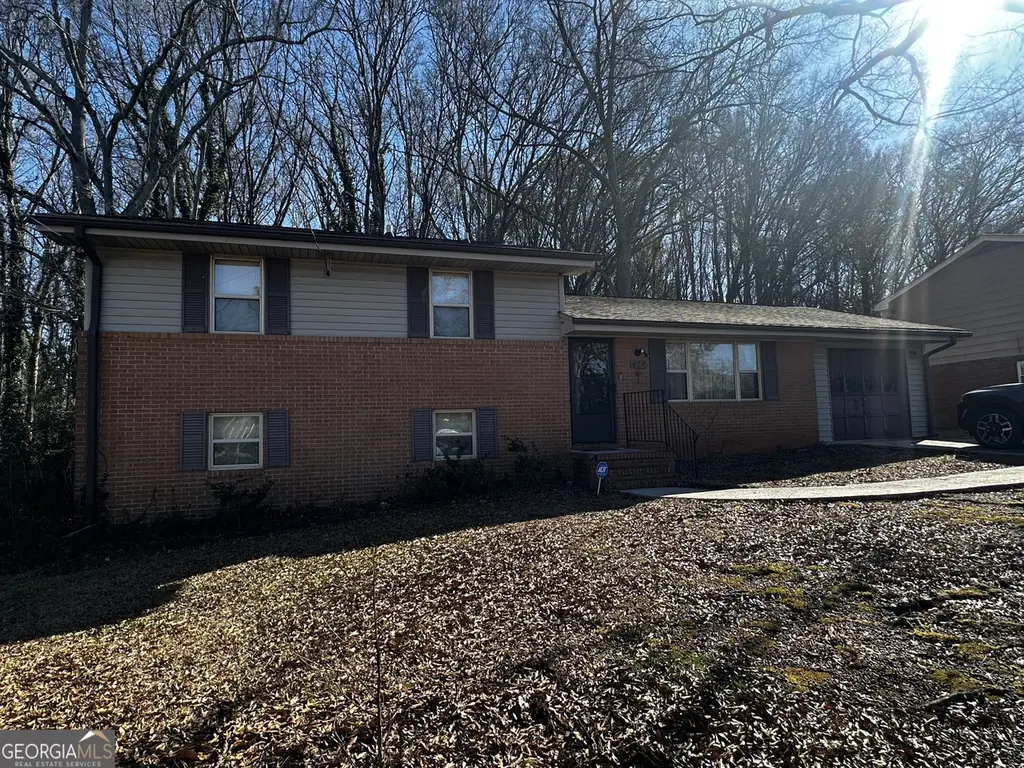
6182 Graceland Cir · Morrow, GA
Flood risk 1/10 · Minimal
- FEMA flood zone
- X (unshaded)
- Chance of flooding over 30 yrs
- 0.0%
- Est. flood insurance / yr
- $507 – $1,088
Fire risk 1/10 · Minimal
- Est. fire insurance / yr
- $963 – $1,789
Heat risk 5/10 · Moderate
- Hot days now (above 105°F)
- 7 days/yr
- Hot days in 30 yrs
- 17 days/yr
Wind risk 5/10 · Moderate
- Chance of severe wind over 30 yrs
- 26.0%
Air-quality risk 4/10 · Minor
- Unhealthy air days now
- 4 days/yr
- Unhealthy air days in 30 yrs
- 6 days/yr
Risk factors via First Street. Map © Google.
Why this score? — see what drove the C+ grade
The composite is a weighted blend of 9 inputs, each scored 0–100. Each bar is that input's sub-score; the figure is the points it added to the 100-point composite (weight × sub-score).
- Cash flow +26.0/30.0
- ARV discount +15.0/15.0
- DSCR +8.7/10.0
- 1% rule +5.8/10.0
- Livability +3.2/5.0
- Condition / age +2.5/5.0
- Rent growth +2.2/5.0
- Schools +1.3/10.0
- Appreciation +0.0/10.0
$180,000
🖨 Deal sheet 📄 Offer letter ✓ Due diligence
Listing remarks
Conveniently located near I75, shopping, and restaurants. Spacious split level is ready for your updating. 4 BR 2 BA with large deck overlooking a fenced backyard.
Key facts
- Large deck
- Fenced backyard
- 0.3 acre lot
Tags
Property features AI
Finance
- Other: Listing on market since 2026-04-09; Approximately 0.3-acre lot
- Financial info: Property sold as-is; Acceptable financing: Cash, Conventional, FHA, VA
- HOA & community: No HOA; Community features include street lights and proximity to public transport
Exterior
- Parking: Garage
- Utilities: Public water; Public sewer; Electric (220 volts); Cable available; High-speed internet available; Natural gas available; Phone available; Sewer connected; Water available; Electricity available
- Home design: Single-family house; Residential property; Multi/split levels; Built in 1968; Located in Graceland subdivision
- Construction: Brick and vinyl siding construction; Composition roof; Finished basement (partial)
- Exterior features: Composition roof; Brick and vinyl siding; Back yard with chain link fencing; Partially wooded lot; Open, sloped lot
Interior
- Kitchen: Cooktop; Dishwasher
- Bedrooms: 4 bedrooms (2 located on the lower level)
- Flooring: Carpet; Tile; Vinyl
- Bathrooms: 2 full bathrooms (one on the lower level)
- Heating & cooling: Central heating; Central air
- Interior features: Tile bath; Finished basement with interior entry (partial); Family room
- Laundry & utility: Laundry in basement; Gas water heater
Neighborhood map
What this means for you Summary
Snapshot
- This is a 4-bed/2.0-bath single-family listed at $180k.
Deal economics
- At list price, monthly cash flow is $445 ($5k/yr) — positive.
- The deal already cash-flows at list — no discount required.
- Meets the 1% rule at list price ($2k rent vs $180k).
- Cap rate 9.3% vs local median 5.0% in Morrow — top-decile yield for the area; either an underpriced asset or a hidden risk that comps aren't pricing in. Stress-test before assuming the spread holds.
Location & tenants
- Location reads 65/100 on livability (#229 in GA) — a middle-class / working-renter tenant base. Strengths: cost of living A+, housing A+; Watch: amenities D, employment D, crime F.
- Clayton County (suburban): math 11% / reading 20% proficiency, ranked #155 of 174 in GA (top 89%) — low school quality limits family demand, transient renter base, plan for 1-2y turnover; 78% free/reduced lunch — lower-income household profile, screen leases tightly.
- Zoned schools: Morrow Elementary School (454 students, 90% FRL); Babb Middle School (math 24% / reading 34%, grade F, #249 of 470 statewide, top 55%, 888 students, 90% FRL); Forest Park High School (math 8% / reading 16%, grade F, #344 of 424 statewide, top 81%, 1,765 students, 90% FRL).
- Market conditions: Rents soft (-1.0%/yr); 166 active listings in the ZIP; 15 comparable units currently listed for rent nearby; rentals at typical pace (median 22d on market — plan ~3-4 weeks tenant-placement turnaround); 40% of comp listings sitting > 30 days — soft ceiling on asking rent; 865 units permitted in Clayton County in 2024 (448 in 5+ unit buildings).
- This rent runs 44% of the median local income ($53k/yr) — at the standard rent-burdened threshold; future hikes will face affordability resistance.
Forward outlook
- Local home prices are declining (-3.0%/yr); year-one equity from $1k of loan paydown is wiped out by about $5k of value loss. Plan a longer hold.
- Clayton County population projected at +29% by 2050 — long-run rental-demand tailwind backs the buy-and-hold thesis.
Negotiation context
- Only 3 days on market — expect competitive offers; lowballing is unlikely to land.
- 2 sale attempts with the ask held roughly flat each time — persistent listings suggest the price (not the market) is what's stuck; bring a comps-based counter.
- Current owner paid $78k; list at $180k implies a 132% gain — meaningful room to come down on a strong offer.
Risks & watch-outs
- Climate carrying-cost: moderate wind risk, 26% chance of damaging wind over 30y; extreme-heat days projected 7→17/yr by 2055 (HVAC capex compounding) — expect insurance premiums to compound above CPI over the hold.
Questions for the listing agent
- Built in 1968 — when were the roof, HVAC, electrical panel, plumbing, and water heater last replaced?
- Is there a deadline driving the sale (1031 exchange, divorce, estate, relocation)? That informs how much negotiation room exists.
- Schools are F-rated, which usually means shorter tenancies and higher turnover. Who's the typical renter profile here, and what's been the actual vacancy rate?
- Crime grade is F in this area — have there been break-ins, vandalism, or insurance claims at this property in the last 3 years? What carrier currently insures it and at what premium?
- What's the average days-on-market for RENTAL listings here right now (not sales)? A rising rental-DOM trend means longer vacancies and softer asking-rent achievability than the comps imply.
- What's the recent tenant-quality profile in this submarket — average credit score on applications, eviction rate, late-payment / NSF rate, and stable-employment percentage? A property-management company in the area should have these aggregated.
- How much new for-sale + rental construction is in the pipeline within 1–3 miles? Heavy new supply typically softens prices + rents 12–24 months out; constrained supply supports both.
Investment metrics
- 1% rule
- 1.08% ✓
- Cap rate
- 9.26%
- Cash-on-cash
- 10.61%
- DSCR
- 1.47
- GRM
- 7.7
CMA / ARV
- ARV (on-the-fly)
- $231,552
- Comps found
- 12
Show comp detail 12 sales within ~0.75 mi
| Address | Dist | Beds/Ba | Sqft | Sold | Price | $/sf | Match |
|---|---|---|---|---|---|---|---|
| 6182 Graceland Cir | 0.00mi | 4/2.0 | 1,728 (0%) | 1mo | $180,200 | $104 | 100 |
| 6250 Graceland Cir | 0.13mi | 4/2.0 | 1,742 (+1%) | 3mo | $240,000 | $138 | 90 |
| 6272 Graceland Cir | 0.18mi | 3/1.5 (-1) | 1,746 (+1%) | 19mo | $229,000 | $131 | 67 |
| 1487 Hammack Dr | 0.29mi | 3/2.0 (-1) | 1,714 (-1%) | 18mo | $230,000 | $134 | 65 |
| 1196 Burbank Trl | 0.67mi | 3/2.0 (-1) | 1,798 (+4%) | 8mo | $201,000 | $112 | 50 |
| 1343 Burbank Trl | 0.56mi | 5/2.5 (+1) | 1,924 (+11%) | 5mo | $277,060 | $144 | 44 |
| 6203 Deans Way | 0.73mi | 3/1.5 (-1) | 1,560 (-10%) | 9mo | $200,000 | $128 | 35 |
| 6187 Deans Way | 0.73mi | 3/2.5 (-1) | 1,851 (+7%) | 15mo | $220,500 | $119 | 34 |
| 1764 Lake Harbin Rd | 0.68mi | 3/1.5 (-1) | 1,475 (-15%) | 5mo | $180,000 | $122 | 33 |
| 5974 Malibu Dr | 0.54mi | 3/2.0 (-1) | 1,494 (-14%) | 18mo | $250,000 | $167 | 32 |
| 1724 Argonne Dr | 0.71mi | 3/2.0 (-1) | 1,586 (-8%) | 21mo | $335,000 | $211 | 31 |
| 1574 Patricia Dr | 0.49mi | 3/2.5 (-1) | 1,496 (-13%) | 23mo | $285,000 | $191 | 29 |
Match score weights: distance 35% · size 25% · config 20% · recency 20%. Top-matched comps best support the ARV.
Projected returns pro-forma
-3.0% appreciation · 0.0% rent growth · sell at horizon
- IRR
- -3.6%
- Equity multiple
- 0.87×
- Total profit
- $-6,549
- Equity at exit
- $26,839
- IRR
- 2.7%
- Equity multiple
- 1.17×
- Total profit
- $8,580
- Equity at exit
- $15,563
Cash invested: $50,400 (down + closing). Projections, not guarantees.
Landlord ↔ Tenant lean methodology
- Overall (STATE)
- 90 Strongly Landlord-Friendly
- State Georgia
- 90 Strongly Landlord-Friendly · R+3
- County
- — inherits STATE
- City
- — inherits STATE
ZIP-level market 30260
- Home prices YoY
- -33.8%
- Rents YoY
- -1.0%
- Active inventory
- 166
- Price-to-rent
- 7.7×
Monthly cashflow live
- Estimated rent
- $1,941 high interval (Pro) →
- Mortgage (P&I)
- −$944
- Tax from tax record
- −$69 /mo · $827/yr
- Insurance
- −$75
- HOA
- −$0
- Vacancy / Maint / Mgmt
- −$408
- Net cashflow
- $445
Break-even live
UW: 25.0% down · 7.5% · 30yr · 1.5% tax · 5.0% vac · 8.0% maint · 8.0% mgmt
Financing live
Cash to close
- Down payment
- $45,000
- Closing costs
- $5,400
- Reserves months
- —
- Total cash needed
- —
Loan-product check · same deal, 3 products live
Conventional
25% down · 7.5% · 30yr
- Down + closing
- —
- Monthly P&I
- —
- Monthly cashflow
- —
- DSCR
- —
- Eligible?
- —
Personal DTI + credit; lowest rate.
DSCR
20% down · 8.5% · 30yr
- Down + closing
- —
- Monthly P&I
- —
- Monthly cashflow
- —
- DSCR
- —
- Eligible?
- —
No personal income docs; deal must DSCR.
Hard money
10% down · 12.0% · 12mo
- Down + closing
- —
- Monthly P&I
- —
- Monthly cashflow
- —
- DSCR
- —
- Eligible?
- —
Short-term bridge; refi at stabilization.
Rent comps 15 comps
| Address | Beds | Baths | Sqft | Rent | $/sqft | DOM | Units | Dist |
|---|---|---|---|---|---|---|---|---|
| 1270 Morrow Rd Morrow, GA | 3.0 | 2.0 | 1161 | $1,800 | $1.55 | 43d | 1 | 0.44mi |
| 5969 Twilight Trl Morrow, GA | 4.0 | 2.0 | 1887 | $2,015 | $1.07 | 3d | 1 | 0.57mi |
| 1227 Dove Ct Morrow, GA | 3.0 | 2.0 | 1634 | $1,750 | $1.07 | 43d | 1 | 0.58mi |
| 6290 Flamingo Way Morrow, GA | 3.0 | 1.5 | 1152 | $1,495 | $1.30 | 43d | 1 | 0.63mi |
| 1055 Pinecrest Dr Forest Park, GA | 3.0 | 1.5 | 2039 | $2,100 | $1.03 | 43d | 1 | 0.87mi |
| 6137 Harvard Ct Morrow, GA | 3.0 | 2.0 | 1320 | $1,556 | $1.18 | 22d | 1 | 0.89mi |
| 1932 Carla Dr Morrow, GA | 3.0 | 2.0 | 1324 | $1,730 | $1.31 | 1d | 1 | 0.99mi |
| 1811 Wendell Way Morrow, GA | 3.0 | 2.0 | 1285 | $1,574 | $1.22 | 22d | 1 | 1.02mi |
| 5552 Phillips Dr Morrow, GA | 3.0 | 2.0 | 1750 | $1,816 | $1.04 | 5d | 1 | 1.32mi |
| 6616 King George Way Morrow, GA | 3.0 | 2.0 | 1200 | $1,600 | $1.33 | 43d | 1 | 1.35mi |
| 2128 Baden Ct #1 Morrow, GA | 3.0 | 1.5 | 1600 | $1,495 | $0.93 | 12d | 1 | 1.35mi |
| 820 Oakdale Dr Forest Park, GA | 5.0 | 3.0 | 2120 | $2,160 | $1.02 | 44d | 1 | 1.39mi |
| 6497 Cameron Rd Morrow, GA | 5.0 | 2.0 | 1358 | $2,220 | $1.63 | 22d | 1 | 1.48mi |
| 686 Morrow Rd Forest Park, GA | 3.0 | 2.0 | 1320 | $1,950 | $1.48 | 17d | 1 | 1.49mi |
| 686 Morrow Rd Forest Park, GA | 3.0 | 2.0 | 1400 | $1,950 | $1.39 | 24d | 1 | 1.49mi |
Listing history 7 events
-
2026-05-04status Under Contract
-
2026-05-04status Back On Market
-
2026-04-12status Under Contract
-
2026-04-09$180,000 New
-
1995-12-21soldstatus $77,600
-
1991-10-29soldstatus $69,900
-
1980-10-01soldstatus $45,200
ⓘ Source: listings_history table (triggers on properties + properties_extension) + one-shot
backfill from property_details.listing_events for pre-trigger history.
Tax reassessment forecast GA · Resets to sale price
- Current annual tax
- $827 · $69/mo
- Projected year-2 tax
- $1,656 · $138/mo
- Expected delta
- +$829/yr (+$69/mo · 100.2%)
ⓘ Screening estimate from a state-policy table — verify with the county assessor before closing.
Climate risk First Street
- Flood 1/10 Low FEMA zone X (unshaded) · 0% chance over 30 yrs
- Wildfire 1/10 Low
- Heat 5/10 Major 7 d/yr ≥105°F today · 17 d/yr by 30 yrs out
- Wind 5/10 Major 26% chance of damaging wind over 30 yrs
- Air quality 4/10 Moderate 4 unhealthy d/yr today · 6 by 30 yrs out
Nearby sold comps map
Loading sold comps map…
Walkable amenities ~0.75 mi
Loading nearby amenities…
Taxation est. · year 1
- Rental income
- $23,292
- − Mortgage interest
- −$10,083
- − Property taxes
- −$827
- − Insurance
- −$900
- − Repairs & maintenance
- −$1,863
- − Management
- −$1,863
- − Depreciation
- −$5,236
- Taxable income
- $2,519
- Est. tax owed @ 24.0%
- −$604
- After-tax cash flow
- $4,742/yr
For passive investors: Depreciation is non-cash, so a rental often shows a tax loss while cash-flowing — sheltering income. Rental losses are passive: they offset passive income freely, and up to $25,000/yr can offset ordinary (W-2) income if you actively participate and your MAGI is under $100k (phasing out to $0 by $150k); unused losses carry forward. On sale, claimed depreciation is recaptured at up to 25%, and gains may owe capital-gains tax (a 1031 exchange can defer both). Figures are a year-1 estimate at your 24.0% rate — not tax advice; consult a CPA.
Schools (NCES district)
- District
- Clayton County
- NCES district ID
- 1301230
- Math proficiency
- 11% ▼ -13.00%
- Reading proficiency
- 20% ▼ -9.00%
- Median HH income
- $42,266
- Composite
- 13.41/100
- National rank
- #9527
- State rank
- #155 of 174 in GA
Livability — Morrow
- Score
- 65/100
- State rank
- #229
- US rank
- #13314
Category grades
Schools grade is shown separately in the Schools card above.
Census & demographics
- Census place
- Morrow, GA
- County
- Clayton County · 230,153 people
- City population
- 28,693
- Metro
- Atlanta-Sandy Springs-Alpharetta, GA
- Population (ZIP)
- 28,693
- Household income
- $52,666
- Rent vs Own
- Severe rent burden
- 1956.0
Population outlook (Clayton County) Hauer SSP2
- Today (2025)
- 310,777 people
- By 2030
- 329,762 · +6.1%
- By 2040
- 368,052 · +18.4%
- By 2050
- 401,196 · +29.1%
- By 2075
- 472,488 · +52.0%
- By 2100
- 500,446 · +61.0%
Race, ethnicity, and origin ACS 2023
- Neighborhood character
- Diverse neighborhood (Simpson 0.67)
- Race & ethnicity
- Black 50% Asian 20% Hispanic / Latino 19% Two or more races 7% White 7%
- Hispanic origin (detail)
- Mexican 11% Dominican 1%
- Foreign-born
- 24% · Vietnam, Canada, South Korea
- Languages at home
- 63% English-only · Spanish 17% Vietnamese 16% Other Asian/Pacific 1%
Political lean MEDSL · Clayton
- 2024 margin
- Solid D (+69.2) · D 84.3% · R 15.1%
- 2008→2024 swing
- +2.8pp toward D · 2008: 66.4pp · 2024: 69.2pp
- All cycles
- 2024: D+69.2 2020: D+70.9 2016: D+71.9 2012: D+70.1 2008: D+66.4
Not yet ingested
- Civics
- —
Market trends
- HPI YoY
- ▼ -98.24%
- Current HPI
- 192.3741
- Rent YoY
- ▼ -1.00%
- Metro
- Atlanta-Sandy Springs-Alpharetta, GA
- State GDP YoY
- ▲ 2.66%
- F500 in state
- 28
Industry mix (Fortune 500 HQ in GA)
| Industry | F500 HQs | Revenue |
|---|---|---|
| Paper / Packaging | 2 | $29B |
|
||
| Retail | 1 | $160B |
|
||
| Transportation / Logistics | 1 | $91B |
|
||
| Airlines | 1 | $62B |
|
||
| Consumer Goods | 1 | $47B |
|
||
| Utilities | 1 | $25B |
|
||
Price history
+298.2% since first listed7 events — show timeline
- 2026-05-04 Pending — GAMLS
- 2026-05-04 Relisted — GAMLS
- 2026-04-12 Pending — GAMLS
- 2026-04-09 Listed $180,000 GAMLS
- 1995-12-21 Sold (Public Records) $77,600 Public Records
- 1991-10-29 Sold (Public Records) $69,900 Public Records
- 1980-10-01 Sold (Public Records) $45,200 Public Records
Property tax history
+0.6%/yrLatest (2025): $827 · -17.5% YoY. Source: county tax records.
Cash-flow waterfall
monthlySold comps — $/sqft
last 12 mo · ≤1 miLoading sold comps…