 Fourplex
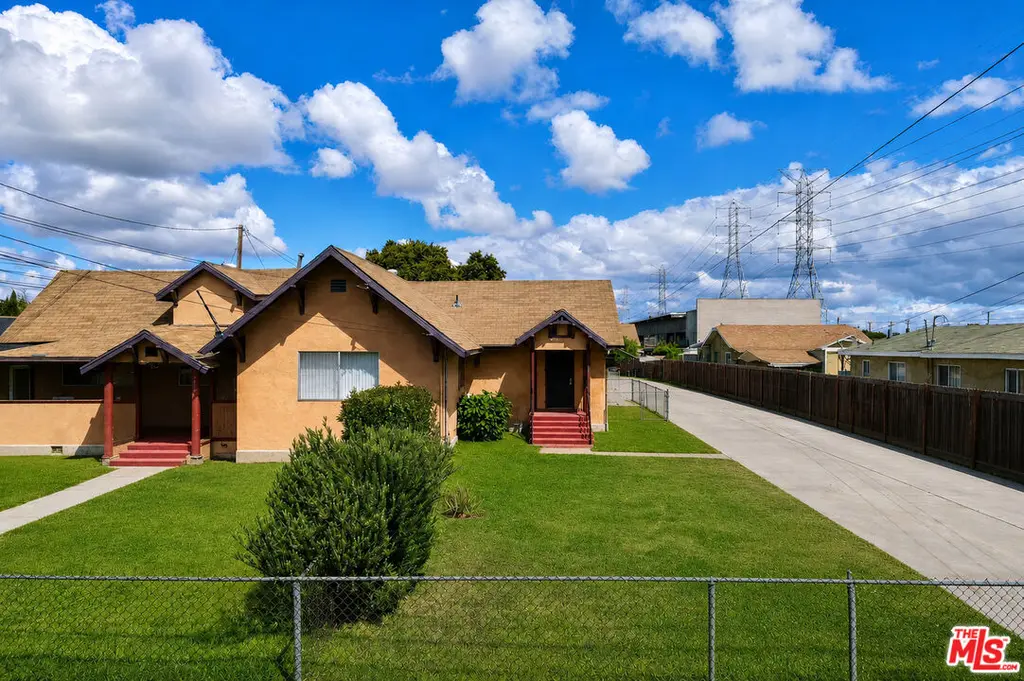
9014 S Fir Ave · Florence-Graham, CA
Flood risk 1/10 · Minimal
- FEMA flood zone
- X (unshaded)
- Chance of flooding over 30 yrs
- 0.0%
- Est. flood insurance / yr
- $507 – $1,088
Fire risk 1/10 · Minimal
- Est. fire insurance / yr
- $659 – $1,223
Heat risk 5/10 · Moderate
- Hot days now (above 90°F)
- 7 days/yr
- Hot days in 30 yrs
- 22 days/yr
Wind risk 1/10 · Minimal
- Chance of severe wind over 30 yrs
- —
Air-quality risk 5/10 · Moderate
- Unhealthy air days now
- 9 days/yr
- Unhealthy air days in 30 yrs
- 9 days/yr
Risk factors via First Street. Map © Google.
Why this score? — see what drove the D+ grade
The composite is a weighted blend of 9 inputs, each scored 0–100. Each bar is that input's sub-score; the figure is the points it added to the 100-point composite (weight × sub-score).
- Cash flow +20.2/30.0
- ARV discount +7.5/15.0
- DSCR +6.4/10.0
- 1% rule +4.1/10.0
- Schools +3.6/10.0
- Rent growth +2.5/5.0
- Livability +2.5/5.0
- Condition / age +2.5/5.0
- Appreciation +0.0/10.0
$1,250,000
🖨 Deal sheet 📄 Offer letter ✓ Due diligence
Multi-family units
County records classify this as Multi-Family (2-4 Unit). Listing-text estimate: 4 units. confirmed
Listing remarks MLS
"Price Improvement". .. Don't miss this Great opportunity on a 4-unit property!! Just over 19,000 square foot lot, 3 buildings each with their own yard, utilities metered, lots of driveway parking 2 spaces for each unit, and potential to expand more units! All 4 units have laundry hookups. 2 units have patios on the rear of the property, and 3 units have fenced front and back yards. Good investment or occupy 1 unit and rent the remaining. This property is in a great location just minutes away from restaurants, shopping, entertainment, and so many more amenities. "So much potential within this property".
Key facts
- Expansive lot
- Rear patios
- Private yard
Tags
Property features AI
Finance
- Other: Property is fee land lease type; Affordable housing qualified; sold as-is; located in an unincorporated community; Tenant rights possession; All tenant-owned appliances and personal items are excluded
- Financial info: Gross monthly income listed as $4,650; Gross operating income reported as $55,800 annually; Net operating income reported as $49,950 annually; Total annual expenses reported as $5,856; Cap rate listed at 4%; Gross rent multiplier listed as 4; Owner is responsible for gardener; tenants pay gas, electric, cable TV, trash, and water; Units are residential; unit mix includes 1-, 2-, 3-, and 4-bedroom unit types (counts shown per unit entry); Listing terms include conventional, cash to existing loan, or cash
- HOA & community: Four units in the complex
Exterior
- Parking: Driveway; Approximately 10 parking spaces
- Security: Gated
- Utilities: Public water; Sewer connected and paid
- Home design: Residential income property; Detached building with no common walls; One level / single-story; Faces west; No additions or alterations reported
- Construction: Frame construction with hard coat stucco; Combination and raised foundation
- Exterior features: Front and rear porches; Fenced yard; Front yard and back yard
Interior
- Kitchen: Hood fan
- Bedrooms: Unit 1: 2 bedrooms; Unit 2: 1 bedroom; Unit 3: 3 bedrooms; Unit 4: 1 bedroom
- Flooring: Mixed flooring
- Bathrooms: Unit 1: 1 bath; Unit 2: 1 bath; Unit 3: 1 bath; Unit 4: 1 bath
- Heating & cooling: Wall heating; Wall or window cooling units
- Interior features: Ground-level entry with steps; Smoke detector; Hood fan
- Laundry & utility: Laundry in unit; Gas dryer hookup; Water heaters present (multi-tank, individual units)
Neighborhood map
What this means for you Summary
Snapshot
- This is a 4 × 2-bed/1.0-bath units multifamily listed at $1.25M.
Deal economics
- At list price, monthly cash flow is $2k ($19k/yr) — positive. Per door: $394/mo.
- The deal already cash-flows at list — no discount required.
- To meet the 1% rule (rent ≥ 1% of price), the offer needs to be $1.14M (9.1% below list).
- Recommended offer: $1.14M (9.1% below list) — sets the bar for 1% rule.
- Cap rate 7.8% vs local median 4.4% in Florence-Graham — top-decile yield for the area; either an underpriced asset or a hidden risk that comps aren't pricing in. Stress-test before assuming the spread holds.
Location & tenants
- Location reads: area grade D — affects rentability + tenant quality, not the cash-flow math above.
- Los Angeles Unified (urban): math 29% / reading 54% proficiency, ranked #223 of 517 in CA (top 43%) — families likely to look elsewhere, expect single-tenant / working-renter base with shorter leases; 67% free/reduced lunch — lower-income household profile, screen leases tightly.
- Market conditions: 73 active listings in the ZIP; 27 comparable units currently listed for rent nearby; rentals lingering (median 44d on market — plan ~5-8 weeks vacancy on turnover, expect pricing pressure); 74% of comp listings sitting > 30 days — soft ceiling on asking rent; 19,697 units permitted in Los Angeles County in 2024 (9,426 in 5+ unit buildings).
- At $11,359/mo this rent would consume 231% of the median local household income ($59k/yr) (locally 2997% of renters already pay >50% of income on rent) — very limited rent-growth headroom before tenants either downsize or default.
Forward outlook
- Local home prices are declining (-3.0%/yr); year-one equity from $9k of loan paydown is wiped out by about $38k of value loss. Plan a longer hold.
- Los Angeles County population projected at +9% by 2050 — modest demand growth; plan on rents tracking national, not racing it.
Negotiation context
- Only 8 days on market — expect competitive offers; lowballing is unlikely to land.
- 3 sale attempts with the ask held roughly flat each time — persistent listings suggest the price (not the market) is what's stuck; bring a comps-based counter.
- Current owner paid $880k; 42% above their basis — modest negotiation headroom, anchor on the comps not their cost.
Risks & watch-outs
- Watch-outs: built in 1907 — expect roof / HVAC / electrical / plumbing capex.
- Climate carrying-cost: extreme-heat days projected 7→22/yr by 2055 (HVAC capex compounding) — expect insurance premiums to compound above CPI over the hold.
Questions for the listing agent
- Can we see the unit-by-unit rent roll, current vacancy, and any below-market leases? What's the average tenancy length?
- What capital expenditures (roof, boiler, parking lot, exteriors) have been made in the last 5 years, and what's planned in the next 2?
- Built in 1907 — when were the roof, HVAC, electrical panel, plumbing, and water heater last replaced?
- Is there a deadline driving the sale (1031 exchange, divorce, estate, relocation)? That informs how much negotiation room exists.
- The area grade is low — what's the realistic commute time and amenity access for the typical tenant pool here? Any planned neighborhood developments (good or bad) we should know about?
- What's the average days-on-market for RENTAL listings here right now (not sales)? A rising rental-DOM trend means longer vacancies and softer asking-rent achievability than the comps imply.
- What's the recent tenant-quality profile in this submarket — average credit score on applications, eviction rate, late-payment / NSF rate, and stable-employment percentage? A property-management company in the area should have these aggregated.
- How much new apartment / multifamily construction is in the pipeline within 1–3 miles? Heavy new supply (>2% of stock underway) typically softens rents 12–24 months out; light construction supports rent growth.
Investment metrics
- 1% rule
- 0.91% ✗
- Cap rate
- 7.81%
- Cash-on-cash
- 5.40%
- DSCR
- 1.24
- GRM
- 9.2
CMA / ARV
- ARV (on-the-fly)
- $763,880
- Comps found
- 6
Show comp detail 6 sales within ~0.75 mi
| Address | Dist | Beds/Ba | Sqft | Sold | Price | $/sf | Match |
|---|---|---|---|---|---|---|---|
| 9413 Croesus Ave | 0.28mi | 3/2.0 | 1,333 (-9%) | 17mo | $500,000 | $375 | 57 |
| 8738 Graham Ave | 0.38mi | 4/4.0 (+1) | 1,440 (-2%) | 13mo | $660,000 | $458 | 55 |
| 9526-28 BANDERA St | 0.38mi | 4/2.0 (+1) | 1,586 (+8%) | 14mo | $580,000 | $366 | 53 |
| 8401 S Fir Ave | 0.49mi | 3/2.0 | 1,331 (-9%) | 13mo | $692,000 | $520 | 51 |
| 8034 Crockett Blvd | 0.74mi | 4/— (+1) | 1,477 (+0%) | 17mo | $860,000 | $582 | 46 |
| 8219-8221 Morton Ave | 0.63mi | 4/2.0 (+1) | 1,506 (+2%) | 23mo | $800,000 | $531 | 42 |
Match score weights: distance 35% · size 25% · config 20% · recency 20%. Top-matched comps best support the ARV.
Projected returns pro-forma
-3.0% appreciation · 3.0% rent growth · sell at horizon
- IRR
- -8.0%
- Equity multiple
- 0.71×
- Total profit
- $-102,751
- Equity at exit
- $186,379
- IRR
- 1.5%
- Equity multiple
- 1.11×
- Total profit
- $37,397
- Equity at exit
- $108,077
Cash invested: $350,000 (down + closing). Projections, not guarantees.
Landlord ↔ Tenant lean methodology
- Overall (STATE)
- 18 Strongly Tenant-Friendly
- State California
- 18 Strongly Tenant-Friendly · D+13
- County
- — inherits STATE
- City
- — inherits STATE
ZIP-level market 90002
- Active inventory
- 73
- Price-to-rent
- 36.7×
Monthly cashflow live
- Estimated rent
- $11,359 medium interval (Pro) →
- Mortgage (P&I)
- −$6,555
- Tax from tax record
- −$321 /mo · $3,856/yr
- Insurance
- −$521
- HOA
- −$0
- Vacancy / Maint / Mgmt
- −$2,385
- Net cashflow
- $1,576
Break-even live
4-unit breakdown (identical units grouped — click to expand)
| Units | Beds | Baths | Est. rent |
|---|---|---|---|
| 4× units | 2 | 1 | $11,360 |
| #1 | 2 | 1 | $2,840 |
| #2 | 2 | 1 | $2,840 |
| #3 | 2 | 1 | $2,840 |
| #4 | 2 | 1 | $2,840 |
| Total (4 units) | $11,359 | ||
UW: 25.0% down · 7.5% · 30yr · 1.5% tax · 5.0% vac · 8.0% maint · 8.0% mgmt
Financing live
Cash to close
- Down payment
- $312,500
- Closing costs
- $37,500
- Reserves months
- —
- Total cash needed
- —
Loan-product check · same deal, 3 products live
Conventional
25% down · 7.5% · 30yr
- Down + closing
- —
- Monthly P&I
- —
- Monthly cashflow
- —
- DSCR
- —
- Eligible?
- —
Personal DTI + credit; lowest rate.
DSCR
20% down · 8.5% · 30yr
- Down + closing
- —
- Monthly P&I
- —
- Monthly cashflow
- —
- DSCR
- —
- Eligible?
- —
No personal income docs; deal must DSCR.
Hard money
10% down · 12.0% · 12mo
- Down + closing
- —
- Monthly P&I
- —
- Monthly cashflow
- —
- DSCR
- —
- Eligible?
- —
Short-term bridge; refi at stabilization.
Rent comps 27 comps
| Address | Beds | Baths | Sqft | Rent | $/sqft | DOM | Units | Dist |
|---|---|---|---|---|---|---|---|---|
| 2118 E 92nd St Unit 2120 Watts, CA | 4.0 | 2.0 | 1303 | $3,668 | $2.82 | 19d | 1 | 0.20mi |
| 2118 E 92nd St Unit 2120 Watts, CA | 4.0 | 2.0 | 1303 | $3,150 | $2.42 | 5d | 1 | 0.20mi |
| 9412 Wilmington Ave Unit 1-2 Los Angeles, CA | 2.0 | 1.0 | 900 | $2,395 | $2.66 | 24d | 1 | 0.26mi |
| 9526 Croesus Ave Unit 9526 Los Angeles, CA | 3.0 | 1.0 | 1000 | $2,800 | $2.80 | 43d | 1 | 0.42mi |
| 9525 Juniper St Unit 9525 1/2 Los Angeles, CA | 2.0 | 1.0 | 1001 | $2,450 | $2.45 | 16d | 1 | 0.43mi |
| 7923 Morton Ave Los Angeles, CA | 2.0 | 1.0 | 1320 | $2,950 | $2.23 | 19d | 1 | 0.82mi |
| 8462 Zamora Ave Los Angeles, CA | 3.0 | 1.0 | 952 | $2,895 | $3.04 | 24d | 1 | 0.88mi |
| 9310 Pace Ave Los Angeles, CA | 3.0 | 1.0 | 1254 | $3,200 | $2.55 | 43d | 1 | 0.93mi |
| 9312 Pace Ave Los Angeles, CA | 4.0 | 2.0 | 1798 | $4,000 | $2.22 | 43d | 1 | 0.93mi |
| 10376 Wilmington Ave Los Angeles, CA | 3.0 | 2.0 | 1230 | $2,990 | $2.43 | 43d | 1 | 0.94mi |
| 8715 Hooper Ave Unit 87195 Los Angeles, CA | 3.0 | 2.0 | 1050 | $3,490 | $3.32 | 43d | 1 | 1.02mi |
| 10422 1/2 Graham Ave Unit Graham(10422 1/2) Watts, CA | 3.0 | 3.0 | 1250 | $3,100 | $2.48 | 43d | 1 | 1.03mi |
| 2023 E 77th St Los Angeles, CA | 3.0 | 2.0 | 1400 | $3,498 | $2.50 | 43d | 1 | 1.05mi |
| 7674 Whitsett Ave Los Angeles, CA | 4.0 | 2.0 | 1500 | $4,500 | $3.00 | 43d | 1 | 1.07mi |
| 7674 Whitsett Ave Unit NA Los Angeles, CA | 4.0 | 2.0 | 1500 | $3,585 | $2.39 | 43d | 1 | 1.07mi |
| 8416 Hooper Ave Los Angeles, CA | 4.0 | 3.0 | 1600 | $3,350 | $2.09 | 43d | 1 | 1.09mi |
| 7914 Seville Ave Unit B Huntington Park, CA | 2.0 | 2.0 | 900 | $2,200 | $2.44 | 43d | 1 | 1.15mi |
| 915 E 91st St Unit 915 Los Angeles, CA | 3.0 | 1.0 | 1800 | $3,200 | $1.78 | 43d | 1 | 1.21mi |
| 10913 Wilmington Ave Los Angeles, CA | 4.0 | 2.0 | 1450 | $3,050 | $2.10 | 43d | 1 | 1.27mi |
| 10952 Wilmington Ave Unit 10952 Los Angeles, CA | 3.0 | 2.0 | 1164 | $2,990 | $2.57 | 43d | 1 | 1.31mi |
| 10952 1/2 Wilmington Ave Los Angeles, CA | 3.0 | 2.0 | 1164 | $2,950 | $2.53 | 43d | 1 | 1.31mi |
| 1159 E 78th St Los Angeles, CA | 4.0 | 2.0 | 1300 | $3,950 | $3.04 | 43d | 1 | 1.36mi |
| 1124 Nadeau St Los Angeles, CA | 3.0 | 1.5 | 1000 | $3,995 | $4.00 | 5d | 1 | 1.36mi |
| 909 E 83rd St Los Angeles, CA | 4.0 | 2.0 | 1400 | $3,888 | $2.78 | 43d | 1 | 1.36mi |
| 10527 Pace Ave Los Angeles, CA | 3.0 | 1.0 | 992 | $3,400 | $3.43 | 43d | 1 | 1.39mi |
| 1667 E 111th St Los Angeles, CA | 2.0 | 2.0 | 1225 | $2,600 | $2.12 | 43d | 1 | 1.43mi |
| 7024 Middleton St Unit B Huntington Park, CA | 2.0 | 1.0 | 1000 | $2,300 | $2.30 | 43d | 1 | 1.49mi |
Listing history 6 events
-
2026-06-18days on market $1,250,000 Active 8 DOM
-
2026-06-17days on market $1,250,000 Active 7 DOM
-
2026-06-16days on market $1,250,000 Active 6 DOM
-
2026-06-15days on market $1,250,000 Active 5 DOM
-
2026-06-13remarks 699-char remark
-
2026-06-13$1,250,000 Active 3 DOM
ⓘ Source: listings_history table (triggers on properties + properties_extension) + one-shot
backfill from property_details.listing_events for pre-trigger history.
Tax reassessment forecast CA · Resets to sale price
- Current annual tax
- $3,856 · $321/mo
- Projected year-2 tax
- $9,500 · $792/mo
- Expected delta
- +$5,644/yr (+$470/mo · 146.3%)
ⓘ Screening estimate from a state-policy table — verify with the county assessor before closing.
Climate risk First Street
- Flood 1/10 Low FEMA zone X (unshaded) · 0% chance over 30 yrs
- Wildfire 1/10 Low
- Heat 5/10 Major 7 d/yr ≥90°F today · 22 d/yr by 30 yrs out
- Wind 1/10 Low
- Air quality 5/10 Major 9 unhealthy d/yr today · 9 by 30 yrs out
Nearby sold comps map
Loading sold comps map…
Walkable amenities ~0.75 mi
Loading nearby amenities…
Taxation est. · year 1
- Rental income
- $136,308
- − Mortgage interest
- −$70,019
- − Property taxes
- −$3,856
- − Insurance
- −$6,250
- − Repairs & maintenance
- −$10,905
- − Management
- −$10,905
- − Depreciation
- −$36,364
- Taxable loss
- −$1,991
- Est. tax savings @ 24.0%
- +$478
- After-tax cash flow
- $19,393/yr
For passive investors: Depreciation is non-cash, so a rental often shows a tax loss while cash-flowing — sheltering income. Rental losses are passive: they offset passive income freely, and up to $25,000/yr can offset ordinary (W-2) income if you actively participate and your MAGI is under $100k (phasing out to $0 by $150k); unused losses carry forward. On sale, claimed depreciation is recaptured at up to 25%, and gains may owe capital-gains tax (a 1031 exchange can defer both). Figures are a year-1 estimate at your 24.0% rate — not tax advice; consult a CPA.
Schools (NCES district)
- District
- Los Angeles Unified
- NCES district ID
- 0622710
- Math proficiency
- 29% ▼ -4.00%
- Reading proficiency
- 54% ▲ 10.00%
- Median HH income
- $50,403
- Composite
- 35.67/100
- National rank
- #4875
- State rank
- #223 of 517 in CA
Livability — Florence-Graham
No livability data for this city. (Only ~50 U.S. cities are tracked.)
Census & demographics
- Census place
- Florence-Graham, CA
- County
- Los Angeles County · 9,444,647 people
- City population
- 56,189
- Metro
- Los Angeles-Long Beach-Anaheim, CA
- Population (ZIP)
- 52,122
- Household income
- $59,021
- Rent vs Own
- Severe rent burden
- 2997.0
Population outlook (Los Angeles County) Hauer SSP2
- Today (2025)
- 10,940,515 people
- By 2030
- 11,256,481 · +2.9%
- By 2040
- 11,729,929 · +7.2%
- By 2050
- 11,948,407 · +9.2%
- By 2075
- 11,818,114 · +8.0%
- By 2100
- 10,842,928 · -0.9%
Race, ethnicity, and origin ACS 2023
- Neighborhood character
- Predominantly Hispanic (82%)
- Race & ethnicity
- Hispanic / Latino 82% Two or more races 23% Black 15% Native American 3% Asian 1%
- Hispanic origin (detail)
- Mexican 61%
- Foreign-born
- 36% · Canada
- Languages at home
- 25% English-only · Spanish 74%
Political lean MEDSL · Los Angeles
- 2024 margin
- Solid D (+32.9) · D 64.8% · R 31.9% · Other 3.3%
- 2008→2024 swing
- -7.4pp toward R · 2008: 40.4pp · 2024: 32.9pp
- All cycles
- 2024: D+32.9 2020: D+44.2 2016: D+48.0 2012: D+40.0 2008: D+40.4
Not yet ingested
- Civics
- —
Market trends
- HPI YoY
- ▼ -698.86%
- Current HPI
- 478.4773
- Rent YoY
- —
- Metro
- Los Angeles-Long Beach-Anaheim, CA
- State GDP YoY
- ▲ 3.21%
- F500 in state
- 116
Industry mix (Fortune 500 HQ in CA)
| Industry | F500 HQs | Revenue |
|---|---|---|
| Technology | 27 | $1,492B |
|
||
| Financial Services | 3 | $174B |
|
||
| Retail | 3 | $44B |
|
||
| Insurance | 3 | $26B |
|
||
| Media / Entertainment | 2 | $115B |
|
||
| Pharmaceuticals / Biotech | 2 | $62B |
|
||
Price history
+3372.2% since first listed8 events — show timeline
- 2026-06-10 Listed $1,250,000 TheMLS
- 2025-10-01 Sold (MLS) $880,000 CRMLS
- 2025-09-30 Sold (Public Records) $880,000 Public Records
- 2025-09-26 Pending — CRMLS
- 2025-07-14 Price Changed $895,000 CRMLS
- 2025-07-10 Relisted — CRMLS
- 2025-04-29 Listed $930,000 CRMLS
- 1978-08-30 Sold (Public Records) $36,000 Public Records
Property tax history
+2.8%/yrLatest (2025): $3,856 · +10.7% YoY. Source: county tax records.
Cash-flow waterfall
monthlySold comps — $/sqft
last 12 mo · ≤1 miLoading sold comps…