1823 Sharon St · Warsaw, IN
Flood risk 1/10 · Minimal
- FEMA flood zone
- X (unshaded)
- Chance of flooding over 30 yrs
- 0.0%
- Est. flood insurance / yr
- $507 – $1,088
Fire risk 1/10 · Minimal
- Est. fire insurance / yr
- $717 – $1,331
Heat risk 3/10 · Minor
- Hot days now (above 99°F)
- 7 days/yr
- Hot days in 30 yrs
- 16 days/yr
Wind risk 2/10 · Minimal
- Chance of severe wind over 30 yrs
- —
Air-quality risk 3/10 · Minor
- Unhealthy air days now
- 1 days/yr
- Unhealthy air days in 30 yrs
- 3 days/yr
Risk factors via First Street. Map © Google.
Why this score? — see what drove the D+ grade
The composite is a weighted blend of 9 inputs, each scored 0–100. Each bar is that input's sub-score; the figure is the points it added to the 100-point composite (weight × sub-score).
- Cash flow +15.2/30.0
- ARV discount +11.3/15.0
- DSCR +4.7/10.0
- Schools +4.1/10.0
- Livability +3.9/5.0
- 1% rule +3.2/10.0
- Rent growth +2.5/5.0
- Condition / age +2.5/5.0
- Appreciation +0.0/10.0
$178,000
🖨 Deal sheet (PDF) 📄 Offer letter ✓ Due diligence
Listing remarks MLS
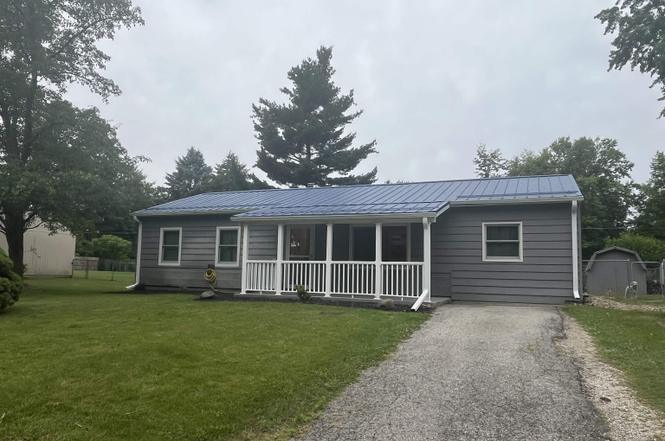
Come check out this 4 bedroom, 1 bath home with a fenced in yard and move in ready! 1200 finished square feet with main floor laundry. Relax on your front porch or on the new back deck added just last year. Kitchen appliances included
Key facts
- New metal roof
- Large fenced yard
- Front porch
Tags
Property features AI
Exterior
- Parking: Asphalt parking
- Utilities: Private well water; Septic tank sewer
- Home design: Single-family residence; Site-built home; One story
- Construction: Aluminum siding and brick exterior; Metal roof; Slab foundation; Built as site-built home
- Exterior features: Chain link fencing; Level lot; Shed(s)
Interior
- Kitchen: Dishwasher; Refrigerator; Gas range; Exhaust fan
- Flooring: Carpet; Laminate; Vinyl
- Bathrooms: 1 full bathroom (main level)
- Heating & cooling: Central air; Ceiling fan(s); Natural gas forced-air heating
- Interior features: Ceiling fan(s); Window treatments; One fireplace
- Laundry & utility: Washer hookup (main level); Electric dryer hookup (main level); Tankless water heater; Water heater; Water softener (rented)
Neighborhood map
What this means for you Summary
Snapshot
- This is a 4-bed/1.0-bath single-family listed at $178k.
Deal economics
- At list price, monthly cash flow is $63 ($758/yr) — positive.
- The deal already cash-flows at list — no discount required.
- To meet the 1% rule (rent ≥ 1% of price), the offer needs to be $146k (18.1% below list).
- Recommended offer: $146k (18.1% below list) — sets the bar for 1% rule.
- Cap rate 6.7% vs local median 3.1% in Warsaw — top-decile yield for the area; either an underpriced asset or a hidden risk that comps aren't pricing in. Stress-test before assuming the spread holds.
Location & tenants
- Location reads 77/100 on livability (#42 in IN, #3,114 nationally) — a middle-class / working-renter tenant base. Strengths: cost of living A+, housing A+, health & safety A; Watch: employment C-, crime D+, amenities F.
- Warsaw Community Schools (town): math 45% / reading 49% proficiency, ranked #78 of 301 in IN (top 26%) — families likely to look elsewhere, expect single-tenant / working-renter base with shorter leases.
- Zoned schools: Madison Elementary School (math 52% / reading 44%, grade D, #314 of 994 statewide, top 32%, 477 students, 48% FRL); Edgewood Middle School (math 41% / reading 51%, grade D+, #76 of 330 statewide, top 23%, 537 students, 45% FRL); Warsaw Community High School (math 37% / reading 68%, grade C-, #102 of 369 statewide, top 28%, 2,104 students, 43% FRL) — zoned schools at 45% FRL track the district average.
- Market conditions: 105 active listings in the ZIP; 261 units permitted in Kosciusko County in 2024 (10 in 5+ unit buildings).
Forward outlook
- Local home prices are declining (-3.0%/yr); year-one equity from $1k of loan paydown is wiped out by about $5k of value loss. Plan a longer hold.
- Kosciusko County population projected at +3% by 2050 — modest demand growth; plan on rents tracking national, not racing it.
Negotiation context
- Only 4 days on market — expect competitive offers; lowballing is unlikely to land.
- 2 sale attempts since 7y ago with the ask held roughly flat each time — persistent listings suggest the price (not the market) is what's stuck; bring a comps-based counter.
- Current owner paid $109k; list at $178k implies a 63% gain — meaningful room to come down on a strong offer.
Questions for the listing agent
- Built in 1970 — when were the roof, HVAC, electrical panel, plumbing, and water heater last replaced?
- Is there a deadline driving the sale (1031 exchange, divorce, estate, relocation)? That informs how much negotiation room exists.
- Schools are D-rated, which usually means shorter tenancies and higher turnover. Who's the typical renter profile here, and what's been the actual vacancy rate?
- Crime grade is D in this area — have there been break-ins, vandalism, or insurance claims at this property in the last 3 years? What carrier currently insures it and at what premium?
- The area grade is low — what's the realistic commute time and amenity access for the typical tenant pool here? Any planned neighborhood developments (good or bad) we should know about?
- What's the average days-on-market for RENTAL listings here right now (not sales)? A rising rental-DOM trend means longer vacancies and softer asking-rent achievability than the comps imply.
- What's the recent tenant-quality profile in this submarket — average credit score on applications, eviction rate, late-payment / NSF rate, and stable-employment percentage? A property-management company in the area should have these aggregated.
- How much new for-sale + rental construction is in the pipeline within 1–3 miles? Heavy new supply typically softens prices + rents 12–24 months out; constrained supply supports both.
Investment metrics
- 1% rule
- 0.82% ✗
- Cap rate
- 6.72%
- Cash-on-cash
- 1.52%
- DSCR
- 1.07
- GRM
- 10.2
CMA / ARV
- ARV (on-the-fly)
- $194,400
- Comps found
- 12
Show comp detail 12 sales within ~0.75 mi
| Address | Dist | Beds/Ba | Sqft | Sold | Price | $/sf | Match |
|---|---|---|---|---|---|---|---|
| 1832 Nye St | 0.09mi | 4/1.0 | 1,200 (0%) | 4mo | $171,000 | $143 | 93 |
| 1506 Maye St | 0.14mi | 3/1.5 (-1) | 1,200 (0%) | 7mo | $170,000 | $142 | 81 |
| 1307 Greenhill Dr | 0.17mi | 3/2.0 (-1) | 1,244 (+4%) | 1mo | $202,000 | $162 | 76 |
| 1502 Maye St | 0.16mi | 3/1.5 (-1) | 1,200 (0%) | 13mo | $150,000 | $125 | 75 |
| 1917 Rosemont Ave | 0.36mi | 3/1.0 (-1) | 1,228 (+2%) | 1mo | $99,900 | $81 | 74 |
| 1918 Robin Dr | 0.34mi | 3/1.0 (-1) | 1,174 (-2%) | 15mo | $165,000 | $141 | 63 |
| 1827 Nye St | 0.07mi | 3/1.0 (-1) | 1,040 (-13%) | 10mo | $189,000 | $182 | 61 |
| 1906 Robin Dr | 0.35mi | 3/1.0 (-1) | 1,062 (-12%) | 3mo | $187,000 | $176 | 57 |
| 1402 Flamingo Dr | 0.34mi | 3/1.5 (-1) | 1,288 (+7%) | 14mo | $196,900 | $153 | 53 |
| 1804 Robin Dr | 0.39mi | 3/1.0 (-1) | 1,077 (-10%) | 9mo | $181,000 | $168 | 52 |
| 1813 Crescent Dr | 0.28mi | 3/2.0 (-1) | 1,025 (-15%) | 12mo | $199,900 | $195 | 44 |
| 1325 Copeland St | 0.41mi | 3/1.5 (-1) | 1,050 (-12%) | 14mo | $192,500 | $183 | 41 |
Match score weights: distance 35% · size 25% · config 20% · recency 20%. Top-matched comps best support the ARV.
Projected returns pro-forma
-3.0% appreciation · 3.0% rent growth · sell at horizon
- IRR
- -13.9%
- Equity multiple
- 0.50×
- Total profit
- $-24,888
- Equity at exit
- $26,540
- IRR
- -5.2%
- Equity multiple
- 0.66×
- Total profit
- $-16,757
- Equity at exit
- $15,390
Cash invested: $49,840 (down + closing). Projections, not guarantees.
Landlord ↔ Tenant lean methodology
- Overall (STATE)
- 90 Strongly Landlord-Friendly
- State Indiana
- 90 Strongly Landlord-Friendly · R+11
- County
- — inherits STATE
- City
- — inherits STATE
ZIP-level market 46580
- Home prices YoY
- -19.2%
- Active inventory
- 105
- Price-to-rent
- 10.2×
Monthly cashflow live
- Estimated rent
- $1,458 medium interval (Pro) →
- Mortgage (P&I)
- −$933
- Tax from tax record
- −$81 /mo · $976/yr
- Insurance
- −$74
- HOA
- −$0
- Vacancy / Maint / Mgmt
- −$306
- Net cashflow
- $63
Break-even live
Sensitivity live
| Price | -10% $164 | -5% $114 | +0% $63 | +5% $13 | +10% $-38 |
|---|---|---|---|---|---|
| Rent | -10% $-52 | -5% $6 | +0% $63 | +5% $121 | +10% $178 |
| Rate | -1.0pp $153 | -0.5pp $108 | base $63 | +0.5pp $17 | +1.0pp $-30 |
UW: 25.0% down · 7.5% · 30yr · 1.5% tax · 5.0% vac · 8.0% maint · 8.0% mgmt
Financing live
Cash to close
- Down payment
- $44,500
- Closing costs
- $5,340
- Reserves months
- —
- Total cash needed
- —
Loan-product check · same deal, 3 products live
Conventional
25% down · 7.5% · 30yr
- Down + closing
- —
- Monthly P&I
- —
- Monthly cashflow
- —
- DSCR
- —
- Eligible?
- —
Personal DTI + credit; lowest rate.
DSCR
20% down · 8.5% · 30yr
- Down + closing
- —
- Monthly P&I
- —
- Monthly cashflow
- —
- DSCR
- —
- Eligible?
- —
No personal income docs; deal must DSCR.
Hard money
10% down · 12.0% · 12mo
- Down + closing
- —
- Monthly P&I
- —
- Monthly cashflow
- —
- DSCR
- —
- Eligible?
- —
Short-term bridge; refi at stabilization.
Listing history 4 events
-
2026-06-21days on market $178,000 Active 4 DOM
-
2026-06-19days on market $178,000 Active 2 DOM
-
2026-06-17remarks 318-char remark
-
2026-06-17$178,000 Active 1 DOM
ⓘ Source: listings_history table (triggers on properties + properties_extension) + one-shot
backfill from property_details.listing_events for pre-trigger history.
Tax reassessment forecast IN · Partial reset (capped growth)
- Current annual tax
- $976 · $81/mo
- Projected year-2 tax
- $1,244 · $104/mo
- Expected delta
- +$269/yr (+$22/mo · 27.5%)
ⓘ Screening estimate from a state-policy table — verify with the county assessor before closing.
Climate risk First Street
- Flood 1/10 Low FEMA zone X (unshaded) · 0% chance over 30 yrs
- Wildfire 1/10 Low
- Heat 3/10 Moderate 7 d/yr ≥99°F today · 16 d/yr by 30 yrs out
- Wind 2/10 Low
- Air quality 3/10 Moderate 1 unhealthy d/yr today · 3 by 30 yrs out
Nearby sold comps map
Loading sold comps map…
Walkable amenities ~0.75 mi
Loading nearby amenities…
Taxation est. · year 1
- Rental income
- $17,500
- − Mortgage interest
- −$9,971
- − Property taxes
- −$976
- − Insurance
- −$890
- − Repairs & maintenance
- −$1,400
- − Management
- −$1,400
- − Depreciation
- −$5,178
- Taxable loss
- −$2,315
- Est. tax savings @ 24.0%
- +$556
- After-tax cash flow
- $1,313/yr
For passive investors: Depreciation is non-cash, so a rental often shows a tax loss while cash-flowing — sheltering income. Rental losses are passive: they offset passive income freely, and up to $25,000/yr can offset ordinary (W-2) income if you actively participate and your MAGI is under $100k (phasing out to $0 by $150k); unused losses carry forward. On sale, claimed depreciation is recaptured at up to 25%, and gains may owe capital-gains tax (a 1031 exchange can defer both). Figures are a year-1 estimate at your 24.0% rate — not tax advice; consult a CPA.
Schools (NCES district)
- District
- Warsaw Community Schools
- NCES district ID
- 1812420
- Math proficiency
- 45% ▼ -4.00%
- Reading proficiency
- 49% ▬ 0.00%
- Median HH income
- $52,461
- Composite
- 40.53/100
- National rank
- #3705
- State rank
- #78 of 301 in IN
Livability — Warsaw
- Score
- 77/100
- State rank
- #42
- US rank
- #3114
Category grades
Schools grade is shown separately in the Schools card above.
Census & demographics
- County
- Kosciusko County · 36,398 people
- City population
- 36,398
- Metro
- Warsaw, IN
- Population (ZIP)
- 21,794
- Household income
- $71,687
- Rent vs Own
- Severe rent burden
- 374.0
Population outlook (Kosciusko County) Hauer SSP2
- Today (2025)
- 81,747 people
- By 2030
- 82,878 · +1.4%
- By 2040
- 84,270 · +3.1%
- By 2050
- 84,191 · +3.0%
- By 2075
- 82,918 · +1.4%
- By 2100
- 74,808 · -8.5%
Race, ethnicity, and origin ACS 2023
- Neighborhood character
- Predominantly White (83%)
- Race & ethnicity
- White 83% Hispanic / Latino 13% Two or more races 8%
- Hispanic origin (detail)
- Mexican 10% Puerto Rican 1%
- Common ancestry
- Italian 2% Iranian 1% Portuguese 1%
- Foreign-born
- 6% · Canada
- Languages at home
- 90% English-only · Spanish 9%
Political lean MEDSL · Kosciusko
- 2024 margin
- Solid R (+52.3) · D 22.9% · R 75.2% · Other 1.9%
- 2008→2024 swing
- -14.9pp toward R · 2008: -37.3pp · 2024: -52.3pp
- All cycles
- 2024: R+52.3 2020: R+50.7 2016: R+55.1 2012: R+52.2 2008: R+37.3
Not yet ingested
- Civics
- —
Market trends
- HPI YoY
- ▼ -67.41%
- Current HPI
- 283.1513
- Rent YoY
- —
- Metro
- Warsaw, IN
- State GDP YoY
- ▲ 2.90%
- F500 in state
- 18
Industry mix (Fortune 500 HQ in IN)
| Industry | F500 HQs | Revenue |
|---|---|---|
| Industrial Machinery | 2 | $37B |
|
||
| Healthcare | 1 | $177B |
|
||
| Pharmaceuticals | 1 | $45B |
|
||
| Metals / Steel | 1 | $18B |
|
||
| Agriculture | 1 | $17B |
|
||
| Packaging | 1 | $12B |
|
||
Price history
+223.6% since first listed4 events — show timeline
- 2026-06-17 Listed $178,000 IRMLS
- 2019-07-09 Sold (MLS) $109,000 IRMLS
- 2019-05-20 Listed $115,000 IRMLS
- 2010-03-25 Sold (Public Records) $55,000 Public Records
Property tax history
+16.2%/yrLatest (2024): $976 · +22.6% YoY. Source: county tax records.
Cash-flow waterfall
monthlySold comps — $/sqft
last 12 mo · ≤1 miLoading sold comps…