13560 SW 7th Pl · Davie, FL
Flood risk 1/10 · Minimal
- FEMA flood zone
- X (shaded)
- Chance of flooding over 30 yrs
- 0.0%
- Est. flood insurance / yr
- $507 – $1,088
Fire risk 1/10 · Minimal
- Est. fire insurance / yr
- $947 – $1,759
Heat risk 10/10 · Severe
- Hot days now (above 106°F)
- 7 days/yr
- Hot days in 30 yrs
- 27 days/yr
Wind risk 10/10 · Severe
- Chance of severe wind over 30 yrs
- 99.0%
Air-quality risk 3/10 · Minor
- Unhealthy air days now
- 2 days/yr
- Unhealthy air days in 30 yrs
- 3 days/yr
Risk factors via First Street. Map © Google.
Why this score? — see what drove the C grade
The composite is a weighted blend of 9 inputs, each scored 0–100. Each bar is that input's sub-score; the figure is the points it added to the 100-point composite (weight × sub-score).
- Cash flow +25.1/30.0
- DSCR +8.2/10.0
- ARV discount +7.5/15.0
- 1% rule +6.2/10.0
- Schools +4.1/10.0
- Livability +4.1/5.0
- Condition / age +2.5/5.0
- Rent growth +2.3/5.0
- Appreciation +0.0/10.0
$275,000
🖨 Deal sheet 📄 Offer letter ✓ Due diligence
Listing remarks
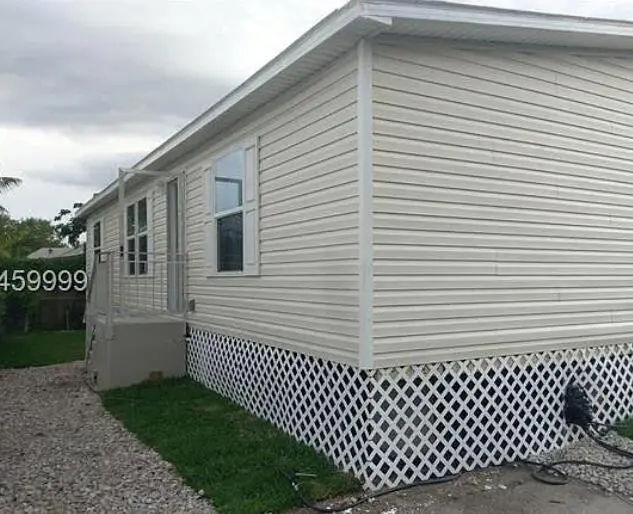
ALL AGES . .. NO HOA . .. YOU OWN THE LAND. .. 2018 DOUBLE WIDE MOBILE HOME 28X44. NEW APPLIANCES AND A/C. .. .RUBBER R400 ROOF. .. .. NEVER LEAK AND STAY PUT IN THE HURRICAINE. .. .. ALL INSPECTIONS MUST BE DONE BEFORE CONTRACT. .. OWNER/ PRIVATE FUNDING AVAILABLE WITH 30% DOWN ALL AGES . .. NO HOA . .. YOU OWN THE LAND. .. 2018 DOUBLE WIDE MOBILE HOME 28X44. NEW APPLIANCES AND A/C. .. .RUBBER R400 ROOF. .. .. NEVER LEAK AND STAY PUT IN THE HURRICAINE. .. .. ALL INSPECTIONS MUST BE DONE BEFORE CONTRACT. .. OWNER/ PRIVATE FUNDING AVAILABLE WITH 30% DOWN
Key facts
- New appliances
- Never leak
- No hoa
Tags
Property features AI
Finance
- Other: Property type: Mobile Home; Living area reported as 1,215 (builder source); Road maintained by public authority; Pets allowed (call for details)
Exterior
- Parking: Parking for 2 vehicles; Asphalt parking surface
- Utilities: Public water; Public sewer; 200+ amp electric service; Water connected; Sewer available
- Home design: Single-story mobile home; Double wide model (CLAYTON EXCITEMENT); Resale condition; Faces east
- Construction: Modular construction; Shingle roof; 44' x 28' (mobile length x width)
- Exterior features: First-floor entry; Skirt (other); Not waterfront
Interior
- Kitchen: Electric range; Refrigerator
- Bedrooms: 3 bedrooms on the main level
- Flooring: Laminate
- Bathrooms: 2 full bathrooms on the main level
- Heating & cooling: Central heating; Central air conditioning
- Interior features: Electric range and refrigerator; Unfurnished; Laminate flooring; Laundry area (other)
- Laundry & utility: Laundry area (other)
Neighborhood map
What this means for you Summary
Snapshot
- This is a 3-bed/2.0-bath manufactured listed at $275k.
Deal economics
- At list price, monthly cash flow is $607 ($7k/yr) — positive.
- The deal already cash-flows at list — no discount required.
- Meets the 1% rule at list price ($3k rent vs $275k).
- Recommended offer: $267k (3.0% below list) — sets the bar for market timing.
- Cap rate 8.9% vs local median 3.4% in Davie — top-decile yield for the area; either an underpriced asset or a hidden risk that comps aren't pricing in. Stress-test before assuming the spread holds.
Location & tenants
- Location reads 82/100 on livability (#68 in FL, #1,159 nationally) — a professional / high-income tenant draw. Strengths: crime A+, housing A+, health & safety A+; Watch: cost of living D, amenities D-.
- Broward (suburban): math 42% / reading 53% proficiency, ranked #46 of 73 in FL (top 63%) — families likely to look elsewhere, expect single-tenant / working-renter base with shorter leases.
- Zoned schools: Flamingo Elementary School (math 48% / reading 51%, grade D, #1,088 of 2,144 statewide, top 53%, 658 students, 62% FRL); Indian Ridge Middle School (math 55% / reading 60%, grade B, #157 of 571 statewide, top 28%, 2,020 students, 46% FRL); Western High School (math 43% / reading 60%, grade D+, #167 of 667 statewide, top 25%, 3,566 students, 43% FRL) — zoned schools at 50% FRL track the district average.
- Market conditions: Rents soft (-0.9%/yr); 176 active listings in the ZIP; 34 comparable units currently listed for rent nearby; rentals at typical pace (median 18d on market — plan ~3-4 weeks tenant-placement turnaround); solid renter incomes; 2,111 units permitted in Broward County in 2024 (1,265 in 5+ unit buildings).
- This rent runs 37% of the median local income ($101k/yr) — at the standard rent-burdened threshold; future hikes will face affordability resistance.
Forward outlook
- Local home prices are declining (-3.0%/yr); year-one equity from $2k of loan paydown is wiped out by about $8k of value loss. Plan a longer hold.
- Broward County population projected at +34% by 2050 — long-run rental-demand tailwind backs the buy-and-hold thesis.
Negotiation context
- It's been on market 45 days — a 3% lower offer ($267k) is reasonable based on typical stale-listing flexibility.
- 5 sale attempts since 2y ago with the ask held roughly flat each time — persistent listings suggest the price (not the market) is what's stuck; bring a comps-based counter.
- Current owner paid $6k; list at $275k implies a 4265% gain — meaningful room to come down on a strong offer.
Risks & watch-outs
- Climate carrying-cost: severe wind risk, 99% chance of damaging wind over 30y; extreme-heat days projected 7→27/yr by 2055 (HVAC capex compounding) — expect insurance premiums to compound above CPI over the hold.
Questions for the listing agent
- It's been on market 45 days. Have you received any prior offers? Is the seller open to a 3% concession, seller financing, or rate buy-down credit?
- Is there a deadline driving the sale (1031 exchange, divorce, estate, relocation)? That informs how much negotiation room exists.
- Schools are A-rated — typically a magnet for longer-tenancy family renters. What's the average tenant stay here, and is there a school-zone premium baked into asking?
- What's the average days-on-market for RENTAL listings here right now (not sales)? A rising rental-DOM trend means longer vacancies and softer asking-rent achievability than the comps imply.
- What's the recent tenant-quality profile in this submarket — average credit score on applications, eviction rate, late-payment / NSF rate, and stable-employment percentage? A property-management company in the area should have these aggregated.
- How much new for-sale + rental construction is in the pipeline within 1–3 miles? Heavy new supply typically softens prices + rents 12–24 months out; constrained supply supports both.
Investment metrics
- 1% rule
- 1.12% ✓
- Cap rate
- 8.94%
- Cash-on-cash
- 9.46%
- DSCR
- 1.42
- GRM
- 7.5
CMA / ARV
No comps found within radius.
Projected returns pro-forma
-3.0% appreciation · 0.0% rent growth · sell at horizon
- IRR
- -5.4%
- Equity multiple
- 0.81×
- Total profit
- $-14,898
- Equity at exit
- $41,003
- IRR
- 0.4%
- Equity multiple
- 1.03×
- Total profit
- $2,002
- Equity at exit
- $23,777
Cash invested: $77,000 (down + closing). Projections, not guarantees.
Landlord ↔ Tenant lean methodology
- Overall (STATE)
- 87 Strongly Landlord-Friendly
- State Florida
- 87 Strongly Landlord-Friendly · R+3
- County
- — inherits STATE
- City
- — inherits STATE
ZIP-level market 33325
- Rents YoY
- -0.9%
- Active inventory
- 176
- Price-to-rent
- 7.5×
Monthly cashflow live
- Estimated rent
- $3,074 high interval (Pro) →
- Mortgage (P&I)
- −$1,442
- Tax from tax record
- −$265 /mo · $3,175/yr
- Insurance
- −$115
- HOA
- −$0
- Vacancy / Maint / Mgmt
- −$646
- Net cashflow
- $607
Break-even live
UW: 25.0% down · 7.5% · 30yr · 1.5% tax · 5.0% vac · 8.0% maint · 8.0% mgmt
Financing live
Cash to close
- Down payment
- $68,750
- Closing costs
- $8,250
- Reserves months
- —
- Total cash needed
- —
Loan-product check · same deal, 3 products live
Conventional
25% down · 7.5% · 30yr
- Down + closing
- —
- Monthly P&I
- —
- Monthly cashflow
- —
- DSCR
- —
- Eligible?
- —
Personal DTI + credit; lowest rate.
DSCR
20% down · 8.5% · 30yr
- Down + closing
- —
- Monthly P&I
- —
- Monthly cashflow
- —
- DSCR
- —
- Eligible?
- —
No personal income docs; deal must DSCR.
Hard money
10% down · 12.0% · 12mo
- Down + closing
- —
- Monthly P&I
- —
- Monthly cashflow
- —
- DSCR
- —
- Eligible?
- —
Short-term bridge; refi at stabilization.
Rent comps 34 comps
| Address | Beds | Baths | Sqft | Rent | $/sqft | DOM | Units | Dist |
|---|---|---|---|---|---|---|---|---|
| 651 Shiloh Ter Unit 651 Davie, FL | 3.0 | 2.0 | 1249 | $4,700 | $3.76 | 24d | 1 | 0.23mi |
| 13761 Newport Mnr Davie, FL | 3.0 | 2.0 | 1249 | $3,500 | $2.80 | 24d | 1 | 0.26mi |
| 14025 Langley Pl Davie, FL | 3.0 | 2.0 | 1360 | $3,250 | $2.39 | 13d | 1 | 0.54mi |
| 14025 Langley Pl Davie, FL | 3.0 | 2.0 | 1360 | $3,250 | $2.39 | 14d | 1 | 0.54mi |
| 118 Riverwalk Cir Sunrise, FL | 3.0 | 2.5 | 1447 | $3,100 | $2.14 | 24d | 1 | 0.73mi |
| 200 Commodore Dr Plantation, FL | 3.0 | 2.0 | 1124 | $3,014 | $2.68 | 24d | 1 | 0.84mi |
| 200 Commodore Dr Plantation, FL | 3.0 | 2.0 | 1124 | $2,913 | $2.59 | 20d | 1 | 0.84mi |
| 200 Commodore Dr Plantation, FL | 2.0 | 2.0 | 1078 | $2,743 | $2.54 | 22d | 1 | 0.84mi |
| 13500 NW 3rd St Plantation, FL | 1.0–3.0 | 1.0–2.5 | 1099 | $3,725 | $3.39 | 2d | 21 | 0.85mi |
| 1631 SW 129th Way Davie, FL | 3.0 | 2.0 | 1189 | $3,700 | $3.11 | 5d | 1 | 0.92mi |
| 400 Commodore Dr #308 Plantation, FL | 2.0 | 2.5 | 1296 | $2,400 | $1.85 | 5d | 1 | 0.96mi |
| 430 Commodore Dr Unit 430 Plantation, FL | 2.0 | 2.5 | 1296 | $2,400 | $1.85 | 5d | 1 | 1.01mi |
| 430 Commodore Dr #210 Plantation, FL | 2.0 | 2.0 | 1130 | $2,100 | $1.86 | 24d | 1 | 1.01mi |
| 13755 SW 20th St Davie, FL | 2.0 | 2.0 | 864 | $2,500 | $2.89 | 24d | 1 | 1.02mi |
| 701 SW 148th Ave Davie, FL | 3.0 | 3.0 | 1285 | $2,500 | $1.95 | 24d | 1 | 1.05mi |
| 705 SW 148th Ave #213 Davie, FL | 3.0 | 3.0 | 1409 | $2,300 | $1.63 | 17d | 1 | 1.05mi |
| 781 SW 148th Ave Davie, FL | 3.0 | 3.0 | 1285 | $2,675 | $2.08 | 24d | 2 | 1.06mi |
| 781 SW 148th Ave Davie, FL | 1.0–3.0 | 1.0–3.0 | 1176 | $2,750 | $2.34 | 15d | 3 | 1.06mi |
| 785 SW 148th Ave #1406 Davie, FL | 3.0 | 3.0 | 1285 | $2,550 | $1.98 | 24d | 1 | 1.06mi |
| 721 SW 148th Ave Davie, FL | 2.0 | 2.0–3.0 | 1138 | $2,700 | $2.37 | 24d | 2 | 1.07mi |
| 735 SW 148th Ave Davie, FL | 3.0 | 3.0 | 1285 | $2,575 | $2.00 | 24d | 2 | 1.07mi |
| 741 SW 148th Ave #705 Davie, FL | 2.0 | 2.0 | 1064 | $2,395 | $2.25 | 5d | 1 | 1.08mi |
| 741 SW 148th Ave Davie, FL | 2.0 | 2.0 | 1064 | $2,348 | $2.21 | 11d | 2 | 1.08mi |
| 741 SW 148th Ave Davie, FL | 2.0 | 2.0 | 1064 | $2,348 | $2.21 | 5d | 2 | 1.08mi |
| 761 SW 148th Ave #915 Davie, FL | 2.0 | 2.0 | 1034 | $2,490 | $2.41 | 19d | 1 | 1.08mi |
| 761 SW 148th Ave #915 Davie, FL | 2.0 | 2.0 | 1034 | $2,380 | $2.30 | 17d | 1 | 1.08mi |
| 711 SW 148th Ave Davie, FL | 3.0 | 3.0 | 1347 | $2,720 | $2.02 | 8d | 2 | 1.09mi |
| 711 SW 148th Ave Davie, FL | 3.0 | 3.0 | 1347 | $2,750 | $2.04 | 14d | 3 | 1.09mi |
| 715 SW 148th Ave #611 Davie, FL | 2.0 | 1.0 | 1068 | $2,250 | $2.11 | 8d | 1 | 1.09mi |
| 715 SW 148th Ave #611 Davie, FL | 2.0 | 1.0 | 1068 | $2,250 | $2.11 | 13d | 1 | 1.09mi |
| 771 SW 148th Ave #1305 Davie, FL | 2.0 | 1.0 | 1068 | $2,250 | $2.11 | 2d | 1 | 1.09mi |
| 745 SW 148th Ave #815 Davie, FL | 2.0 | 2.0 | 1034 | $2,425 | $2.35 | 24d | 1 | 1.12mi |
| 751 SW 148th Ave Davie, FL | 2.0–3.0 | 2.0–3.0 | 1123 | $2,775 | $2.47 | 24d | 3 | 1.14mi |
| 13060 Vista Isles Dr #222 Plantation, FL | 2.0 | 1.0 | 965 | $2,100 | $2.18 | 8d | 1 | 1.46mi |
Listing history 19 events
-
2026-06-13statusdays on market $275,000 Pending 45 DOM
-
2026-06-09days on market $275,000 Active 42 DOM
-
2026-06-08days on market $275,000 Active 41 DOM
-
2026-06-07days on market $275,000 Active 40 DOM
-
2026-06-04days on market $275,000 Active 37 DOM
-
2026-06-03days on market $275,000 Active 36 DOM
-
2026-06-02days on market $275,000 Active 35 DOM
-
2026-06-01days on market $275,000 Active 34 DOM
-
2026-05-31days on market $275,000 Active 33 DOM
-
2026-05-22status Active
-
2026-05-19status Pending
-
2026-04-25$275,000 Active
-
2026-03-25$1,947
-
2026-03-24historical $1,947
-
2026-03-14$1,947
-
2024-05-07historical $1,997
-
2024-03-31price $1,997
-
2024-03-19$2,175
-
1991-01-31soldstatus $6,300
ⓘ Source: listings_history table (triggers on properties + properties_extension) + one-shot
backfill from property_details.listing_events for pre-trigger history.
Tax reassessment forecast FL · Resets to sale price
- Current annual tax
- $3,175 · $265/mo
- Projected year-2 tax
- $3,175 · $265/mo
- Expected delta
- $0/yr ($0/mo · 0.0%)
ⓘ Screening estimate from a state-policy table — verify with the county assessor before closing.
Climate risk First Street
- Flood 1/10 Low FEMA zone X (shaded) · 0% chance over 30 yrs
- Wildfire 1/10 Low
- Heat 10/10 Extreme 7 d/yr ≥106°F today · 27 d/yr by 30 yrs out
- Wind 10/10 Extreme 99% chance of damaging wind over 30 yrs
- Air quality 3/10 Moderate 2 unhealthy d/yr today · 3 by 30 yrs out
Nearby sold comps map
Loading sold comps map…
Walkable amenities ~0.75 mi
Loading nearby amenities…
Taxation est. · year 1
- Rental income
- $36,889
- − Mortgage interest
- −$15,404
- − Property taxes
- −$3,175
- − Insurance
- −$1,375
- − Repairs & maintenance
- −$2,951
- − Management
- −$2,951
- − Depreciation
- −$8,000
- Taxable income
- $3,033
- Est. tax owed @ 24.0%
- −$728
- After-tax cash flow
- $6,559/yr
For passive investors: Depreciation is non-cash, so a rental often shows a tax loss while cash-flowing — sheltering income. Rental losses are passive: they offset passive income freely, and up to $25,000/yr can offset ordinary (W-2) income if you actively participate and your MAGI is under $100k (phasing out to $0 by $150k); unused losses carry forward. On sale, claimed depreciation is recaptured at up to 25%, and gains may owe capital-gains tax (a 1031 exchange can defer both). Figures are a year-1 estimate at your 24.0% rate — not tax advice; consult a CPA.
Schools (NCES district)
- District
- Broward
- NCES district ID
- 1200180
- Math proficiency
- 42% ▼ -18.00%
- Reading proficiency
- 53% ▼ -5.00%
- Median HH income
- $52,139
- Composite
- 40.88/100
- National rank
- #3621
- State rank
- #46 of 73 in FL
Livability — Davie
- Score
- 82/100
- State rank
- #68
- US rank
- #1159
Category grades
Schools grade is shown separately in the Schools card above.
Census & demographics
- Census place
- Davie, FL
- County
- Broward County · 1,963,430 people
- City population
- 92,317
- Metro
- Miami-Fort Lauderdale-Pompano Beach, FL
- Population (ZIP)
- 32,399
- Household income
- $100,553
- Rent vs Own
- Severe rent burden
- 924.0
Population outlook (Broward County) Hauer SSP2
- Today (2025)
- 2,207,033 people
- By 2030
- 2,360,704 · +7.0%
- By 2040
- 2,661,208 · +20.6%
- By 2050
- 2,946,698 · +33.5%
- By 2075
- 3,602,273 · +63.2%
- By 2100
- 3,970,984 · +79.9%
Race, ethnicity, and origin ACS 2023
- Neighborhood character
- Diverse neighborhood (Simpson 0.62)
- Race & ethnicity
- Hispanic / Latino 51% White 33% Two or more races 31% Black 6% Asian 3%
- Hispanic origin (detail)
- Mexican 3% Puerto Rican 8% Cuban 9% Dominican 1% Salvadoran 1%
- Common ancestry
- Italian 3% Romanian 1% Scotch-Irish 1%
- Foreign-born
- 35% · Canada, Jamaica, Dominican Republic
- Languages at home
- 49% English-only · Spanish 46% Other Indo-European 2% French/Haitian/Cajun 2%
Political lean MEDSL · Broward
- 2024 margin
- D (+17.0) · D 58.0% · R 41.0%
- 2008→2024 swing
- -17.8pp toward R · 2008: 34.7pp · 2024: 17.0pp
- All cycles
- 2024: D+17.0 2020: D+29.8 2016: D+35.0 2012: D+34.9 2008: D+34.7
Not yet ingested
- Civics
- —
Market trends
- HPI YoY
- ▼ -437.64%
- Current HPI
- 385.1467
- Rent YoY
- ▼ -0.88%
- Metro
- Miami-Fort Lauderdale-Pompano Beach, FL
- State GDP YoY
- ▲ 3.28%
- F500 in state
- 36
Industry mix (Fortune 500 HQ in FL)
| Industry | F500 HQs | Revenue |
|---|---|---|
| Industrial Technology | 2 | $29B |
|
||
| Insurance | 2 | $17B |
|
||
| Retail | 1 | $60B |
|
||
| Technology Distribution | 1 | $58B |
|
||
| Homebuilding | 1 | $35B |
|
||
| Technology Manufacturing | 1 | $35B |
|
||
Price history
+4265.1% since first listed10 events — show timeline
- 2026-05-22 Relisted — Beaches MLS
- 2026-05-19 Pending — Beaches MLS
- 2026-04-25 Listed $275,000 Beaches MLS
- 2026-03-25 Listed for Rent $1,947 RMLSFL
- 2026-03-24 Rental Removed $1,947 GFLMLS
- 2026-03-14 Listed for Rent $1,947 GFLMLS
- 2024-05-07 Rental Removed $1,997 GFLMLS
- 2024-03-31 Price Changed $1,997 GFLMLS
- 2024-03-19 Listed for Rent $2,175 GFLMLS
- 1991-01-31 Sold (Public Records) $6,300 Public Records
Property tax history
+7.5%/yrLatest (2025): $3,175 · +9.4% YoY. Source: county tax records.
Cash-flow waterfall
monthlySold comps — $/sqft
last 12 mo · ≤1 miLoading sold comps…