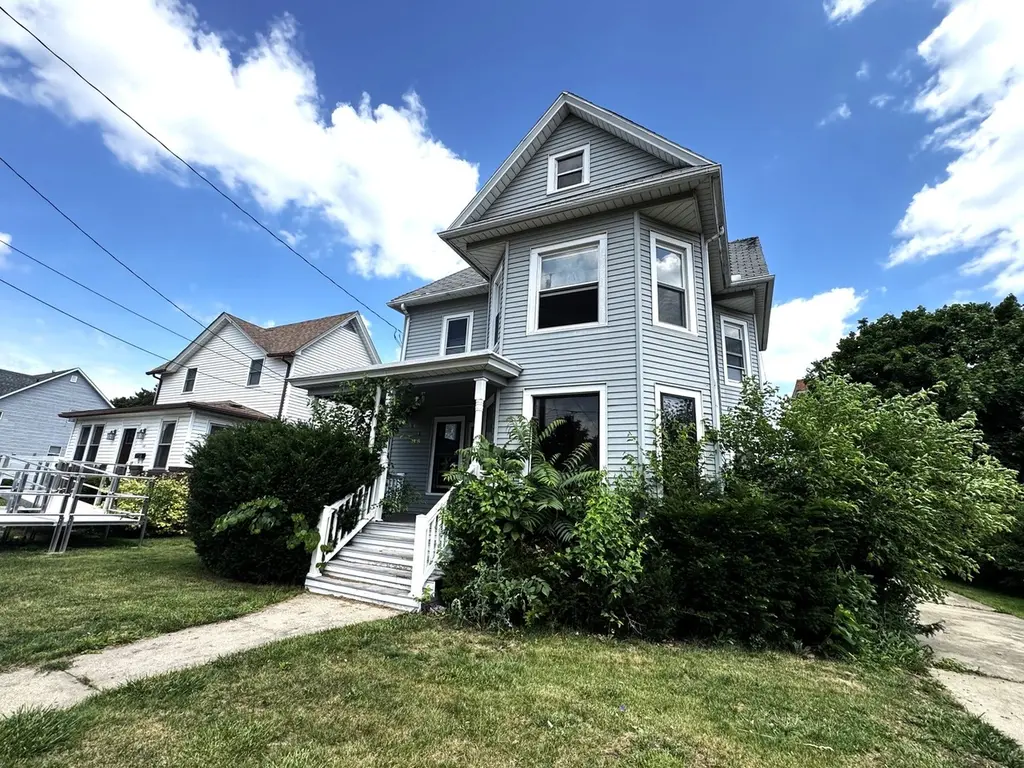
412 Rockwell St · Kewanee, IL
Flood risk 1/10 · Minimal
- FEMA flood zone
- X (unshaded)
- Chance of flooding over 30 yrs
- 0.0%
- Est. flood insurance / yr
- $473 – $860
Fire risk 1/10 · Minimal
- Est. fire insurance / yr
- $804 – $1,492
Heat risk 3/10 · Minor
- Hot days now (above 103°F)
- 7 days/yr
- Hot days in 30 yrs
- 17 days/yr
Wind risk 2/10 · Minimal
- Chance of severe wind over 30 yrs
- —
Air-quality risk 3/10 · Minor
- Unhealthy air days now
- 2 days/yr
- Unhealthy air days in 30 yrs
- 3 days/yr
Risk factors via First Street. Map © Google.
Why this score? — see what drove the B grade
The composite is a weighted blend of 9 inputs, each scored 0–100. Each bar is that input's sub-score; the figure is the points it added to the 100-point composite (weight × sub-score).
- Cash flow +27.5/30.0
- ARV discount +15.0/15.0
- DSCR +9.7/10.0
- 1% rule +9.5/10.0
- Livability +3.5/5.0
- Rent growth +2.5/5.0
- Condition / age +2.5/5.0
- Schools +1.2/10.0
- Appreciation +0.0/10.0
$85,000
🖨 Deal sheet (PDF) 📄 Offer letter ✓ Due diligence
Listing remarks
A spacious 3 bedroom, 2 bath home that is full of character and potential. This property features a versatile 2nd living room on the main level that could serve as a 4th bedroom, game room, hobby space, or home office. The property also features 2-car detached garage, large enclosed rear porch, bay windows, and beautiful wood work that is ready to be restored. With the right vision, updates, and repairs, this property has the potential to be transformed into a truly stunning home. Sold as-is.
Key facts
- Wood work
- Enclosed rear porch
- Bay windows
Tags
Property features AI
Finance
- Other: Possession at closing
- HOA & community: No master association fee required
Exterior
- Parking: Detached garage owned; Concrete parking; Total 2 parking spaces (2 garage spaces)
- Utilities: Public water service; Public sewer service
- Home design: Detached single-family home; Two-story design; Fee simple ownership; Property over 100 years old; Vinyl siding
- Construction: Vinyl siding construction; Built before 1978
- Exterior features: Enclosed porch on main level (9 x 26); Lot dimensions approximately 58 x 144; Lot smaller than 0.25 acre; Public water; Public sewer
Interior
- Kitchen: Kitchen on main level (20 x 12)
- Bedrooms: Three bedrooms total; Master bedroom on second level (13 x 13); Second bedroom on second level (13 x 13); Third bedroom on second level (12 x 10); Attic on third level (20 x 14)
- Bathrooms: Two full bathrooms
- Heating & cooling: Natural gas heating
- Interior features: Eight total rooms; Unfinished full basement; Separate dining room
- Laundry & utility: Laundry room
Neighborhood map
What this means for you Summary
Snapshot
- This is a 3-bed/1.0-bath single-family listed at $85k.
Deal economics
- At list price, monthly cash flow is $252 ($3k/yr) — positive.
- The deal already cash-flows at list — no discount required.
- Meets the 1% rule at list price ($1k rent vs $85k).
Location & tenants
- Location reads 69/100 on livability (#409 in IL) — a middle-class / working-renter tenant base. Strengths: cost of living A+, health & safety A+, housing A; Watch: schools F, crime D-, amenities F.
- Kewanee CUSD 229 (town): math 8% / reading 20% proficiency, ranked #540 of 620 in IL (top 87%) — low school quality limits family demand, transient renter base, plan for 1-2y turnover; 73% free/reduced lunch — lower-income household profile, screen leases tightly.
- Market conditions: 39 active listings in the ZIP; 32 units permitted in Henry County in 2024 (0 in 5+ unit buildings).
Forward outlook
- Local home prices are declining (-3.0%/yr); year-one equity from $588 of loan paydown is wiped out by about $3k of value loss. Plan a longer hold.
- Henry County population projected at -16% by 2050 — secular population decline; favor cash flow + early exit over multi-decade hold.
- At projected returns (-3.0% appreciation + 3.0% rent growth), your $24k cash investment doubles in ~9 years — after that, you're playing with house money.
Negotiation context
- Only 7 days on market — expect competitive offers; lowballing is unlikely to land.
Risks & watch-outs
- Watch-outs: property tax is 3.3% of price; built in 1895 — expect roof / HVAC / electrical / plumbing capex.
Questions for the listing agent
- Built in 1895 — when were the roof, HVAC, electrical panel, plumbing, and water heater last replaced?
- Property tax is high relative to price — has the assessment been appealed recently, and will the sale trigger a re-assessment?
- Is there a deadline driving the sale (1031 exchange, divorce, estate, relocation)? That informs how much negotiation room exists.
- Schools are F-rated, which usually means shorter tenancies and higher turnover. Who's the typical renter profile here, and what's been the actual vacancy rate?
- Crime grade is D in this area — have there been break-ins, vandalism, or insurance claims at this property in the last 3 years? What carrier currently insures it and at what premium?
- What's the average days-on-market for RENTAL listings here right now (not sales)? A rising rental-DOM trend means longer vacancies and softer asking-rent achievability than the comps imply.
- What's the recent tenant-quality profile in this submarket — average credit score on applications, eviction rate, late-payment / NSF rate, and stable-employment percentage? A property-management company in the area should have these aggregated.
- How much new for-sale + rental construction is in the pipeline within 1–3 miles? Heavy new supply typically softens prices + rents 12–24 months out; constrained supply supports both.
Investment metrics
- 1% rule
- 1.45% ✓
- Cap rate
- 9.85%
- Cash-on-cash
- 12.72%
- DSCR
- 1.57
- GRM
- 5.8
CMA / ARV
- ARV (on-the-fly)
- $117,648
- Comps found
- 12
Show comp detail 12 sales within ~0.75 mi
| Address | Dist | Beds/Ba | Sqft | Sold | Price | $/sf | Match |
|---|---|---|---|---|---|---|---|
| 516 W Prospect St | 0.11mi | 3/1.0 | 1,548 (0%) | 8mo | $75,000 | $48 | 89 |
| 837 Beach St | 0.26mi | 3/1.5 | 1,639 (+6%) | 4mo | $120,000 | $73 | 73 |
| 300 Beach St | 0.52mi | 3/1.5 | 1,577 (+2%) | 6mo | $157,500 | $100 | 66 |
| 328 E Prospect St | 0.55mi | 3/1.0 | 1,443 (-7%) | 2mo | $110,000 | $76 | 62 |
| 337 Whitney Ave | 0.58mi | 3/1.0 | 1,656 (+7%) | 1mo | $141,299 | $85 | 60 |
| 1231 Western Ave | 0.64mi | 4/1.0 (+1) | 1,568 (+1%) | 4mo | $13,000 | $8 | 60 |
| 613 Roosevelt Ave | 0.70mi | 3/1.5 | 1,560 (+1%) | 6mo | $150,000 | $96 | 59 |
| 237 Birch Pl | 0.58mi | 3/2.0 | 1,440 (-7%) | 0mo | $240,000 | $167 | 57 |
| 1111 Pine St | 0.48mi | 2/1.0 (-1) | 1,360 (-12%) | 2mo | $34,000 | $25 | 51 |
| 418 E Division St | 0.61mi | 3/2.0 | 1,684 (+9%) | 5mo | $125,000 | $74 | 49 |
| 206 Roosevelt Ave | 0.40mi | 2/1.5 (-1) | 1,317 (-15%) | 6mo | $112,000 | $85 | 45 |
| 407 Ross St | 0.74mi | 3/1.0 | 1,779 (+15%) | 6mo | $74,000 | $42 | 35 |
Match score weights: distance 35% · size 25% · config 20% · recency 20%. Top-matched comps best support the ARV.
Projected returns pro-forma
-3.0% appreciation · 3.0% rent growth · sell at horizon
- IRR
- 2.6%
- Equity multiple
- 1.10×
- Total profit
- $2,388
- Equity at exit
- $12,674
- IRR
- 12.3%
- Equity multiple
- 1.97×
- Total profit
- $23,164
- Equity at exit
- $7,349
Cash invested: $23,800 (down + closing). Projections, not guarantees.
Landlord ↔ Tenant lean methodology
- Overall (STATE)
- 43 Moderately Tenant-Leaning
- State Illinois
- 43 Moderately Tenant-Leaning · D+7
- County
- — inherits STATE
- City
- — inherits STATE
ZIP-level market 61443
- Active inventory
- 39
- Price-to-rent
- 5.8×
Monthly cashflow live
- Estimated rent
- $1,228 medium interval (Pro) →
- Mortgage (P&I)
- −$446
- Tax from tax record
- −$237 /mo · $2,844/yr
- Insurance
- −$35
- HOA
- −$0
- Vacancy / Maint / Mgmt
- −$258
- Net cashflow
- $252
Break-even live
Sensitivity live
| Price | -10% $300 | -5% $276 | +0% $252 | +5% $228 | +10% $204 |
|---|---|---|---|---|---|
| Rent | -10% $155 | -5% $204 | +0% $252 | +5% $301 | +10% $349 |
| Rate | -1.0pp $295 | -0.5pp $274 | base $252 | +0.5pp $230 | +1.0pp $208 |
UW: 25.0% down · 7.5% · 30yr · 1.5% tax · 5.0% vac · 8.0% maint · 8.0% mgmt
Financing live
Cash to close
- Down payment
- $21,250
- Closing costs
- $2,550
- Reserves months
- —
- Total cash needed
- —
Loan-product check · same deal, 3 products live
Conventional
25% down · 7.5% · 30yr
- Down + closing
- —
- Monthly P&I
- —
- Monthly cashflow
- —
- DSCR
- —
- Eligible?
- —
Personal DTI + credit; lowest rate.
DSCR
20% down · 8.5% · 30yr
- Down + closing
- —
- Monthly P&I
- —
- Monthly cashflow
- —
- DSCR
- —
- Eligible?
- —
No personal income docs; deal must DSCR.
Hard money
10% down · 12.0% · 12mo
- Down + closing
- —
- Monthly P&I
- —
- Monthly cashflow
- —
- DSCR
- —
- Eligible?
- —
Short-term bridge; refi at stabilization.
Listing history 7 events
-
2026-06-18days on market $85,000 Active 7 DOM
-
2026-06-17days on market $85,000 Active 6 DOM
-
2026-06-16days on market $85,000 Active 5 DOM
-
2026-06-15days on market $85,000 Active 4 DOM
-
2026-06-13days on market $85,000 Active 2 DOM
-
2026-06-12remarks 497-char remark
-
2026-06-12$85,000 Active 1 DOM
ⓘ Source: listings_history table (triggers on properties + properties_extension) + one-shot
backfill from property_details.listing_events for pre-trigger history.
Tax reassessment forecast IL · Partial reset (capped growth)
- Current annual tax
- $2,844 · $237/mo
- Projected year-2 tax
- $2,844 · $237/mo
- Expected delta
- $0/yr ($0/mo · 0.0%)
ⓘ Screening estimate from a state-policy table — verify with the county assessor before closing.
Climate risk First Street
- Flood 1/10 Low FEMA zone X (unshaded) · 0% chance over 30 yrs
- Wildfire 1/10 Low
- Heat 3/10 Moderate 7 d/yr ≥103°F today · 17 d/yr by 30 yrs out
- Wind 2/10 Low
- Air quality 3/10 Moderate 2 unhealthy d/yr today · 3 by 30 yrs out
Nearby sold comps map
Loading sold comps map…
Walkable amenities ~0.75 mi
Loading nearby amenities…
Taxation est. · year 1
- Rental income
- $14,740
- − Mortgage interest
- −$4,761
- − Property taxes
- −$2,844
- − Insurance
- −$425
- − Repairs & maintenance
- −$1,179
- − Management
- −$1,179
- − Depreciation
- −$2,473
- Taxable income
- $1,878
- Est. tax owed @ 24.0%
- −$451
- After-tax cash flow
- $2,576/yr
For passive investors: Depreciation is non-cash, so a rental often shows a tax loss while cash-flowing — sheltering income. Rental losses are passive: they offset passive income freely, and up to $25,000/yr can offset ordinary (W-2) income if you actively participate and your MAGI is under $100k (phasing out to $0 by $150k); unused losses carry forward. On sale, claimed depreciation is recaptured at up to 25%, and gains may owe capital-gains tax (a 1031 exchange can defer both). Figures are a year-1 estimate at your 24.0% rate — not tax advice; consult a CPA.
Schools (NCES district)
- District
- Kewanee CUSD 229
- NCES district ID
- 1721000
- Math proficiency
- 8% ▼ -8.00%
- Reading proficiency
- 20% ▼ -12.00%
- Median HH income
- $38,294
- Composite
- 11.77/100
- National rank
- #9682
- State rank
- #540 of 620 in IL
Livability — Kewanee
- Score
- 69/100
- State rank
- #409
- US rank
- #8423
Category grades
Schools grade is shown separately in the Schools card above.
Census & demographics
- Census place
- Kewanee, IL
- Population (ZIP)
- 13,529
Population outlook (Henry County) Hauer SSP2
- Today (2025)
- 47,376 people
- By 2030
- 45,920 · -3.1%
- By 2040
- 42,829 · -9.6%
- By 2050
- 39,606 · -16.4%
- By 2075
- 31,848 · -32.8%
- By 2100
- 23,503 · -50.4%
Race, ethnicity, and origin ACS 2023
- Neighborhood character
- Predominantly White (79%)
- Race & ethnicity
- White 79% Hispanic / Latino 11% Black 6% Two or more races 5%
- Hispanic origin (detail)
- Mexican 9% Puerto Rican 1%
- Common ancestry
- Romanian 4% English 3% Italian 3%
- Foreign-born
- 3% · Canada
- Languages at home
- 92% English-only · Spanish 7%
Political lean MEDSL · Henry
- 2024 margin
- Strong R (+24.5) · D 36.8% · R 61.3% · Other 1.9%
- 2008→2024 swing
- -32.2pp toward R · 2008: 7.7pp · 2024: -24.5pp
- All cycles
- 2024: R+24.5 2020: R+21.4 2016: R+21.2 2012: D+3.1 2008: D+7.7
Not yet ingested
- Civics
- —
Market trends
- HPI YoY
- ▼ -68.32%
- Current HPI
- 121.8672
- Rent YoY
- —
- Metro
- —
- State GDP YoY
- ▲ 1.59%
- F500 in state
- 60
Industry mix (Fortune 500 HQ in IL)
| Industry | F500 HQs | Revenue |
|---|---|---|
| Insurance | 4 | $201B |
|
||
| Consumer Goods | 4 | $87B |
|
||
| Industrial Machinery | 3 | $64B |
|
||
| Healthcare | 2 | $55B |
|
||
| Retail / Pharmacy | 1 | $148B |
|
||
| Agriculture / Food | 1 | $86B |
|
||
Price history
-8.1% since first listed2 events — show timeline
- 2026-06-11 Listed $85,000 MRED as Distributed by MLS Grid
- 2022-11-15 Sold (Public Records) $92,500 Public Records
Property tax history
+26.3%/yrLatest (2025): $2,844 · +5.2% YoY. Source: county tax records.
Cash-flow waterfall
monthlySold comps — $/sqft
last 12 mo · ≤1 miLoading sold comps…