79 Teds Dr · Franklin, PA
Flood risk 1/10 · Minimal
- FEMA flood zone
- X (unshaded)
- Chance of flooding over 30 yrs
- 0.0%
- Est. flood insurance / yr
- $473 – $860
Fire risk 3/10 · Minor
- Est. fire insurance / yr
- $511 – $949
Heat risk 4/10 · Minor
- Hot days now (above 98°F)
- 7 days/yr
- Hot days in 30 yrs
- 15 days/yr
Wind risk 2/10 · Minimal
- Chance of severe wind over 30 yrs
- 3.0%
Air-quality risk 2/10 · Minimal
- Unhealthy air days now
- 1 days/yr
- Unhealthy air days in 30 yrs
- 2 days/yr
Risk factors via First Street. Map © Google.
Why this score? — see what drove the B grade
The composite is a weighted blend of 9 inputs, each scored 0–100. Each bar is that input's sub-score; the figure is the points it added to the 100-point composite (weight × sub-score).
- Cash flow +30.0/30.0
- 1% rule +10.0/10.0
- DSCR +10.0/10.0
- ARV discount +7.5/15.0
- Schools +4.1/10.0
- Livability +3.5/5.0
- Rent growth +2.5/5.0
- Condition / age +2.5/5.0
- Appreciation +0.0/10.0
$55,000
🖨 Deal sheet 📄 Offer letter ✓ Due diligence
Listing remarks
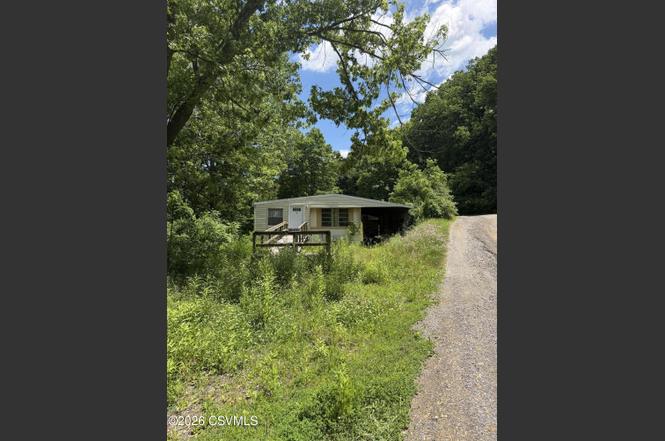
Looking for a project with space? This property offers just over an acre of land, giving you the perfect canvas to build, renovate, or clear and start fresh. The mobile home currently on-site is in rough shape and needs significant work. It is being sold strictly as-is, where-is, with all current contents included. The seller will not be making any repairs, removing items, or clearing out the home or yard--what you see is what you get, which is reflected in the price. This is an investor special or a blank slate for anyone handy looking for cheap acreage. Cash buyers please. Please Note: Because of the home's current condition and the contents remaining on-site, please use caution when walk
Key facts
- Mobile home
- Blank slate
- Acre of land
Tags
Property features AI
Exterior
- Parking: One garage space; Two additional parking spaces
- Utilities: Well water
- Home design: Mobile home (residential)
- Construction: Metal siding; Vinyl siding; No foundation specified; Built as a single-story (mobile home)
- Exterior features: Metal roof; Lot is approximately 1.28 acres; Topography: No
Interior
- Kitchen: Refrigerator
- Bedrooms: Two main-level bedrooms
- Bathrooms: One three-quarter bathroom
- Heating & cooling: Has heating
- Interior features: Refrigerator included; No basement
Neighborhood map
What this means for you Summary
Snapshot
- This is a 2-bed/1.0-bath manufactured listed at $55k.
Deal economics
- At list price, monthly cash flow is $317 ($4k/yr) — positive.
- The deal already cash-flows at list — no discount required.
- Meets the 1% rule at list price ($904 rent vs $55k).
- Cap rate 13.2% vs local median 4.8% in Franklin — top-decile yield for the area; either an underpriced asset or a hidden risk that comps aren't pricing in. Stress-test before assuming the spread holds.
Location & tenants
- Location reads 69/100 on livability (#812 in PA) — a middle-class / working-renter tenant base. Strengths: cost of living A+, housing A+, crime B+; Watch: health & safety C-, schools D, employment D.
- Midd-West SD (rural): math 41% / reading 55% proficiency, ranked #225 of 539 in PA (top 42%) — families likely to look elsewhere, expect single-tenant / working-renter base with shorter leases.
- Market conditions: 11 active listings in the ZIP; 48 units permitted in Snyder County in 2024 (0 in 5+ unit buildings).
Forward outlook
- Local home prices are declining (-3.0%/yr); year-one equity from $380 of loan paydown is wiped out by about $2k of value loss. Plan a longer hold.
- Snyder County population projected at +3% by 2050 — modest demand growth; plan on rents tracking national, not racing it.
- At projected returns (-3.0% appreciation + 3.0% rent growth), your $15k cash investment doubles in ~5 years — after that, you're playing with house money.
Negotiation context
- Only 1 days on market — expect competitive offers; lowballing is unlikely to land.
Questions for the listing agent
- Built in 1960 — when were the roof, HVAC, electrical panel, plumbing, and water heater last replaced?
- Is there a deadline driving the sale (1031 exchange, divorce, estate, relocation)? That informs how much negotiation room exists.
- Schools are D-rated, which usually means shorter tenancies and higher turnover. Who's the typical renter profile here, and what's been the actual vacancy rate?
- What's the average days-on-market for RENTAL listings here right now (not sales)? A rising rental-DOM trend means longer vacancies and softer asking-rent achievability than the comps imply.
- What's the recent tenant-quality profile in this submarket — average credit score on applications, eviction rate, late-payment / NSF rate, and stable-employment percentage? A property-management company in the area should have these aggregated.
- How much new for-sale + rental construction is in the pipeline within 1–3 miles? Heavy new supply typically softens prices + rents 12–24 months out; constrained supply supports both.
Investment metrics
- 1% rule
- 1.64% ✓
- Cap rate
- 13.21%
- Cash-on-cash
- 24.70%
- DSCR
- 2.10
- GRM
- 5.1
CMA / ARV
No comps found within radius.
Projected returns pro-forma
-3.0% appreciation · 3.0% rent growth · sell at horizon
- IRR
- 18.1%
- Equity multiple
- 1.73×
- Total profit
- $11,299
- Equity at exit
- $8,201
- IRR
- 26.6%
- Equity multiple
- 3.33×
- Total profit
- $35,932
- Equity at exit
- $4,755
Cash invested: $15,400 (down + closing). Projections, not guarantees.
Landlord ↔ Tenant lean methodology
- Overall (STATE)
- 62 Landlord-Friendly
- State Pennsylvania
- 62 Landlord-Friendly · EVEN
- County
- — inherits STATE
- City
- — inherits STATE
ZIP-level market 17842
- Home prices YoY
- -16.9%
- Active inventory
- 11
- Price-to-rent
- 5.1×
Monthly cashflow live
- Estimated rent
- $904 medium interval (Pro) →
- Mortgage (P&I)
- −$288
- Tax from tax record
- −$86 /mo · $1,031/yr
- Insurance
- −$23
- HOA
- −$0
- Vacancy / Maint / Mgmt
- −$190
- Net cashflow
- $317
Break-even live
UW: 25.0% down · 7.5% · 30yr · 1.5% tax · 5.0% vac · 8.0% maint · 8.0% mgmt
Financing live
Cash to close
- Down payment
- $13,750
- Closing costs
- $1,650
- Reserves months
- —
- Total cash needed
- —
Loan-product check · same deal, 3 products live
Conventional
25% down · 7.5% · 30yr
- Down + closing
- —
- Monthly P&I
- —
- Monthly cashflow
- —
- DSCR
- —
- Eligible?
- —
Personal DTI + credit; lowest rate.
DSCR
20% down · 8.5% · 30yr
- Down + closing
- —
- Monthly P&I
- —
- Monthly cashflow
- —
- DSCR
- —
- Eligible?
- —
No personal income docs; deal must DSCR.
Hard money
10% down · 12.0% · 12mo
- Down + closing
- —
- Monthly P&I
- —
- Monthly cashflow
- —
- DSCR
- —
- Eligible?
- —
Short-term bridge; refi at stabilization.
Listing history 2 events
-
2026-06-18remarks 699-char remark
-
2026-06-18$55,000 Active 1 DOM
ⓘ Source: listings_history table (triggers on properties + properties_extension) + one-shot
backfill from property_details.listing_events for pre-trigger history.
Tax reassessment forecast PA · Partial reset (capped growth)
- Current annual tax
- $1,031 · $86/mo
- Projected year-2 tax
- $1,031 · $86/mo
- Expected delta
- $0/yr ($0/mo · 0.0%)
ⓘ Screening estimate from a state-policy table — verify with the county assessor before closing.
Climate risk First Street
- Flood 1/10 Low FEMA zone X (unshaded) · 0% chance over 30 yrs
- Wildfire 3/10 Moderate
- Heat 4/10 Moderate 7 d/yr ≥98°F today · 15 d/yr by 30 yrs out
- Wind 2/10 Low 3% chance of damaging wind over 30 yrs
- Air quality 2/10 Low 1 unhealthy d/yr today · 2 by 30 yrs out
Nearby sold comps map
Loading sold comps map…
Walkable amenities ~0.75 mi
Loading nearby amenities…
Taxation est. · year 1
- Rental income
- $10,849
- − Mortgage interest
- −$3,081
- − Property taxes
- −$1,031
- − Insurance
- −$275
- − Repairs & maintenance
- −$868
- − Management
- −$868
- − Depreciation
- −$1,600
- Taxable income
- $3,126
- Est. tax owed @ 24.0%
- −$750
- After-tax cash flow
- $3,053/yr
For passive investors: Depreciation is non-cash, so a rental often shows a tax loss while cash-flowing — sheltering income. Rental losses are passive: they offset passive income freely, and up to $25,000/yr can offset ordinary (W-2) income if you actively participate and your MAGI is under $100k (phasing out to $0 by $150k); unused losses carry forward. On sale, claimed depreciation is recaptured at up to 25%, and gains may owe capital-gains tax (a 1031 exchange can defer both). Figures are a year-1 estimate at your 24.0% rate — not tax advice; consult a CPA.
Schools (NCES district)
- District
- Midd-West SD
- NCES district ID
- 4215210
- Math proficiency
- 41% ▼ -9.00%
- Reading proficiency
- 55% ▼ -8.00%
- Median HH income
- $45,875
- Composite
- 40.68/100
- National rank
- #3675
- State rank
- #225 of 539 in PA
Livability — Franklin
- Score
- 69/100
- State rank
- #812
- US rank
- #8260
Category grades
Schools grade is shown separately in the Schools card above.
Census & demographics
- Population (ZIP)
- 8,110
Population outlook (Snyder County) Hauer SSP2
- Today (2025)
- 41,720 people
- By 2030
- 42,207 · +1.2%
- By 2040
- 42,918 · +2.9%
- By 2050
- 43,125 · +3.4%
- By 2075
- 42,498 · +1.9%
- By 2100
- 39,544 · -5.2%
Race, ethnicity, and origin ACS 2023
- Neighborhood character
- Predominantly White (96%)
- Race & ethnicity
- White 96% Two or more races 2% Hispanic / Latino 2%
- Common ancestry
- Iranian 2% Slovak 2% Romanian 2%
- Foreign-born
- 0%
- Languages at home
- 95% English-only · German/W. Germanic 4% Spanish 1%
Political lean MEDSL · Snyder
- 2024 margin
- Solid R (+47.0) · D 26.1% · R 73.2%
- 2008→2024 swing
- -17.8pp toward R · 2008: -29.2pp · 2024: -47.0pp
- All cycles
- 2024: R+47.0 2020: R+47.4 2016: R+47.3 2012: R+35.9 2008: R+29.2
Not yet ingested
- Civics
- —
Market trends
- HPI YoY
- ▼ -28.37%
- Current HPI
- 139.2792
- Rent YoY
- —
- Metro
- —
- State GDP YoY
- ▲ 1.68%
- F500 in state
- 34
Industry mix (Fortune 500 HQ in PA)
| Industry | F500 HQs | Revenue |
|---|---|---|
| Healthcare | 2 | $309B |
|
||
| Insurance | 2 | $27B |
|
||
| Telecommunications / Media | 1 | $124B |
|
||
| Industrial Distribution | 1 | $22B |
|
||
| Financial Services | 1 | $20B |
|
||
| Chemicals / Materials | 1 | $18B |
|
||
Price history
1 event — show timeline
- 2026-06-18 Listed $55,000 CSVBR
Property tax history
+1.3%/yrLatest (2026): $1,031 · +1.9% YoY. Source: county tax records.
Cash-flow waterfall
monthlySold comps — $/sqft
last 12 mo · ≤1 miLoading sold comps…