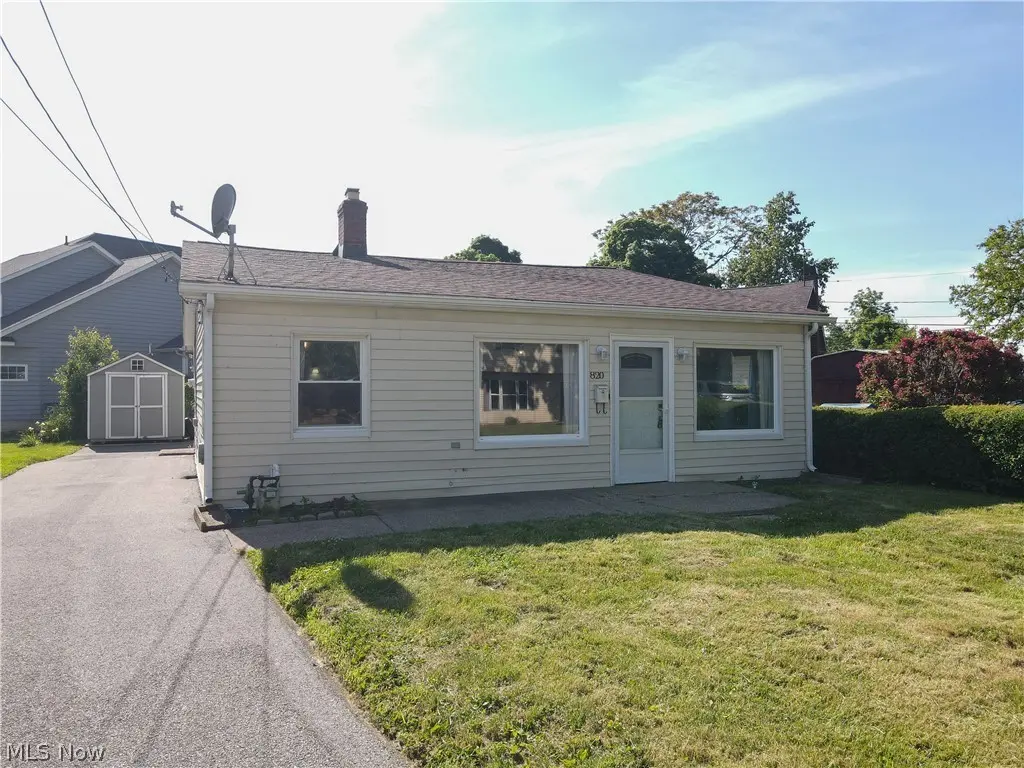
820 Peach Blvd · Willoughby, OH
Flood risk 1/10 · Minimal
- FEMA flood zone
- X (unshaded)
- Chance of flooding over 30 yrs
- 0.0%
- Est. flood insurance / yr
- $507 – $1,088
Fire risk 1/10 · Minimal
- Est. fire insurance / yr
- $713 – $1,323
Heat risk 3/10 · Minor
- Hot days now (above 93°F)
- 7 days/yr
- Hot days in 30 yrs
- 18 days/yr
Wind risk 1/10 · Minimal
- Chance of severe wind over 30 yrs
- —
Air-quality risk 4/10 · Minor
- Unhealthy air days now
- 6 days/yr
- Unhealthy air days in 30 yrs
- 6 days/yr
Risk factors via First Street. Map © Google.
Why this score? — see what drove the C grade
The composite is a weighted blend of 9 inputs, each scored 0–100. Each bar is that input's sub-score; the figure is the points it added to the 100-point composite (weight × sub-score).
- Cash flow +20.1/30.0
- ARV discount +12.9/15.0
- DSCR +6.4/10.0
- 1% rule +5.2/10.0
- Schools +4.3/10.0
- Livability +3.8/5.0
- Rent growth +3.5/5.0
- Condition / age +2.5/5.0
- Appreciation +0.0/10.0
$149,900
🖨 Deal sheet 📄 Offer letter ✓ Due diligence
Listing remarks MLS
Come see this gem mere steps from Lake Erie. This 2 bedroom, 1 bath Ranch style home is exactly what you are looking for. Close to freeways and a short distance to Osborne Park, you have the best of both worlds. A new hot water tank was installed as of 2019. In 2018, it had new wall/attic insulation put in, new gutters, the back half of the roof was replaced, and a new shed was built. Come check out this great home while you can because this home will not last long!
Key facts
- Newly paved driveway
- 3,118 sq ft lot
- Parking
Tags
Property features AI
Finance
- HOA & community: Community amenities include lake access, playground, and park
Exterior
- Parking: Driveway
- Utilities: Public water; Public sewer
- Home design: Single-story home
- Construction: Vinyl siding; Asphalt/fiberglass shingle roof; Built per public records
- Exterior features: Front yard; Back yard; Outdoor storage; Shed(s); Property has a view
Interior
- Kitchen: Dishwasher; Garbage disposal; Microwave; Range; Refrigerator; Granite counters; Eat-in kitchen; Pantry; Bar
- Bedrooms: Two main-level bedrooms
- Bathrooms: One full bathroom on the main level
- Heating & cooling: Forced air heating (gas); Fireplace heating; Ceiling fans; Window air conditioning units
- Interior features: Ceiling fans; Eat-in kitchen; Granite counters; Open floorplan; Pantry; Bar; Living room wood-burning fireplace (1)
- Laundry & utility: Washer and dryer on the main level
Neighborhood map
What this means for you Summary
Snapshot
- This is a 2-bed/1.0-bath single-family listed at $150k.
Deal economics
- At list price, monthly cash flow is $186 ($2k/yr) — positive.
- The deal already cash-flows at list — no discount required.
- Meets the 1% rule at list price ($2k rent vs $150k).
- Cap rate 7.8% vs local median 2.8% in Willoughby — top-decile yield for the area; either an underpriced asset or a hidden risk that comps aren't pricing in. Stress-test before assuming the spread holds.
Location & tenants
- Location reads 75/100 on livability (#249 in OH, #3,972 nationally) — a middle-class / working-renter tenant base. Strengths: crime A+, cost of living A+, housing A+; Watch: health & safety D, amenities F, commute F.
- Willoughby-Eastlake City (suburban): math 42% / reading 58% proficiency, ranked #434 of 656 in OH (top 66%) — acceptable for families but not a draw, mixed tenant base, ~2y average lease.
- Market conditions: Rents rising fast (+4.0%/yr); 187 active listings in the ZIP; 6 comparable units currently listed for rent nearby; rentals at typical pace (median 24d on market — plan ~3-4 weeks tenant-placement turnaround); solid renter incomes; 448 units permitted in Lake County in 2024 (0 in 5+ unit buildings).
Forward outlook
- Local home prices are declining (-3.0%/yr); year-one equity from $1k of loan paydown is wiped out by about $4k of value loss. Plan a longer hold.
- Lake County population projected to shrink 8% by 2050 — rents likely to lag national; underwrite the cash flow, not the appreciation.
Negotiation context
- Only 13 days on market — expect competitive offers; lowballing is unlikely to land.
- 9 sale attempts since 29y ago with the ask held roughly flat each time — persistent listings suggest the price (not the market) is what's stuck; bring a comps-based counter.
- Current owner paid $96k; list at $150k implies a 56% gain — meaningful room to come down on a strong offer.
Risks & watch-outs
- Watch-outs: built in 1945 — expect roof / HVAC / electrical / plumbing capex.
Questions for the listing agent
- Built in 1945 — when were the roof, HVAC, electrical panel, plumbing, and water heater last replaced?
- Is there a deadline driving the sale (1031 exchange, divorce, estate, relocation)? That informs how much negotiation room exists.
- Schools are B-rated — typically a magnet for longer-tenancy family renters. What's the average tenant stay here, and is there a school-zone premium baked into asking?
- What's the average days-on-market for RENTAL listings here right now (not sales)? A rising rental-DOM trend means longer vacancies and softer asking-rent achievability than the comps imply.
- What's the recent tenant-quality profile in this submarket — average credit score on applications, eviction rate, late-payment / NSF rate, and stable-employment percentage? A property-management company in the area should have these aggregated.
- How much new for-sale + rental construction is in the pipeline within 1–3 miles? Heavy new supply typically softens prices + rents 12–24 months out; constrained supply supports both.
Investment metrics
- 1% rule
- 1.02% ✓
- Cap rate
- 7.78%
- Cash-on-cash
- 5.33%
- DSCR
- 1.24
- GRM
- 8.2
CMA / ARV
- ARV (on-the-fly)
- $170,520
- Comps found
- 12
Show comp detail 12 sales within ~0.75 mi
| Address | Dist | Beds/Ba | Sqft | Sold | Price | $/sf | Match |
|---|---|---|---|---|---|---|---|
| 722 Chestnut Blvd | 0.31mi | 1/1.0 (-1) | 1,200 (+3%) | 0mo | $177,500 | $148 | 74 |
| 1040 Windermere Dr | 0.32mi | 3/2.0 (+1) | 1,155 (-0%) | 2mo | $155,000 | $134 | 74 |
| 967 Windermere Dr | 0.23mi | 3/1.5 (+1) | 1,196 (+3%) | 8mo | $185,000 | $155 | 71 |
| 700 Cherokee Trl | 0.43mi | 2/1.0 | 1,192 (+3%) | 7mo | $159,000 | $133 | 70 |
| 908 Peach Blvd | 0.11mi | 3/1.0 (+1) | 1,024 (-12%) | 2mo | $196,000 | $191 | 69 |
| 1053 Eaglewood Dr | 0.30mi | 2/1.0 | 1,060 (-9%) | 8mo | $116,000 | $109 | 65 |
| 1068 Elmwood Dr | 0.37mi | 3/1.0 (+1) | 1,104 (-5%) | 7mo | $160,000 | $145 | 64 |
| 1171 Garden Rd | 0.54mi | 3/1.5 (+1) | 1,135 (-2%) | 3mo | $185,000 | $163 | 62 |
| 766 Cherokee Trl | 0.41mi | 3/1.5 (+1) | 1,080 (-7%) | 3mo | $100,000 | $93 | 60 |
| 6399 Seminole Trl | 0.57mi | 3/1.0 (+1) | 1,010 (-13%) | 4mo | $135,000 | $134 | 43 |
| 6284 Seneca Rd | 0.56mi | 3/2.0 (+1) | 1,318 (+14%) | 2mo | $202,000 | $153 | 40 |
| 38462 S Beachview Rd | 0.60mi | 3/1.5 (+1) | 1,330 (+15%) | 2mo | $195,000 | $147 | 39 |
Match score weights: distance 35% · size 25% · config 20% · recency 20%. Top-matched comps best support the ARV.
Projected returns pro-forma
-3.0% appreciation · 4.01% rent growth · sell at horizon
- IRR
- -6.9%
- Equity multiple
- 0.74×
- Total profit
- $-10,847
- Equity at exit
- $22,351
- IRR
- 3.9%
- Equity multiple
- 1.30×
- Total profit
- $12,437
- Equity at exit
- $12,961
Cash invested: $41,972 (down + closing). Projections, not guarantees.
Landlord ↔ Tenant lean methodology
- Overall (STATE)
- 73 Landlord-Friendly
- State Ohio
- 73 Landlord-Friendly · R+6
- County
- — inherits STATE
- City
- — inherits STATE
ZIP-level market 44094
- Rents YoY
- 4.0%
- Active inventory
- 187
- Price-to-rent
- 8.2×
Monthly cashflow live
- Estimated rent
- $1,524 high interval (Pro) →
- Mortgage (P&I)
- −$786
- Tax from tax record
- −$169 /mo · $2,034/yr
- Insurance
- −$62
- HOA
- −$0
- Vacancy / Maint / Mgmt
- −$320
- Net cashflow
- $186
Break-even live
UW: 25.0% down · 7.5% · 30yr · 1.5% tax · 5.0% vac · 8.0% maint · 8.0% mgmt
Financing live
Cash to close
- Down payment
- $37,475
- Closing costs
- $4,497
- Reserves months
- —
- Total cash needed
- —
Loan-product check · same deal, 3 products live
Conventional
25% down · 7.5% · 30yr
- Down + closing
- —
- Monthly P&I
- —
- Monthly cashflow
- —
- DSCR
- —
- Eligible?
- —
Personal DTI + credit; lowest rate.
DSCR
20% down · 8.5% · 30yr
- Down + closing
- —
- Monthly P&I
- —
- Monthly cashflow
- —
- DSCR
- —
- Eligible?
- —
No personal income docs; deal must DSCR.
Hard money
10% down · 12.0% · 12mo
- Down + closing
- —
- Monthly P&I
- —
- Monthly cashflow
- —
- DSCR
- —
- Eligible?
- —
Short-term bridge; refi at stabilization.
Rent comps 6 comps
| Address | Beds | Baths | Sqft | Rent | $/sqft | DOM | Units | Dist |
|---|---|---|---|---|---|---|---|---|
| 6177 Iroquois Trl Mentor, OH | 3.0 | 1.0 | 1116 | $1,700 | $1.52 | 1d | 1 | 0.54mi |
| 6247 Seneca Rd Mentor, OH | 3.0 | 1.0 | 912 | $1,750 | $1.92 | 1d | 1 | 0.59mi |
| 38280 North Ln Unit H-206 Willoughby, OH | 3.0 | 2.0 | 1100 | $1,400 | $1.27 | 43d | 1 | 0.78mi |
| 38280 North Ln Unit J-208 Willoughby, OH | 3.0 | 2.0 | 1100 | $1,400 | $1.27 | 23d | 1 | 0.78mi |
| 38360 Tamarac Blvd Willoughby, OH | 1.0–2.0 | 1.0–2.0 | 950 | $1,835 | $1.93 | 1d | 29 | 1.00mi |
| 123 Plymouth Rd Eastlake, OH | 3.0 | 2.5 | 1400 | $1,881 | $1.34 | 43d | 1 | 1.29mi |
Listing history 10 events
-
2026-06-18days on market $149,900 Active 13 DOM
-
2026-06-17days on market $149,900 Active 12 DOM
-
2026-06-16days on market $149,900 Active 11 DOM
-
2026-06-15days on market $149,900 Active 10 DOM
-
2026-06-13days on market $149,900 Active 8 DOM
-
2026-06-13days on market $149,900 Active 7 DOM
-
2026-06-09days on market $149,900 Active 4 DOM
-
2026-06-08days on market $149,900 Active 3 DOM
-
2026-06-07remarks 699-char remark
-
2026-06-07$149,900 Active 2 DOM
ⓘ Source: listings_history table (triggers on properties + properties_extension) + one-shot
backfill from property_details.listing_events for pre-trigger history.
Tax reassessment forecast OH · Partial reset (capped growth)
- Current annual tax
- $2,034 · $169/mo
- Projected year-2 tax
- $2,186 · $182/mo
- Expected delta
- +$152/yr (+$13/mo · 7.5%)
ⓘ Screening estimate from a state-policy table — verify with the county assessor before closing.
Climate risk First Street
- Flood 1/10 Low FEMA zone X (unshaded) · 0% chance over 30 yrs
- Wildfire 1/10 Low
- Heat 3/10 Moderate 7 d/yr ≥93°F today · 18 d/yr by 30 yrs out
- Wind 1/10 Low
- Air quality 4/10 Moderate 6 unhealthy d/yr today · 6 by 30 yrs out
Nearby sold comps map
Loading sold comps map…
Walkable amenities ~0.75 mi
Loading nearby amenities…
Taxation est. · year 1
- Rental income
- $18,294
- − Mortgage interest
- −$8,397
- − Property taxes
- −$2,034
- − Insurance
- −$750
- − Repairs & maintenance
- −$1,463
- − Management
- −$1,463
- − Depreciation
- −$4,361
- Taxable loss
- −$174
- Est. tax savings @ 24.0%
- +$42
- After-tax cash flow
- $2,277/yr
For passive investors: Depreciation is non-cash, so a rental often shows a tax loss while cash-flowing — sheltering income. Rental losses are passive: they offset passive income freely, and up to $25,000/yr can offset ordinary (W-2) income if you actively participate and your MAGI is under $100k (phasing out to $0 by $150k); unused losses carry forward. On sale, claimed depreciation is recaptured at up to 25%, and gains may owe capital-gains tax (a 1031 exchange can defer both). Figures are a year-1 estimate at your 24.0% rate — not tax advice; consult a CPA.
Schools (NCES district)
- District
- Willoughby-Eastlake City
- NCES district ID
- 3904510
- Math proficiency
- 42% ▼ -21.00%
- Reading proficiency
- 58% ▼ -11.00%
- Median HH income
- $52,500
- Composite
- 42.96/100
- National rank
- #3110
- State rank
- #434 of 656 in OH
Livability — Willoughby
- Score
- 75/100
- State rank
- #249
- US rank
- #3972
Category grades
Schools grade is shown separately in the Schools card above.
Census & demographics
- Census place
- Willoughby, OH
- County
- Lake County · 204,927 people
- City population
- 36,873
- Metro
- Cleveland-Elyria, OH
- Population (ZIP)
- 36,873
- Household income
- $78,772
- Rent vs Own
- Severe rent burden
- 1381.0
Population outlook (Lake County) Hauer SSP2
- Today (2025)
- 230,022 people
- By 2030
- 228,151 · -0.8%
- By 2040
- 221,018 · -3.9%
- By 2050
- 212,754 · -7.5%
- By 2075
- 200,309 · -12.9%
- By 2100
- 183,315 · -20.3%
Race, ethnicity, and origin ACS 2023
- Neighborhood character
- Predominantly White (86%)
- Race & ethnicity
- White 86% Black 7% Two or more races 4% Hispanic / Latino 2% Asian 2%
- Common ancestry
- Romanian 7% Lithuanian 2% Slovak 2%
- Foreign-born
- 7% · Canada, China
- Languages at home
- 92% English-only · Russian/Polish/Slavic 3% Other Indo-European 1% German/W. Germanic 1%
Political lean MEDSL · Lake
- 2024 margin
- R (+14.3) · D 42.4% · R 56.7%
- 2008→2024 swing
- -15.2pp toward R · 2008: 0.8pp · 2024: -14.3pp
- All cycles
- 2024: R+14.3 2020: R+13.6 2016: R+15.6 2012: R+1.7 2008: D+0.8
Not yet ingested
- Civics
- —
Market trends
- HPI YoY
- ▼ -229.28%
- Current HPI
- 179.81
- Rent YoY
- ▲ 4.01%
- Metro
- Cleveland-Elyria, OH
- State GDP YoY
- ▲ 1.98%
- F500 in state
- 48
Industry mix (Fortune 500 HQ in OH)
| Industry | F500 HQs | Revenue |
|---|---|---|
| Insurance | 3 | $145B |
|
||
| Industrial Machinery | 3 | $49B |
|
||
| Financial Services | 3 | $24B |
|
||
| Consumer Goods | 2 | $93B |
|
||
| Aerospace / Defense | 2 | $47B |
|
||
| Utilities | 2 | $33B |
|
||
Price history
+200.4% since first listed28 events — show timeline
- 2026-06-04 Listed $149,900 MLSNOW
- 2026-01-19 Price Changed $158,000 MLSNOW
- 2025-11-15 Listed $165,000 MLSNOW
- 2021-06-02 Sold (Public Records) $96,000 Public Records
- 2021-06-02 Sold (MLS) $96,000 MLSNOW
- 2021-05-25 Pending — MLSNOW
- 2021-04-17 Contingent — MLSNOW
- 2021-04-12 Listed $94,900 MLSNOW
- 2017-02-20 Pending — MLSNOW
- 2017-02-17 Sold (Public Records) $68,500 Public Records
- 2017-02-17 Sold (MLS) $68,400 MLSNOW
- 2017-01-03 Contingent — MLSNOW
- 2016-12-22 Listed $68,400 MLSNOW
- 2015-12-11 Sold (MLS) $18,250 MLSNOW
- 2015-11-23 Pending — MLSNOW
- 2015-11-11 Price Changed $21,900 MLSNOW
- 2015-11-10 Relisted — MLSNOW
- 2015-10-30 Pending — MLSNOW
- 2015-10-12 Price Changed $28,000 MLSNOW
- 2015-09-15 Listed $36,400 MLSNOW
- 2013-08-16 Listing Removed — MLSNOW
- 2013-08-08 Listed $42,800 MLSNOW
- 2013-05-31 Listing Removed — MLSNOW
- 2012-08-21 Listed $42,800 MLSNOW
- 2004-02-25 Sold (Public Records) $60,000 Public Records
- 1997-08-20 Sold (MLS) $43,000 MLSNOW
- 1997-08-14 Sold (Public Records) $43,000 Public Records
- 1997-07-01 Listed $49,900 MLSNOW
Property tax history
+0.6%/yrLatest (2025): $2,034 · -1.5% YoY. Source: county tax records.
Cash-flow waterfall
monthlySold comps — $/sqft
last 12 mo · ≤1 miLoading sold comps…