4641 Country Creek Dr #1084 · Dallas, TX
Flood risk 4/10 · Minor
- FEMA flood zone
- X (unshaded)
- Chance of flooding over 30 yrs
- 0.22%
- Est. flood insurance / yr
- $507 – $1,088
Fire risk 3/10 · Minor
- Est. fire insurance / yr
- $1,222 – $2,270
Heat risk 7/10 · Major
- Hot days now (above 110°F)
- 7 days/yr
- Hot days in 30 yrs
- 24 days/yr
Wind risk 6/10 · Moderate
- Chance of severe wind over 30 yrs
- 27.0%
Air-quality risk 3/10 · Minor
- Unhealthy air days now
- 2 days/yr
- Unhealthy air days in 30 yrs
- 3 days/yr
Risk factors via First Street. Map © Google.
Why this score? — see what drove the F grade
The composite is a weighted blend of 9 inputs, each scored 0–100. Each bar is that input's sub-score; the figure is the points it added to the 100-point composite (weight × sub-score).
- ARV discount +7.5/15.0
- Cash flow +4.8/30.0
- 1% rule +4.8/10.0
- Livability +4.0/5.0
- Rent growth +2.9/5.0
- Schools +2.8/10.0
- Condition / age +2.5/5.0
- DSCR +0.0/10.0
- Appreciation +0.0/10.0
$145,900
🖨 Deal sheet (PDF) 📄 Offer letter ✓ Due diligence
Listing remarks MLS
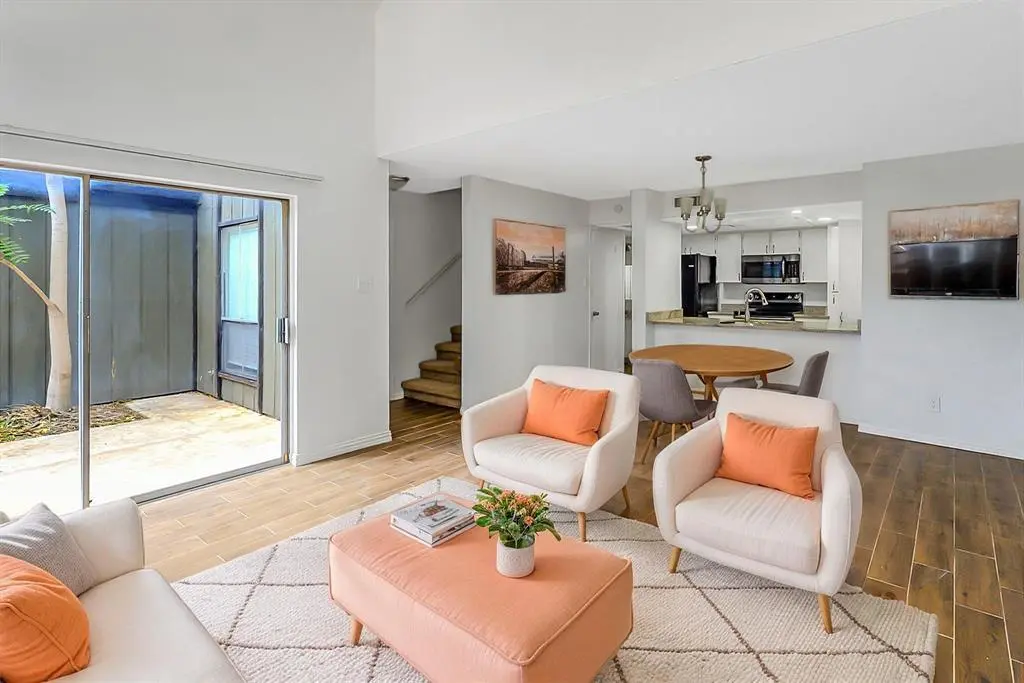
Sleek, modern newly remodeled 2 bed 2 bath condo with an open floor plan. Spacious living and dining area with gorgeous porcelain tile flooring is overlooked by a sparkling clean kitchen with brand new appliances. Perfect for a family, 2 large bedrooms (upstairs and downstairs) feature soft carpet, walk-in closets, and are connected to full bathrooms. Bathrooms feature granite vanity tops, champagne colored stone tile in the bath, and modern mirrors and light fixtures. Appliances, carpets, decorative fixtures, granite counter tops, bathroom fixtures, bathtubs, toilets and paint are all brand new! Don't miss out on this welcoming and newly renovated space that can be your home for years to come!
Key facts
- Pool
- Built 1974
- Listed 13 days
Property features AI
Finance
- Other: Property is part of Country Condos Creek subdivision; Municipal utility district: No
- HOA & community: Mandatory association; Monthly association fees; Association covers front yard maintenance, insurance, grounds and structure maintenance, management fees, and security; HOA managed by Texas Star CM (469-899-1000)
Exterior
- Parking: Parking lot
- Security: Community security (included in association services)
- Utilities: City water; City sewer; Cable available; Community mailbox
- Home design: Residential condominium; Attached property; Two-story; Built in 1974
- Construction: Brick, siding, and wood construction; Composition roof; Slab foundation
- Exterior features: Private yard; Courtyard; Enclosed patio; Privacy wood fencing; In-ground pool
Interior
- Kitchen: Granite countertops; Breakfast bar; Dual sinks; Electric range; Microwave; Disposal; Dishwasher; Utility area in kitchen
- Bedrooms: 2 bedrooms total; Primary bedroom on level 1 with ensuite bath and walk-in closet; Second primary bedroom on level 2 with ensuite bath and walk-in closet
- Bathrooms: 2 full bathrooms
- Heating & cooling: Central heating (electric); Central air; Ceiling fan(s)
- Interior features: Open floorplan; Decorative lighting; Granite counters; Cable TV available; High speed internet available; Walk-in closet(s); One living area; One dining area; Total of 4 rooms; Two levels
- Laundry & utility: Washer hookup
Neighborhood map
What this means for you Summary
Snapshot
- This is a 2-bed/2.0-bath condo listed at $146k.
Deal economics
- At list price, monthly cash flow is $-358 ($-4k/yr) — negative.
- The deal already cash-flows at list — no discount required.
- To meet the 1% rule (rent ≥ 1% of price), the offer needs to be $143k (1.7% below list).
- Recommended offer: $143k (1.7% below list) — sets the bar for 1% rule.
- Cap rate 3.4% vs local median 2.3% in Dallas — top-decile yield for the area; either an underpriced asset or a hidden risk that comps aren't pricing in. Stress-test before assuming the spread holds.
Location & tenants
- Location reads 81/100 on livability (#24 in TX, #1,380 nationally) — a professional / high-income tenant draw. Strengths: amenities A+, commute A+, housing A+; Watch: crime F.
- Dallas ISD (urban): math 31% / reading 36% proficiency, ranked #559 of 826 in TX (top 68%) — families likely to look elsewhere, expect single-tenant / working-renter base with shorter leases; 83% free/reduced lunch — lower-income household profile, screen leases tightly.
- Zoned schools: Thomas Tolbert El (math 37% / reading 37%, grade F, #1,769 of 4,322 statewide, top 44%, 311 students, 97% FRL); T W Browne Middle (math 15% / reading 23%, grade F, #1,466 of 1,662 statewide, top 89%, 478 students, 96% FRL); Justin F Kimball H S (math 15% / reading 24%, grade F, #1,424 of 1,632 statewide, top 88%, 1,192 students, 81% FRL).
- Market conditions: Rents rising (+1.7%/yr); 45 active listings in the ZIP; 18 comparable units currently listed for rent nearby; rentals at typical pace (median 23d on market — plan ~3-4 weeks tenant-placement turnaround); 12,577 units permitted in Dallas County in 2024 (6,829 in 5+ unit buildings).
- This rent runs 35% of the median local income ($50k/yr) — at the standard rent-burdened threshold; future hikes will face affordability resistance.
Forward outlook
- Local home prices are declining (-3.0%/yr); year-one equity from $1k of loan paydown is wiped out by about $4k of value loss. Plan a longer hold.
- Dallas County population projected at +35% by 2050 — long-run rental-demand tailwind backs the buy-and-hold thesis.
Negotiation context
- Only 13 days on market — expect competitive offers; lowballing is unlikely to land.
- 6 sale attempts since 11y ago with the ask held roughly flat each time — persistent listings suggest the price (not the market) is what's stuck; bring a comps-based counter.
Risks & watch-outs
- Watch-outs: HOA is 29% of rent.
- Climate carrying-cost: major wind risk, 27% chance of damaging wind over 30y; extreme-heat days projected 7→24/yr by 2055 (HVAC capex compounding) — expect insurance premiums to compound above CPI over the hold.
Questions for the listing agent
- What do current leases actually rent for vs. the listed asking? Can we see a recent rent roll and the last 12 months of T-12 income?
- Built in 1974 — when were the roof, HVAC, electrical panel, plumbing, and water heater last replaced?
- What does the HOA fee cover, when was the last increase, and are there any pending special assessments or reserve-fund shortfalls?
- Any open or pending special assessments — roof, HVAC, plumbing, elevator, façade? What's the per-unit balance and payoff schedule, and is the seller paying it off at close or rolling it to the buyer?
- Is there a deadline driving the sale (1031 exchange, divorce, estate, relocation)? That informs how much negotiation room exists.
- Crime grade is F in this area — have there been break-ins, vandalism, or insurance claims at this property in the last 3 years? What carrier currently insures it and at what premium?
- The area grade is low — what's the realistic commute time and amenity access for the typical tenant pool here? Any planned neighborhood developments (good or bad) we should know about?
- What's the average days-on-market for RENTAL listings here right now (not sales)? A rising rental-DOM trend means longer vacancies and softer asking-rent achievability than the comps imply.
- What's the recent tenant-quality profile in this submarket — average credit score on applications, eviction rate, late-payment / NSF rate, and stable-employment percentage? A property-management company in the area should have these aggregated.
- How much new apartment / multifamily construction is in the pipeline within 1–3 miles? Heavy new supply (>2% of stock underway) typically softens rents 12–24 months out; light construction supports rent growth.
Investment metrics
- 1% rule
- 0.98% ✗
- Cap rate
- 3.35%
- Cash-on-cash
- -10.51%
- DSCR
- 0.53
- GRM
- 8.5
CMA / ARV
No comps found within radius.
Projected returns pro-forma
-3.0% appreciation · 1.74% rent growth · sell at horizon
- IRR
- -37.3%
- Equity multiple
- -0.17×
- Total profit
- $-47,905
- Equity at exit
- $21,754
- IRR
- -67.9%
- Equity multiple
- -0.88×
- Total profit
- $-76,947
- Equity at exit
- $12,615
Cash invested: $40,852 (down + closing). Projections, not guarantees.
Landlord ↔ Tenant lean methodology
- Overall (STATE)
- 87 Strongly Landlord-Friendly
- State Texas
- 87 Strongly Landlord-Friendly · R+5
- County
- — inherits STATE
- City
- — inherits STATE
ZIP-level market 75236
- Home prices YoY
- -6.5%
- Rents YoY
- 1.7%
- Active inventory
- 45
- Price-to-rent
- 8.5×
Monthly cashflow live
- Estimated rent
- $1,435 high interval (Pro) →
- Mortgage (P&I)
- −$765
- Tax from tax record
- −$252 /mo · $3,028/yr
- Insurance
- −$61
- HOA est. from 2 same-building comps
- −$413
- Vacancy / Maint / Mgmt
- −$301
- Net cashflow
- $-358
Break-even live
Sensitivity live
| Price | -10% $-275 | -5% $-316 | +0% $-358 | +5% $-399 | +10% $-440 |
|---|---|---|---|---|---|
| Rent | -10% $-471 | -5% $-414 | +0% $-358 | +5% $-301 | +10% $-244 |
| Rate | -1.0pp $-284 | -0.5pp $-321 | base $-358 | +0.5pp $-396 | +1.0pp $-434 |
UW: 25.0% down · 7.5% · 30yr · 1.5% tax · 5.0% vac · 8.0% maint · 8.0% mgmt
Financing live
Cash to close
- Down payment
- $36,475
- Closing costs
- $4,377
- Reserves months
- —
- Total cash needed
- —
Loan-product check · same deal, 3 products live
Conventional
25% down · 7.5% · 30yr
- Down + closing
- —
- Monthly P&I
- —
- Monthly cashflow
- —
- DSCR
- —
- Eligible?
- —
Personal DTI + credit; lowest rate.
DSCR
20% down · 8.5% · 30yr
- Down + closing
- —
- Monthly P&I
- —
- Monthly cashflow
- —
- DSCR
- —
- Eligible?
- —
No personal income docs; deal must DSCR.
Hard money
10% down · 12.0% · 12mo
- Down + closing
- —
- Monthly P&I
- —
- Monthly cashflow
- —
- DSCR
- —
- Eligible?
- —
Short-term bridge; refi at stabilization.
Rent comps 18 comps
| Address | Beds | Baths | Sqft | Rent | $/sqft | DOM | Units | Dist |
|---|---|---|---|---|---|---|---|---|
| 4637 Country Creek Dr #1076 Dallas, TX | 2.0 | 2.0 | 1046 | $1,650 | $1.58 | 1d | 1 | 0.05mi |
| 4619 Country Creek Dr #1036 Dallas, TX | 2.0 | 2.0 | 1046 | $1,650 | $1.58 | 26d | 1 | 0.15mi |
| 4592 W Kiest Blvd Apt 2107 Dallas, TX | 2.0 | 1.5 | 969 | $1,195 | $1.23 | 22d | 1 | 0.38mi |
| 4580 W Kiest Blvd Unit 2085 Dallas, TX | 2.0 | 1.5 | 969 | $1,195 | $1.23 | 22d | 1 | 0.42mi |
| 4578 W Kiest Blvd Unit 2078 Dallas, TX | 2.0 | 1.5 | 969 | $1,195 | $1.23 | 22d | 1 | 0.42mi |
| 4574 W Kiest Blvd Unit 2070 Dallas, TX | 2.0 | 1.5 | 969 | $1,195 | $1.23 | 22d | 1 | 0.44mi |
| 4564 W Kiest Blvd Unit 1062 Dallas, TX | 2.0 | 1.5 | 969 | $1,195 | $1.23 | 22d | 1 | 0.45mi |
| 4564 W Kiest Blvd Unit 1064 Dallas, TX | 2.0 | 1.5 | 969 | $945 | $0.98 | 26d | 1 | 0.45mi |
| 4560 W Kiest Blvd Unit 1057 Dallas, TX | 2.0 | 1.5 | 969 | $1,195 | $1.23 | 22d | 1 | 0.47mi |
| 3901 Altoona Dr Dallas, TX | 2.0–4.0 | 1.5 | 1367 | $1,350 | $0.99 | 4d | 4 | 0.49mi |
| 4556 W Kiest Blvd Unit 1046 Dallas, TX | 2.0 | 1.5 | 969 | $1,195 | $1.23 | 9d | 1 | 0.50mi |
| 4556 W Kiest Blvd Apt 1049 Dallas, TX | 2.0 | 1.5 | 969 | $945 | $0.98 | 45d | 1 | 0.50mi |
| 4562 W Kiest Blvd Unit 2059 Dallas, TX | 2.0 | 1.5 | 969 | $1,195 | $1.23 | 17d | 1 | 0.54mi |
| 4753 Duncanville Rd Dallas, TX | 1.0–3.0 | 1.0–2.0 | 861 | $1,112 | $1.29 | 12d | 9 | 0.99mi |
| 4520 Wyoming St Dallas, TX | 3.0 | 1.0 | 1250 | $1,750 | $1.40 | 26d | 1 | 1.16mi |
| 1016 Matamoros Plz Dallas, TX | 3.0 | 2.5 | 1323 | $1,975 | $1.49 | 4d | 1 | 1.35mi |
| 2626 Duncanville Rd Dallas, TX | 1.0–2.0 | 1.0–2.0 | 805 | $1,400 | $1.74 | 1d | 17 | 1.39mi |
| 5110 Ranchero Ln Unit A Dallas, TX | 3.0 | 1.0 | 1024 | $1,900 | $1.86 | 45d | 1 | 1.46mi |
HOA detail condo
- Monthly dues
- $0 · $0/yr
- Assessments
- None detected in remarks — confirm with the listing agent.
Listing history 8 events
-
2026-06-21days on market $145,900 Active 13 DOM
-
2026-06-18days on market $145,900 Active 10 DOM
-
2026-06-17days on market $145,900 Active 9 DOM
-
2026-06-16days on market $145,900 Active 8 DOM
-
2026-06-15days on market $145,900 Active 7 DOM
-
2026-06-13days on market $145,900 Active 5 DOM
-
2026-06-08remarks 405-char remark
-
2026-06-08$145,900 Active 1 DOM
ⓘ Source: listings_history table (triggers on properties + properties_extension) + one-shot
backfill from property_details.listing_events for pre-trigger history.
Tax reassessment forecast TX · Resets to sale price
- Current annual tax
- $3,028 · $252/mo
- Projected year-2 tax
- $3,028 · $252/mo
- Expected delta
- $0/yr ($0/mo · 0.0%)
ⓘ Screening estimate from a state-policy table — verify with the county assessor before closing.
Climate risk First Street
- Flood 4/10 Moderate FEMA zone X (unshaded) · 22% chance over 30 yrs
- Wildfire 3/10 Moderate
- Heat 7/10 Severe 7 d/yr ≥110°F today · 24 d/yr by 30 yrs out
- Wind 6/10 Major 27% chance of damaging wind over 30 yrs
- Air quality 3/10 Moderate 2 unhealthy d/yr today · 3 by 30 yrs out
Nearby sold comps map
Loading sold comps map…
Walkable amenities ~0.75 mi
Loading nearby amenities…
Taxation est. · year 1
- Rental income
- $17,218
- − Mortgage interest
- −$8,173
- − Property taxes
- −$3,028
- − Insurance
- −$730
- − Repairs & maintenance
- −$1,377
- − Management
- −$1,377
- − HOA
- −$4,956
- − Depreciation
- −$4,244
- Taxable loss
- −$6,668
- Est. tax savings @ 24.0%
- +$1,600
- After-tax cash flow
- $-2,693/yr
For passive investors: Depreciation is non-cash, so a rental often shows a tax loss while cash-flowing — sheltering income. Rental losses are passive: they offset passive income freely, and up to $25,000/yr can offset ordinary (W-2) income if you actively participate and your MAGI is under $100k (phasing out to $0 by $150k); unused losses carry forward. On sale, claimed depreciation is recaptured at up to 25%, and gains may owe capital-gains tax (a 1031 exchange can defer both). Figures are a year-1 estimate at your 24.0% rate — not tax advice; consult a CPA.
Schools (NCES district)
- District
- Dallas ISD
- NCES district ID
- 4816230
- Math proficiency
- 31% ▼ -16.00%
- Reading proficiency
- 36% ▼ -4.00%
- Median HH income
- $42,881
- Composite
- 28.41/100
- National rank
- #6763
- State rank
- #559 of 826 in TX
Livability — Dallas
- Score
- 81/100
- State rank
- #24
- US rank
- #1380
Category grades
Schools grade is shown separately in the Schools card above.
Census & demographics
- Census place
- Dallas, TX
- County
- Dallas County · 2,612,404 people
- City population
- 1,168,437
- Metro
- Dallas-Fort Worth-Arlington, TX
- Population (ZIP)
- 18,963
- Household income
- $49,715
- Rent vs Own
- Severe rent burden
- 1788.0
Population outlook (Dallas County) Hauer SSP2
- Today (2025)
- 2,979,839 people
- By 2030
- 3,191,823 · +7.1%
- By 2040
- 3,619,611 · +21.5%
- By 2050
- 4,026,915 · +35.1%
- By 2075
- 4,957,073 · +66.4%
- By 2100
- 5,508,725 · +84.9%
Race, ethnicity, and origin ACS 2023
- Neighborhood character
- Diverse neighborhood (Simpson 0.64)
- Race & ethnicity
- Hispanic / Latino 45% Black 39% Two or more races 15% White 12% Native American 1%
- Hispanic origin (detail)
- Mexican 32%
- Common ancestry
- Iranian 1% Slovak 1%
- Foreign-born
- 20% · Canada
- Languages at home
- 65% English-only · Spanish 33% French/Haitian/Cajun 1%
Political lean MEDSL · Dallas
- 2024 margin
- Strong D (+22.2) · D 60.2% · R 38.0% · Other 1.8%
- 2008→2024 swing
- +6.9pp toward D · 2008: 15.3pp · 2024: 22.2pp
- All cycles
- 2024: D+22.2 2020: D+31.6 2016: D+26.2 2012: D+15.4 2008: D+15.3
Not yet ingested
- Civics
- —
Market trends
- HPI YoY
- ▼ -24.30%
- Current HPI
- 352.6454
- Rent YoY
- ▲ 1.74%
- Metro
- Dallas-Fort Worth-Arlington, TX
- State GDP YoY
- ▲ 3.95%
- F500 in state
- 110
Industry mix (Fortune 500 HQ in TX)
| Industry | F500 HQs | Revenue |
|---|---|---|
| Energy | 16 | $1,198B |
|
||
| Technology | 5 | $198B |
|
||
| Engineering / Construction | 4 | $72B |
|
||
| Energy Services | 3 | $60B |
|
||
| Utilities | 3 | $41B |
|
||
| Healthcare | 2 | $330B |
|
||
Price history
-2.1% since first listed15 events — show timeline
- 2026-06-08 Listed $145,900 NTREIS
- 2024-12-31 Listing Removed — NTREIS
- 2024-06-12 Listed $145,000 NTREIS
- 2021-01-13 Sold (MLS) — NTREIS
- 2020-12-12 Pending — NTREIS
- 2020-12-06 Price Changed $102,500 NTREIS
- 2020-12-03 Relisted — NTREIS
- 2020-11-18 Pending — NTREIS
- 2020-11-16 Contingent — NTREIS
- 2020-10-31 Relisted — NTREIS
- 2020-10-31 Listing Removed — NTREIS
- 2020-10-25 Listed $105,000 NTREIS
- 2015-07-01 Listing Removed — NTREIS
- 2015-05-05 Listed $149,000 NTREIS
- 1995-03-23 Sold (Public Records) — Public Records
Property tax history
+9.5%/yrLatest (2025): $3,028 · -4.1% YoY. Source: county tax records.
Cash-flow waterfall
monthlySold comps — $/sqft
last 12 mo · ≤1 miLoading sold comps…