9817 Kimker Ln · Sunset Hills, MO
Flood risk 1/10 · Minimal
- FEMA flood zone
- X (unshaded)
- Chance of flooding over 30 yrs
- 0.0%
- Est. flood insurance / yr
- $473 – $860
Fire risk 3/10 · Minor
- Est. fire insurance / yr
- $1,054 – $1,958
Heat risk 4/10 · Minor
- Hot days now (above 107°F)
- 7 days/yr
- Hot days in 30 yrs
- 20 days/yr
Wind risk 2/10 · Minimal
- Chance of severe wind over 30 yrs
- 1.0%
Air-quality risk 2/10 · Minimal
- Unhealthy air days now
- 1 days/yr
- Unhealthy air days in 30 yrs
- 2 days/yr
Risk factors via First Street. Map © Google.
Why this score? — see what drove the B grade
The composite is a weighted blend of 9 inputs, each scored 0–100. Each bar is that input's sub-score; the figure is the points it added to the 100-point composite (weight × sub-score).
- Cash flow +28.5/30.0
- ARV discount +12.6/15.0
- DSCR +10.0/10.0
- 1% rule +7.5/10.0
- Schools +4.3/10.0
- Livability +3.2/5.0
- Rent growth +2.5/5.0
- Condition / age +2.5/5.0
- Appreciation +0.0/10.0
$399,900
🖨 Deal sheet 📄 Offer letter ✓ Due diligence
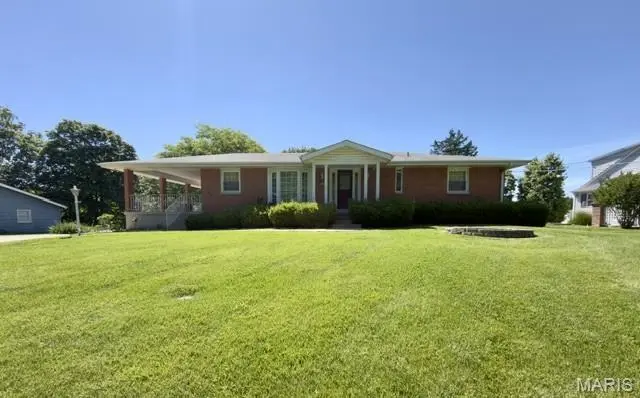
Listing remarks
Great opportunity to own 1.4 acres in Sunset Hills. Fantastic home that needs some cosmetic work on the inside. 3 bed 2 full 1 half bath ranch with huge covered side patio. Kitchen with breakfast room, separate dining room, living room with woodburning fireplace, family room, primary bedroom w half bath and two additional bedrooms. Lower level features walk out, rec room, large storage area, full bath and woodburning fireplace. 2 car Tuck under garage. Septic needs installation but permit granted. Great for a renovation or build your own custom home. No subdivision HOA. Annual road maintenance fee of $300.00. Property to be sold AS IS. Buyer to obtain any municipal occupancy permits if app
Key facts
- 1.4 acres
- Separate dining room
- Family room
Tags
Property features AI
Finance
- Other: Living area reported as 2,200 total (1,690 above grade); Lot approximately 1.4 acres
- HOA & community: Road-maintenance association (annual fee $300 covering maintenance of parking/roads)
Exterior
- Parking: 2-car garage with garage door opener
- Utilities: Public water available; Sewer not connected (septic needed); Electricity connected; Natural gas connected; Electric service described as Other
- Home design: Single-family residence (residential); One level
- Construction: Brick and vinyl siding exterior
- Exterior features: Covered patio and side porch; Private yard; Some trees on the property
Interior
- Kitchen: Kitchen on main level
- Bedrooms: 3 bedrooms, all on the main level
- Bathrooms: 2 full bathrooms; 1 half bathroom (main level); Additional full bathroom in the lower level
- Heating & cooling: Forced air heating (natural gas); Central air conditioning; Ceiling fans
- Interior features: Bay windows; Two fireplaces (living room and basement); Partially finished basement with walk-out access and storage; Basement includes a bathroom
- Laundry & utility: Laundry room (lower level)
Neighborhood map
What this means for you Summary
Snapshot
- This is a 3-bed/1.5-bath single-family listed at $400k.
Deal economics
- At list price, monthly cash flow is $1k ($16k/yr) — positive.
- The deal already cash-flows at list — no discount required.
- Meets the 1% rule at list price ($5k rent vs $400k).
- Recommended offer: $394k (1.5% below list) — sets the bar for market timing.
- Cap rate 10.2% vs local median 2.2% in Sunset Hills — top-decile yield for the area; either an underpriced asset or a hidden risk that comps aren't pricing in. Stress-test before assuming the spread holds.
Location & tenants
- Location reads 64/100 on livability (#317 in MO) — a middle-class / working-renter tenant base. Strengths: crime A+, employment A+, housing A+; Watch: amenities F, commute F, cost of living F.
- Lindbergh Schools (suburban): math 41% / reading 55% proficiency, ranked #38 of 324 in MO (top 12%) — families likely to look elsewhere, expect single-tenant / working-renter base with shorter leases; only 13% free/reduced lunch — higher-income household profile.
- Zoned schools: Concord Elem. School (math 43% / reading 62%, grade C-, #226 of 1,115 statewide, top 21%, 552 students, 10% FRL); Lindbergh Sr. High (math 56% / reading 70%, grade B-, #26 of 521 statewide, top 5%, 2,235 students, 12% FRL) — zoned schools at 11% FRL track the district average.
- Market conditions: 32 active listings in the ZIP; 1 comparable units currently listed for rent nearby; 920 units permitted in St. Louis County in 2024 (250 in 5+ unit buildings).
Forward outlook
- Local home prices are declining (-3.0%/yr); year-one equity from $3k of loan paydown is wiped out by about $12k of value loss. Plan a longer hold.
- At projected returns (-3.0% appreciation + 3.0% rent growth), your $112k cash investment doubles in ~9 years — after that, you're playing with house money.
Negotiation context
- It's been on market 22 days — a 2% lower offer ($394k) is reasonable based on typical stale-listing flexibility.
Questions for the listing agent
- Built in 1969 — when were the roof, HVAC, electrical panel, plumbing, and water heater last replaced?
- What does the HOA fee cover, when was the last increase, and are there any pending special assessments or reserve-fund shortfalls?
- Is there a deadline driving the sale (1031 exchange, divorce, estate, relocation)? That informs how much negotiation room exists.
- What's the average days-on-market for RENTAL listings here right now (not sales)? A rising rental-DOM trend means longer vacancies and softer asking-rent achievability than the comps imply.
- What's the recent tenant-quality profile in this submarket — average credit score on applications, eviction rate, late-payment / NSF rate, and stable-employment percentage? A property-management company in the area should have these aggregated.
- How much new for-sale + rental construction is in the pipeline within 1–3 miles? Heavy new supply typically softens prices + rents 12–24 months out; constrained supply supports both.
Investment metrics
- 1% rule
- 1.25% ✓
- Cap rate
- 10.20%
- Cash-on-cash
- 13.94%
- DSCR
- 1.62
- GRM
- 6.7
CMA / ARV
- ARV (median comp)
- $451,039
- List price
- $399,900
- Delta
- -11.34%
- Verdict
- UNDERPRICED
- Comps
- 10 within 1.0 mi
Show comp detail 1 sale within ~0.75 mi
| Address | Dist | Beds/Ba | Sqft | Sold | Price | $/sf | Match |
|---|---|---|---|---|---|---|---|
| 12820 Weber Hill Rd | 0.10mi | 3/2.0 | 1,505 (-11%) | 13mo | $385,000 | $256 | 64 |
Match score weights: distance 35% · size 25% · config 20% · recency 20%. Top-matched comps best support the ARV.
Projected returns pro-forma
-3.0% appreciation · 3.0% rent growth · sell at horizon
- IRR
- 4.2%
- Equity multiple
- 1.16×
- Total profit
- $18,058
- Equity at exit
- $59,626
- IRR
- 13.7%
- Equity multiple
- 2.09×
- Total profit
- $122,425
- Equity at exit
- $34,576
Cash invested: $111,972 (down + closing). Projections, not guarantees.
Landlord ↔ Tenant lean methodology
- Overall (STATE)
- 81 Strongly Landlord-Friendly
- State Missouri
- 81 Strongly Landlord-Friendly · R+10
- County
- — inherits STATE
- City
- — inherits STATE
ZIP-level market 63127
- Home prices YoY
- -28.1%
- Active inventory
- 32
- Price-to-rent
- 6.7×
Monthly cashflow live
- Estimated rent
- $4,995 medium interval (Pro) →
- Mortgage (P&I)
- −$2,097
- Tax from tax record
- −$356 /mo · $4,277/yr
- Insurance
- −$167
- HOA
- −$25
- Vacancy / Maint / Mgmt
- −$1,049
- Net cashflow
- $1,301
Break-even live
UW: 25.0% down · 7.5% · 30yr · 1.5% tax · 5.0% vac · 8.0% maint · 8.0% mgmt
Financing live
Cash to close
- Down payment
- $99,975
- Closing costs
- $11,997
- Reserves months
- —
- Total cash needed
- —
Loan-product check · same deal, 3 products live
Conventional
25% down · 7.5% · 30yr
- Down + closing
- —
- Monthly P&I
- —
- Monthly cashflow
- —
- DSCR
- —
- Eligible?
- —
Personal DTI + credit; lowest rate.
DSCR
20% down · 8.5% · 30yr
- Down + closing
- —
- Monthly P&I
- —
- Monthly cashflow
- —
- DSCR
- —
- Eligible?
- —
No personal income docs; deal must DSCR.
Hard money
10% down · 12.0% · 12mo
- Down + closing
- —
- Monthly P&I
- —
- Monthly cashflow
- —
- DSCR
- —
- Eligible?
- —
Short-term bridge; refi at stabilization.
Rent comps 1 comps
| Address | Beds | Baths | Sqft | Rent | $/sqft | DOM | Units | Dist |
|---|---|---|---|---|---|---|---|---|
| 342 Fury Dr Fenton, MO | 4.0 | 3.0 | 2188 | $4,995 | $2.28 | 1d | 1 | 1.47mi |
HOA detail
- Monthly dues
- $25 · $300/yr
Listing history 6 events
-
2026-06-07statusdays on market $399,900 Pending 22 DOM
-
2026-06-03days on market $399,900 Active 19 DOM
-
2026-06-02days on market $399,900 Active 18 DOM
-
2026-06-01days on market $399,900 Active 17 DOM
-
2026-05-31days on market $399,900 Active 16 DOM
-
2026-05-15$399,900 Active 717-char remark
ⓘ Source: listings_history table (triggers on properties + properties_extension) + one-shot
backfill from property_details.listing_events for pre-trigger history.
Tax reassessment forecast MO · Resets to sale price
- Current annual tax
- $4,277 · $356/mo
- Projected year-2 tax
- $4,277 · $356/mo
- Expected delta
- $0/yr ($0/mo · 0.0%)
ⓘ Screening estimate from a state-policy table — verify with the county assessor before closing.
Climate risk First Street
- Flood 1/10 Low FEMA zone X (unshaded) · 0% chance over 30 yrs
- Wildfire 3/10 Moderate
- Heat 4/10 Moderate 7 d/yr ≥107°F today · 20 d/yr by 30 yrs out
- Wind 2/10 Low 100% chance of damaging wind over 30 yrs
- Air quality 2/10 Low 1 unhealthy d/yr today · 2 by 30 yrs out
Nearby sold comps map
Loading sold comps map…
Walkable amenities ~0.75 mi
Loading nearby amenities…
Taxation est. · year 1
- Rental income
- $59,940
- − Mortgage interest
- −$22,401
- − Property taxes
- −$4,277
- − Insurance
- −$2,000
- − Repairs & maintenance
- −$4,795
- − Management
- −$4,795
- − HOA
- −$300
- − Depreciation
- −$11,633
- Taxable income
- $9,739
- Est. tax owed @ 24.0%
- −$2,337
- After-tax cash flow
- $13,274/yr
For passive investors: Depreciation is non-cash, so a rental often shows a tax loss while cash-flowing — sheltering income. Rental losses are passive: they offset passive income freely, and up to $25,000/yr can offset ordinary (W-2) income if you actively participate and your MAGI is under $100k (phasing out to $0 by $150k); unused losses carry forward. On sale, claimed depreciation is recaptured at up to 25%, and gains may owe capital-gains tax (a 1031 exchange can defer both). Figures are a year-1 estimate at your 24.0% rate — not tax advice; consult a CPA.
Schools (NCES district)
- District
- Lindbergh Schools
- NCES district ID
- 2918690
- Math proficiency
- 41% ▼ -18.00%
- Reading proficiency
- 55% ▼ -9.00%
- Median HH income
- $66,145
- Composite
- 42.62/100
- National rank
- #3186
- State rank
- #38 of 324 in MO
Livability — Sunset Hills
- Score
- 64/100
- State rank
- #317
- US rank
- #14539
Category grades
Schools grade is shown separately in the Schools card above.
Census & demographics
- Census place
- Sunset Hills, MO
- City population
- 5,161
- Population (ZIP)
- 5,161
Population outlook (St. Louis County) Hauer SSP2
- Today (2025)
- 1,025,227 people
- By 2030
- 1,028,023 · +0.3%
- By 2040
- 1,020,940 · -0.4%
- By 2050
- 1,007,280 · -1.8%
- By 2075
- 987,277 · -3.7%
- By 2100
- 921,984 · -10.1%
Race, ethnicity, and origin ACS 2023
- Neighborhood character
- Predominantly White (93%)
- Race & ethnicity
- White 93% Two or more races 5% Black 2%
- Common ancestry
- Lithuanian 5% Romanian 2% Slovak 2%
- Foreign-born
- 2% · Canada, China
- Languages at home
- 97% English-only · Spanish 1% Russian/Polish/Slavic 1%
Political lean MEDSL · St. Louis
- 2024 margin
- Strong D (+23.4) · D 60.8% · R 37.4% · Other 1.7%
- 2008→2024 swing
- +3.5pp toward D · 2008: 19.9pp · 2024: 23.4pp
- All cycles
- 2024: D+23.4 2020: D+24.0 2016: D+16.2 2012: D+13.7 2008: D+19.9
Not yet ingested
- Civics
- —
Market trends
- HPI YoY
- ▼ -88.60%
- Current HPI
- 226.4546
- Rent YoY
- —
- Metro
- —
- State GDP YoY
- ▲ 1.84%
- F500 in state
- 20
Industry mix (Fortune 500 HQ in MO)
| Industry | F500 HQs | Revenue |
|---|---|---|
| Healthcare | 1 | $163B |
|
||
| Insurance | 1 | $21B |
|
||
| Industrial Technology | 1 | $17B |
|
||
| Retail | 1 | $16B |
|
||
| Industrial Distribution | 1 | $10B |
|
||
| Utilities | 1 | $9B |
|
||
Price history
2 events — show timeline
- 2026-06-07 Pending — MARIS as Distributed by MLS Grid
- 2026-05-15 Listed $399,900 MARIS as Distributed by MLS Grid
Property tax history
+6.4%/yrLatest (2022): $4,277 · +0.5% YoY. Source: county tax records.
Cash-flow waterfall
monthlySold comps — $/sqft
last 12 mo · ≤1 miLoading sold comps…