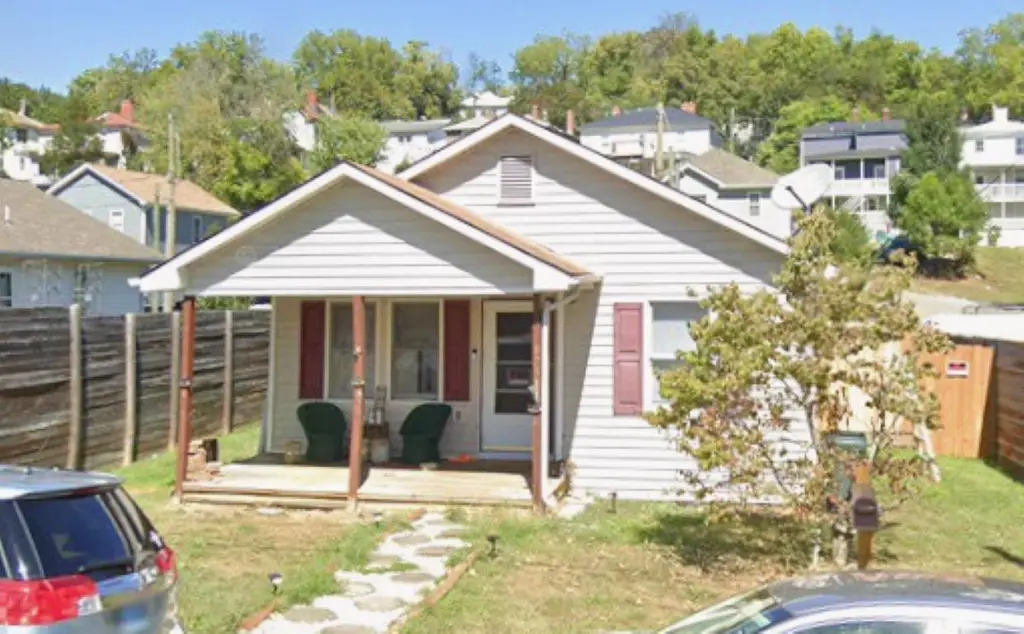
875 Johnson St W · Staunton, VA
Flood risk 8/10 · Major
- FEMA flood zone
- X (unshaded)
- Chance of flooding over 30 yrs
- 0.99%
- Est. flood insurance / yr
- $473 – $860
Fire risk 3/10 · Minor
- Est. fire insurance / yr
- $666 – $1,236
Heat risk 4/10 · Minor
- Hot days now (above 100°F)
- 7 days/yr
- Hot days in 30 yrs
- 19 days/yr
Wind risk 2/10 · Minimal
- Chance of severe wind over 30 yrs
- 1.0%
Air-quality risk 1/10 · Minimal
- Unhealthy air days now
- 0 days/yr
- Unhealthy air days in 30 yrs
- 0 days/yr
Risk factors via First Street. Map © Google.
Why this score? — see what drove the D+ grade
The composite is a weighted blend of 9 inputs, each scored 0–100. Each bar is that input's sub-score; the figure is the points it added to the 100-point composite (weight × sub-score).
- Cash flow +13.3/30.0
- ARV discount +12.2/15.0
- Schools +4.8/10.0
- DSCR +4.0/10.0
- Livability +4.0/5.0
- Rent growth +3.9/5.0
- 1% rule +3.0/10.0
- Condition / age +2.5/5.0
- Appreciation +0.0/10.0
$210,000
🖨 Deal sheet (PDF) 📄 Offer letter ✓ Due diligence
Listing remarks MLS
Location, Location, Location. Within walking distance to downtown Staunton and Mary Baldwin University this well maintained one story home is a Staunton GEM! Recently updated ready for the next owner to move right in. The fully fenced in back yard is perfect for all of your two and four legged friends. Not to mention the newly built back patio. Come and take a look at this beauty before its too late.
Key facts
- 5,227 sq ft lot
- Built 1999
Property features AI
Exterior
- Security: Surveillance system
- Utilities: Public water; Public sewer; Cable available; Fiber optic available
- Home design: Detached single-family home; One story
- Construction: Stick-built construction; Block foundation
- Exterior features: 0.12-acre lot
Interior
- Kitchen: Main-level kitchen
- Bedrooms: Three main-level bedrooms; Primary bedroom on the main level
- Bathrooms: One main-level full bathroom
- Heating & cooling: Heat pump for heating and cooling
- Interior features: Primary bedroom located on the main floor; Living room; Dining room
- Laundry & utility: Main-level laundry
Neighborhood map
What this means for you Summary
Snapshot
- This is a 3-bed/1.0-bath single-family listed at $210k.
Deal economics
- At list price, monthly cash flow is $-54 ($-650/yr) — negative.
- To cash-flow at today's rent, offer at most $200k (4.6% below list).
- To meet the 1% rule (rent ≥ 1% of price), the offer needs to be $168k (20.0% below list).
- Recommended offer: $168k (20.0% below list) — sets the bar for 1% rule.
- Cap rate 6.3% vs local median 3.0% in Staunton — top-decile yield for the area; either an underpriced asset or a hidden risk that comps aren't pricing in. Stress-test before assuming the spread holds.
Location & tenants
- Location reads 81/100 on livability (#56 in VA, #1,524 nationally) — a professional / high-income tenant draw. Strengths: cost of living A+, housing A+, health & safety A+; Watch: commute F.
- Staunton City Public School District (urban): math 48% / reading 67% proficiency, ranked #73 of 131 in VA (top 56%) — acceptable for families but not a draw, mixed tenant base, ~2y average lease.
- Zoned schools: Bessie Weller Elementary (math 42% / reading 57%, grade D, #742 of 1,108 statewide, top 70%, 369 students, 99% FRL); Shelburne Middle (math 43% / reading 66%, grade B-, #194 of 342 statewide, top 60%, 574 students, 99% FRL); Staunton High (math 48% / reading 77%, grade B-, #226 of 319 statewide, top 72%, 822 students, 99% FRL) — zoned schools average 99% FRL vs 47% district-wide (52 pts higher); higher-poverty schools than district average — tighter screening recommended.
- Market conditions: Rents rising fast (+5.8%/yr); 303 active listings in the ZIP; 5 comparable units currently listed for rent nearby; rentals lingering (median 46d on market — plan ~5-8 weeks vacancy on turnover, expect pricing pressure); 100% of comp listings sitting > 30 days — soft ceiling on asking rent; 71 units permitted in Staunton city in 2024 (20 in 5+ unit buildings).
- This rent runs 30% of the median local income ($66k/yr) — at the standard rent-burdened threshold; future hikes will face affordability resistance.
Forward outlook
- Local home prices are declining (-3.0%/yr); year-one equity from $1k of loan paydown is wiped out by about $6k of value loss. Plan a longer hold.
- Staunton County population projected at +9% by 2050 — modest demand growth; plan on rents tracking national, not racing it.
Negotiation context
- Only 1 days on market — expect competitive offers; lowballing is unlikely to land.
- 3 sale attempts since 7y ago with the ask held roughly flat each time — persistent listings suggest the price (not the market) is what's stuck; bring a comps-based counter.
- Current owner paid $182k; 15% above their basis — modest negotiation headroom, anchor on the comps not their cost.
Risks & watch-outs
- Watch-outs: flood insurance adds $56/mo.
- Climate carrying-cost: severe flood risk — expect insurance premiums to compound above CPI over the hold.
Questions for the listing agent
- What do current leases actually rent for vs. the listed asking? Can we see a recent rent roll and the last 12 months of T-12 income?
- What's the actual annual flood-insurance premium (NFIP or private), and is the property in a SFHA with mandatory coverage?
- Is there a deadline driving the sale (1031 exchange, divorce, estate, relocation)? That informs how much negotiation room exists.
- Schools are A-rated — typically a magnet for longer-tenancy family renters. What's the average tenant stay here, and is there a school-zone premium baked into asking?
- The area grade is low — what's the realistic commute time and amenity access for the typical tenant pool here? Any planned neighborhood developments (good or bad) we should know about?
- What's the average days-on-market for RENTAL listings here right now (not sales)? A rising rental-DOM trend means longer vacancies and softer asking-rent achievability than the comps imply.
- What's the recent tenant-quality profile in this submarket — average credit score on applications, eviction rate, late-payment / NSF rate, and stable-employment percentage? A property-management company in the area should have these aggregated.
- How much new for-sale + rental construction is in the pipeline within 1–3 miles? Heavy new supply typically softens prices + rents 12–24 months out; constrained supply supports both.
Investment metrics
- 1% rule
- 0.80% ✗
- Cap rate
- 6.30%
- Cash-on-cash
- 0.03%
- DSCR
- 1.00
- GRM
- 10.4
CMA / ARV
- ARV (on-the-fly)
- $234,568
- Comps found
- 12
Show comp detail 12 sales within ~0.75 mi
| Address | Dist | Beds/Ba | Sqft | Sold | Price | $/sf | Match |
|---|---|---|---|---|---|---|---|
| 1323 Jackson St | 0.29mi | 3/2.0 | 1,088 (+1%) | 7mo | $100,000 | $92 | 75 |
| 102 W Liberty St | 0.52mi | 3/2.0 | 1,080 (+0%) | 5mo | $235,000 | $218 | 67 |
| 321 Westwood Blvd | 0.32mi | 3/2.0 | 996 (-7%) | 2mo | $255,000 | $256 | 67 |
| 324 Green St | 0.16mi | 2/1.5 (-1) | 960 (-11%) | 3mo | $175,000 | $182 | 65 |
| 1127 Johnson St W | 0.14mi | 2/1.5 (-1) | 1,224 (+14%) | 5mo | $195,000 | $159 | 59 |
| 216 Thompson St | 0.50mi | 3/2.0 | 1,150 (+7%) | 5mo | $263,900 | $229 | 57 |
| 1640 Buick St | 0.73mi | 3/2.0 | 1,088 (+1%) | 8mo | $140,000 | $129 | 54 |
| 501 Hays Ave | 0.62mi | 3/2.0 | 1,154 (+7%) | 5mo | $195,000 | $169 | 51 |
| 315 Austin Ave | 0.55mi | 3/1.0 | 1,190 (+11%) | 7mo | $150,000 | $126 | 51 |
| 100 Olive St | 0.72mi | 3/2.0 | 1,000 (-7%) | 3mo | $232,500 | $233 | 48 |
| 802 Burwell Ave | 0.73mi | 2/2.5 (-1) | 1,108 (+3%) | 4mo | $299,900 | $271 | 46 |
| 6 Mcarthur St | 0.57mi | 3/2.0 | 1,200 (+12%) | 8mo | $289,490 | $241 | 43 |
Match score weights: distance 35% · size 25% · config 20% · recency 20%. Top-matched comps best support the ARV.
Projected returns pro-forma
-3.0% appreciation · 5.77% rent growth · sell at horizon
- IRR
- -15.2%
- Equity multiple
- 0.44×
- Total profit
- $-32,687
- Equity at exit
- $31,312
- IRR
- -2.7%
- Equity multiple
- 0.79×
- Total profit
- $-12,087
- Equity at exit
- $18,157
Cash invested: $58,800 (down + closing). Projections, not guarantees.
Landlord ↔ Tenant lean methodology
- Overall (STATE)
- 55 Moderately Landlord-Leaning
- State Virginia
- 55 Moderately Landlord-Leaning · D+2
- County
- — inherits STATE
- City
- — inherits STATE
ZIP-level market 24401
- Rents YoY
- 5.8%
- Active inventory
- 303
- Price-to-rent
- 10.4×
Monthly cashflow live
- Estimated rent
- $1,679 high interval (Pro) →
- Mortgage (P&I)
- −$1,101
- Tax from tax record
- −$136 /mo · $1,638/yr
- Insurance
- −$88
- Flood insurance flood zone
- −$56 /mo · $666/yr
- HOA
- −$0
- Vacancy / Maint / Mgmt
- −$353
- Net cashflow
- $-54
Break-even live
Sensitivity live
| Price | -10% $65 | -5% $5 | +0% $-54 | +5% $-114 | +10% $-173 |
|---|---|---|---|---|---|
| Rent | -10% $-187 | -5% $-120 | +0% $-54 | +5% $12 | +10% $78 |
| Rate | -1.0pp $52 | -0.5pp $-1 | base $-54 | +0.5pp $-109 | +1.0pp $-164 |
UW: 25.0% down · 7.5% · 30yr · 1.5% tax · 5.0% vac · 8.0% maint · 8.0% mgmt
Financing live
Cash to close
- Down payment
- $52,500
- Closing costs
- $6,300
- Reserves months
- —
- Total cash needed
- —
Loan-product check · same deal, 3 products live
Conventional
25% down · 7.5% · 30yr
- Down + closing
- —
- Monthly P&I
- —
- Monthly cashflow
- —
- DSCR
- —
- Eligible?
- —
Personal DTI + credit; lowest rate.
DSCR
20% down · 8.5% · 30yr
- Down + closing
- —
- Monthly P&I
- —
- Monthly cashflow
- —
- DSCR
- —
- Eligible?
- —
No personal income docs; deal must DSCR.
Hard money
10% down · 12.0% · 12mo
- Down + closing
- —
- Monthly P&I
- —
- Monthly cashflow
- —
- DSCR
- —
- Eligible?
- —
Short-term bridge; refi at stabilization.
Rent comps 5 comps
| Address | Beds | Baths | Sqft | Rent | $/sqft | DOM | Units | Dist |
|---|---|---|---|---|---|---|---|---|
| 1013 Seth Dr Unit 702 Staunton, VA | 3.0 | 2.0 | 1300 | $1,800 | $1.38 | 45d | 1 | 0.48mi |
| 1008 Seth Dr Staunton, VA | 3.0 | 2.0 | 1300 | $1,750 | $1.35 | 45d | 1 | 0.62mi |
| 315 Kalorama St Staunton, VA | 2.0 | 1.0 | 1000 | $850 | $0.85 | 45d | 1 | 0.68mi |
| 818 N Augusta St Staunton, VA | 2.0 | 2.0 | 1280 | $1,995 | $1.56 | 45d | 1 | 0.75mi |
| 2504 Hickory St Unit A Staunton, VA | 2.0 | 2.0 | 1012 | $1,450 | $1.43 | 45d | 1 | 1.32mi |
Listing history 2 events
-
2026-06-17remarks 399-char remark
-
2026-06-17$210,000 Pending 1 DOM
ⓘ Source: listings_history table (triggers on properties + properties_extension) + one-shot
backfill from property_details.listing_events for pre-trigger history.
Tax reassessment forecast VA · Resets to sale price
- Current annual tax
- $1,638 · $136/mo
- Projected year-2 tax
- $1,722 · $144/mo
- Expected delta
- +$84/yr (+$7/mo · 5.1%)
ⓘ Screening estimate from a state-policy table — verify with the county assessor before closing.
Climate risk First Street
- Flood 8/10 Severe FEMA zone X (unshaded) · 99% chance over 30 yrs
- Wildfire 3/10 Moderate
- Heat 4/10 Moderate 7 d/yr ≥100°F today · 19 d/yr by 30 yrs out
- Wind 2/10 Low 100% chance of damaging wind over 30 yrs
- Air quality 1/10 Low 0 unhealthy d/yr today · 0 by 30 yrs out
Nearby sold comps map
Loading sold comps map…
Walkable amenities ~0.75 mi
Loading nearby amenities…
Taxation est. · year 1
- Rental income
- $20,151
- − Mortgage interest
- −$11,763
- − Property taxes
- −$1,638
- − Insurance
- −$1,716
- − Repairs & maintenance
- −$1,612
- − Management
- −$1,612
- − Depreciation
- −$6,109
- Taxable loss
- −$4,300
- Est. tax savings @ 24.0%
- +$1,032
- After-tax cash flow
- $382/yr
For passive investors: Depreciation is non-cash, so a rental often shows a tax loss while cash-flowing — sheltering income. Rental losses are passive: they offset passive income freely, and up to $25,000/yr can offset ordinary (W-2) income if you actively participate and your MAGI is under $100k (phasing out to $0 by $150k); unused losses carry forward. On sale, claimed depreciation is recaptured at up to 25%, and gains may owe capital-gains tax (a 1031 exchange can defer both). Figures are a year-1 estimate at your 24.0% rate — not tax advice; consult a CPA.
Schools (NCES district)
- District
- Staunton City Public School District
- NCES district ID
- 5103690
- Math proficiency
- 48% ▼ -33.00%
- Reading proficiency
- 67% ▼ -6.00%
- Median HH income
- $42,712
- Composite
- 48.23/100
- National rank
- #2163
- State rank
- #73 of 131 in VA
Livability — Staunton
- Score
- 81/100
- State rank
- #56
- US rank
- #1524
Category grades
Schools grade is shown separately in the Schools card above.
Census & demographics
- Census place
- Staunton, VA
- County
- Staunton City · 38,756 people
- City population
- 38,756
- Metro
- Staunton, VA
- Population (ZIP)
- 38,756
- Household income
- $66,300
- Rent vs Own
- Severe rent burden
- 1306.0
Population outlook (Staunton County) Hauer SSP2
- Today (2025)
- 25,515 people
- By 2030
- 26,060 · +2.1%
- By 2040
- 27,024 · +5.9%
- By 2050
- 27,926 · +9.4%
- By 2075
- 29,334 · +15.0%
- By 2100
- 29,046 · +13.8%
Race, ethnicity, and origin ACS 2023
- Neighborhood character
- Predominantly White (83%)
- Race & ethnicity
- White 83% Black 8% Two or more races 5% Hispanic / Latino 4% Asian 1%
- Common ancestry
- Italian 3% Serbian 3% Slovak 2%
- Foreign-born
- 3% · Canada
- Languages at home
- 95% English-only · Spanish 3% Other Indo-European 1% French/Haitian/Cajun 0%
Political lean MEDSL · Staunton
- 2024 margin
- D (+13.4) · D 56.0% · R 42.6% · Other 1.4%
- 2008→2024 swing
- +11.2pp toward D · 2008: 2.2pp · 2024: 13.4pp
- All cycles
- 2024: D+13.4 2020: D+9.9 2016: D+1.8 2012: D+4.1 2008: D+2.2
Not yet ingested
- Civics
- —
Market trends
- HPI YoY
- ▼ -283.01%
- Current HPI
- 210.049
- Rent YoY
- ▲ 5.77%
- Metro
- Staunton, VA
- State GDP YoY
- ▲ 2.40%
- F500 in state
- 50
Industry mix (Fortune 500 HQ in VA)
| Industry | F500 HQs | Revenue |
|---|---|---|
| Aerospace / Defense | 4 | $236B |
|
||
| Technology / Defense | 3 | $32B |
|
||
| Financial Services | 2 | $176B |
|
||
| Utilities | 2 | $27B |
|
||
| Insurance | 2 | $25B |
|
||
| Technology | 2 | $15B |
|
||
Price history
+90.9% since first listed9 events — show timeline
- 2026-06-17 Pending — GAAR
- 2026-06-17 Listed $210,000 GAAR
- 2023-04-04 Sold (Public Records) $182,000 Public Records
- 2023-04-03 Sold (MLS) $182,000 GAAR
- 2023-02-22 Pending — GAAR
- 2023-01-19 Listed $182,500 GAAR
- 2019-05-01 Sold (Public Records) $110,000 Public Records
- 2019-05-01 Sold (MLS) $110,000 GAAR
- 2019-01-26 Listed $110,000 GAAR
Property tax history
+5.4%/yrLatest (2025): $1,638 · +24.4% YoY. Source: county tax records.
Cash-flow waterfall
monthlySold comps — $/sqft
last 12 mo · ≤1 miLoading sold comps…