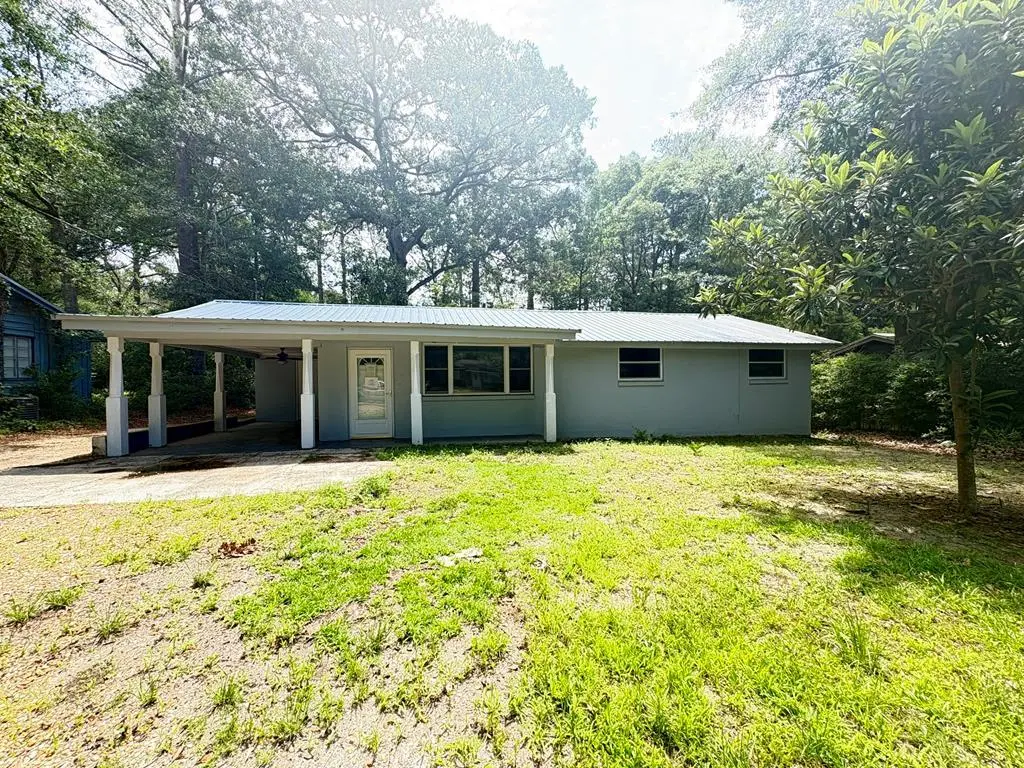
420 Glen Arven Dr · Thomasville, GA
Flood risk 1/10 · Minimal
- FEMA flood zone
- X (unshaded)
- Chance of flooding over 30 yrs
- 0.0%
- Est. flood insurance / yr
- $507 – $1,088
Fire risk 4/10 · Minor
- Est. fire insurance / yr
- $963 – $1,789
Heat risk 7/10 · Major
- Hot days now (above 108°F)
- 7 days/yr
- Hot days in 30 yrs
- 19 days/yr
Wind risk 8/10 · Major
- Chance of severe wind over 30 yrs
- 99.0%
Air-quality risk 5/10 · Moderate
- Unhealthy air days now
- 8 days/yr
- Unhealthy air days in 30 yrs
- 8 days/yr
Risk factors via First Street. Map © Google.
Why this score? — see what drove the B grade
The composite is a weighted blend of 9 inputs, each scored 0–100. Each bar is that input's sub-score; the figure is the points it added to the 100-point composite (weight × sub-score).
- Cash flow +30.0/30.0
- ARV discount +15.0/15.0
- DSCR +10.0/10.0
- 1% rule +7.5/10.0
- Livability +3.6/5.0
- Schools +2.7/10.0
- Rent growth +2.5/5.0
- Condition / age +2.5/5.0
- Appreciation +0.0/10.0
$128,950
🖨 Deal sheet 📄 Offer letter ✓ Due diligence
Listing remarks MLS
Charming 3-bedroom, 1-bath home offering comfort, convenience, and value! This inviting property features a spacious kitchen and dining room combination, creating the perfect space for everyday living and entertaining. Situated on a great-sized lot with plenty of outdoor potential. Priced to sell, this home is an excellent opportunity for first-time buyers, investors, or anyone looking for an affordable place to call home. Don't miss out on this wonderful value!
Key facts
- 0.31 acre lot
- Built 1958
- Listed 16 days
Property features AI
Exterior
- Parking: Carport; 1 covered parking space; Open parking available
- Utilities: Sewer connected; Water connected
- Home design: Single family residence; One level / single-story; Residential property
- Construction: Block construction; Slab foundation; Built as single-story
- Exterior features: Porch; Metal roof
Interior
- Flooring: Laminate
- Bathrooms: 1 full bathroom
- Heating & cooling: Central heating; Ceiling fan(s)
- Interior features: Laminate flooring; Ceiling fan(s); Central heating; Porch
- Laundry & utility: Dedicated laundry room
Neighborhood map
What this means for you Summary
Snapshot
- This is a 3-bed/1.0-bath single-family listed at $129k.
Deal economics
- At list price, monthly cash flow is $522 ($6k/yr) — positive.
- The deal already cash-flows at list — no discount required.
- Meets the 1% rule at list price ($2k rent vs $129k).
- Recommended offer: $127k (1.5% below list) — sets the bar for market timing.
- Cap rate 11.2% vs local median 3.7% in Thomasville — top-decile yield for the area; either an underpriced asset or a hidden risk that comps aren't pricing in. Stress-test before assuming the spread holds.
Location & tenants
- Location reads 71/100 on livability (#77 in GA) — a middle-class / working-renter tenant base. Strengths: amenities A+, cost of living A+, health & safety A+; Watch: schools D, crime F, commute F.
- Thomasville City (town): math 29% / reading 37% proficiency, ranked #87 of 174 in GA (top 50%) — families likely to look elsewhere, expect single-tenant / working-renter base with shorter leases; 60% free/reduced lunch — lower-income household profile, screen leases tightly.
- Market conditions: 203 active listings in the ZIP; 3 comparable units currently listed for rent nearby; rentals lingering (median 44d on market — plan ~5-8 weeks vacancy on turnover, expect pricing pressure); 100% of comp listings sitting > 30 days — soft ceiling on asking rent; 213 units permitted in Thomas County in 2024 (72 in 5+ unit buildings).
- This rent runs 38% of the median local income ($50k/yr) — at the standard rent-burdened threshold; future hikes will face affordability resistance.
Forward outlook
- Local home prices are declining (-3.0%/yr); year-one equity from $892 of loan paydown is wiped out by about $4k of value loss. Plan a longer hold.
- Thomas County population projected to shrink 7% by 2050 — rents likely to lag national; underwrite the cash flow, not the appreciation.
- At projected returns (-3.0% appreciation + 3.0% rent growth), your $36k cash investment doubles in ~7 years — after that, you're playing with house money.
Negotiation context
- It's been on market 17 days — a 2% lower offer ($127k) is reasonable based on typical stale-listing flexibility.
- 6 sale attempts since 3y ago with the ask held roughly flat each time — persistent listings suggest the price (not the market) is what's stuck; bring a comps-based counter.
Risks & watch-outs
- Watch-outs: built in 1958 — expect roof / HVAC / electrical / plumbing capex.
- Climate carrying-cost: severe wind risk, 99% chance of damaging wind over 30y; extreme-heat days projected 7→19/yr by 2055 (HVAC capex compounding) — expect insurance premiums to compound above CPI over the hold.
Questions for the listing agent
- Built in 1958 — when were the roof, HVAC, electrical panel, plumbing, and water heater last replaced?
- Is there a deadline driving the sale (1031 exchange, divorce, estate, relocation)? That informs how much negotiation room exists.
- Schools are D-rated, which usually means shorter tenancies and higher turnover. Who's the typical renter profile here, and what's been the actual vacancy rate?
- Crime grade is F in this area — have there been break-ins, vandalism, or insurance claims at this property in the last 3 years? What carrier currently insures it and at what premium?
- What's the average days-on-market for RENTAL listings here right now (not sales)? A rising rental-DOM trend means longer vacancies and softer asking-rent achievability than the comps imply.
- What's the recent tenant-quality profile in this submarket — average credit score on applications, eviction rate, late-payment / NSF rate, and stable-employment percentage? A property-management company in the area should have these aggregated.
- How much new for-sale + rental construction is in the pipeline within 1–3 miles? Heavy new supply typically softens prices + rents 12–24 months out; constrained supply supports both.
Investment metrics
- 1% rule
- 1.25% ✓
- Cap rate
- 11.15%
- Cash-on-cash
- 17.36%
- DSCR
- 1.77
- GRM
- 6.7
CMA / ARV
- ARV (on-the-fly)
- $196,020
- Comps found
- 4
Show comp detail 4 sales within ~0.75 mi
| Address | Dist | Beds/Ba | Sqft | Sold | Price | $/sf | Match |
|---|---|---|---|---|---|---|---|
| 414 Glen Arven Dr | 0.05mi | 3/2.0 | 1,190 (+0%) | 14mo | $165,850 | $139 | 82 |
| 1608 Redwood Trl | 0.38mi | 3/2.0 | 1,232 (+4%) | 12mo | $245,000 | $199 | 62 |
| 334 Woodridge Trl | 0.44mi | 3/2.0 | 1,269 (+7%) | 9mo | $154,000 | $121 | 57 |
| 502 Tanglewood Dr | 0.14mi | 3/2.0 | 1,312 (+10%) | 20mo | $216,000 | $165 | 55 |
Match score weights: distance 35% · size 25% · config 20% · recency 20%. Top-matched comps best support the ARV.
Projected returns pro-forma
-3.0% appreciation · 3.0% rent growth · sell at horizon
- IRR
- 8.7%
- Equity multiple
- 1.34×
- Total profit
- $12,303
- Equity at exit
- $19,227
- IRR
- 17.9%
- Equity multiple
- 2.48×
- Total profit
- $53,292
- Equity at exit
- $11,149
Cash invested: $36,106 (down + closing). Projections, not guarantees.
Landlord ↔ Tenant lean methodology
- Overall (STATE)
- 90 Strongly Landlord-Friendly
- State Georgia
- 90 Strongly Landlord-Friendly · R+3
- County
- — inherits STATE
- City
- — inherits STATE
ZIP-level market 31792
- Home prices YoY
- -29.0%
- Active inventory
- 203
- Price-to-rent
- 6.7×
Monthly cashflow live
- Estimated rent
- $1,613 medium interval (Pro) →
- Mortgage (P&I)
- −$676
- Tax from tax record
- −$22 /mo · $268/yr
- Insurance
- −$54
- HOA
- −$0
- Vacancy / Maint / Mgmt
- −$339
- Net cashflow
- $522
Break-even live
UW: 25.0% down · 7.5% · 30yr · 1.5% tax · 5.0% vac · 8.0% maint · 8.0% mgmt
Financing live
Cash to close
- Down payment
- $32,238
- Closing costs
- $3,868
- Reserves months
- —
- Total cash needed
- —
Loan-product check · same deal, 3 products live
Conventional
25% down · 7.5% · 30yr
- Down + closing
- —
- Monthly P&I
- —
- Monthly cashflow
- —
- DSCR
- —
- Eligible?
- —
Personal DTI + credit; lowest rate.
DSCR
20% down · 8.5% · 30yr
- Down + closing
- —
- Monthly P&I
- —
- Monthly cashflow
- —
- DSCR
- —
- Eligible?
- —
No personal income docs; deal must DSCR.
Hard money
10% down · 12.0% · 12mo
- Down + closing
- —
- Monthly P&I
- —
- Monthly cashflow
- —
- DSCR
- —
- Eligible?
- —
Short-term bridge; refi at stabilization.
Rent comps 3 comps
| Address | Beds | Baths | Sqft | Rent | $/sqft | DOM | Units | Dist |
|---|---|---|---|---|---|---|---|---|
| 124 Ginny Ln Thomasville, GA | 2.0–3.0 | 2.0 | 854 | $1,300 | $1.52 | 43d | 2 | 0.52mi |
| 105 Old Boston Rd Thomasville, GA | 3.0 | 2.0 | 1200 | $1,374 | $1.15 | 43d | 1 | 0.59mi |
| 220 Covington Ave Thomasville, GA | 1.0–3.0 | 1.0–2.0 | 1014 | $1,350 | $1.33 | 43d | 10 | 1.27mi |
Listing history 13 events
-
2026-06-19days on market $128,950 Active 17 DOM
-
2026-06-18days on market $128,950 Active 16 DOM
-
2026-06-17days on market $128,950 Active 15 DOM
-
2026-06-16days on market $128,950 Active 14 DOM
-
2026-06-15days on market $128,950 Active 13 DOM
-
2026-06-14days on market $128,950 Active 11 DOM
-
2026-06-12days on market $128,950 Active 10 DOM
-
2026-06-09days on market $128,950 Active 7 DOM
-
2026-06-08days on market $128,950 Active 6 DOM
-
2026-06-07days on market $128,950 Active 5 DOM
-
2026-06-07days on market $128,950 Active 4 DOM
-
2026-06-03remarks 466-char remark
-
2026-06-03$128,950 Active 1 DOM
ⓘ Source: listings_history table (triggers on properties + properties_extension) + one-shot
backfill from property_details.listing_events for pre-trigger history.
Tax reassessment forecast GA · Resets to sale price
- Current annual tax
- $268 · $22/mo
- Projected year-2 tax
- $1,186 · $99/mo
- Expected delta
- +$919/yr (+$77/mo · 343.2%)
ⓘ Screening estimate from a state-policy table — verify with the county assessor before closing.
Climate risk First Street
- Flood 1/10 Low FEMA zone X (unshaded) · 0% chance over 30 yrs
- Wildfire 4/10 Moderate
- Heat 7/10 Severe 7 d/yr ≥108°F today · 19 d/yr by 30 yrs out
- Wind 8/10 Severe 99% chance of damaging wind over 30 yrs
- Air quality 5/10 Major 8 unhealthy d/yr today · 8 by 30 yrs out
Nearby sold comps map
Loading sold comps map…
Walkable amenities ~0.75 mi
Loading nearby amenities…
Taxation est. · year 1
- Rental income
- $19,359
- − Mortgage interest
- −$7,223
- − Property taxes
- −$268
- − Insurance
- −$645
- − Repairs & maintenance
- −$1,549
- − Management
- −$1,549
- − Depreciation
- −$3,751
- Taxable income
- $4,375
- Est. tax owed @ 24.0%
- −$1,050
- After-tax cash flow
- $5,217/yr
For passive investors: Depreciation is non-cash, so a rental often shows a tax loss while cash-flowing — sheltering income. Rental losses are passive: they offset passive income freely, and up to $25,000/yr can offset ordinary (W-2) income if you actively participate and your MAGI is under $100k (phasing out to $0 by $150k); unused losses carry forward. On sale, claimed depreciation is recaptured at up to 25%, and gains may owe capital-gains tax (a 1031 exchange can defer both). Figures are a year-1 estimate at your 24.0% rate — not tax advice; consult a CPA.
Schools (NCES district)
- District
- Thomasville City
- NCES district ID
- 1304950
- Math proficiency
- 29% ▼ -6.00%
- Reading proficiency
- 37% ▼ -8.00%
- Median HH income
- $31,040
- Composite
- 26.85/100
- National rank
- #7106
- State rank
- #87 of 174 in GA
Livability — Thomasville
- Score
- 71/100
- State rank
- #77
- US rank
- #6678
Category grades
Schools grade is shown separately in the Schools card above.
Census & demographics
- Census place
- Thomasville, GA
- County
- Thomas County · 22,962 people
- City population
- 22,962
- Metro
- Thomasville, GA
- Population (ZIP)
- 22,962
- Household income
- $50,460
- Rent vs Own
- Severe rent burden
- 1059.0
Population outlook (Thomas County) Hauer SSP2
- Today (2025)
- 45,303 people
- By 2030
- 45,052 · -0.6%
- By 2040
- 44,034 · -2.8%
- By 2050
- 42,310 · -6.6%
- By 2075
- 37,569 · -17.1%
- By 2100
- 30,676 · -32.3%
Race, ethnicity, and origin ACS 2023
- Race & ethnicity
- Black 49% White 47% Two or more races 2% Hispanic / Latino 2%
- Common ancestry
- Slovak 2% Italian 1% Lithuanian 1%
- Foreign-born
- 2% · Canada
- Languages at home
- 96% English-only · Spanish 2%
Political lean MEDSL · Thomas
- 2024 margin
- Strong R (+24.1) · D 37.8% · R 61.9%
- 2008→2024 swing
- -8.3pp toward R · 2008: -15.8pp · 2024: -24.1pp
- All cycles
- 2024: R+24.1 2020: R+19.5 2016: R+21.8 2012: R+18.5 2008: R+15.8
Not yet ingested
- Civics
- —
Market trends
- HPI YoY
- ▼ -93.17%
- Current HPI
- 228.0107
- Rent YoY
- —
- Metro
- Thomasville, GA
- State GDP YoY
- ▲ 2.66%
- F500 in state
- 28
Industry mix (Fortune 500 HQ in GA)
| Industry | F500 HQs | Revenue |
|---|---|---|
| Paper / Packaging | 2 | $29B |
|
||
| Retail | 1 | $160B |
|
||
| Transportation / Logistics | 1 | $91B |
|
||
| Airlines | 1 | $62B |
|
||
| Consumer Goods | 1 | $47B |
|
||
| Utilities | 1 | $25B |
|
||
Price history
-7.9% since first listed18 events — show timeline
- 2026-06-02 Listed $128,950 MBOR
- 2026-06-02 Listed $128,950 TABRMLS
- 2025-04-30 Sold (Public Records) $142,000 Public Records
- 2025-04-21 Pending — TABRMLS
- 2025-02-24 Relisted — TABRMLS
- 2025-02-24 Pending — TABRMLS
- 2025-02-19 Delisted — TABRMLS
- 2025-01-21 Price Changed $165,000 TABRMLS
- 2024-11-21 Price Changed $180,000 TABRMLS
- 2024-10-31 Listed $199,000 TABRMLS
- 2024-03-12 Sold (Public Records) $90,000 Public Records
- 2024-03-11 Sold (MLS) $90,000 TABRMLS
- 2024-02-27 Pending — TABRMLS
- 2024-02-20 Relisted — TABRMLS
- 2024-02-20 Price Changed $115,000 TABRMLS
- 2023-11-21 Price Changed $139,800 TABRMLS
- 2023-11-10 Price Changed $139,900 TABRMLS
- 2023-10-31 Listed $140,000 TABRMLS
Property tax history
-0.4%/yrLatest (2025): $268 · +1.3% YoY. Source: county tax records.
Cash-flow waterfall
monthlySold comps — $/sqft
last 12 mo · ≤1 miLoading sold comps…