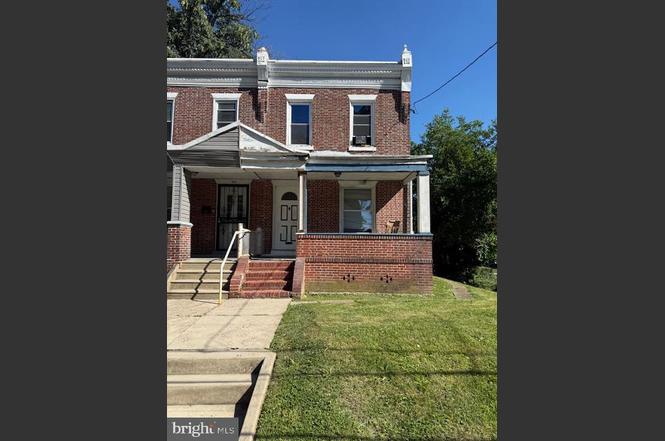
702 Cedar Ave · Yeadon, PA
Flood risk 1/10 · Minimal
- FEMA flood zone
- X (unshaded)
- Chance of flooding over 30 yrs
- 0.0%
- Est. flood insurance / yr
- $473 – $860
Fire risk 1/10 · Minimal
- Est. fire insurance / yr
- $511 – $949
Heat risk 6/10 · Moderate
- Hot days now (above 103°F)
- 7 days/yr
- Hot days in 30 yrs
- 15 days/yr
Wind risk 6/10 · Moderate
- Chance of severe wind over 30 yrs
- 27.0%
Air-quality risk 4/10 · Minor
- Unhealthy air days now
- 3 days/yr
- Unhealthy air days in 30 yrs
- 6 days/yr
Risk factors via First Street. Map © Google.
Why this score? — see what drove the C grade
The composite is a weighted blend of 9 inputs, each scored 0–100. Each bar is that input's sub-score; the figure is the points it added to the 100-point composite (weight × sub-score).
- Cash flow +19.4/30.0
- ARV discount +15.0/15.0
- DSCR +6.1/10.0
- 1% rule +5.2/10.0
- Rent growth +4.7/5.0
- Livability +3.9/5.0
- Condition / age +2.5/5.0
- Schools +1.7/10.0
- Appreciation +0.0/10.0
$169,000
🖨 Deal sheet (PDF) 📄 Offer letter ✓ Due diligence
Listing remarks
Investor Alert! Prime Opportunity in a rapidly growing area. Unlock the potential of the value-add property located in a thriving neighborhood with strong rental demand and ongoing development. Whether you're looking to fix & flip, renovate and hold, or expand your portfolio, this property offers the perfect canvas to create serious upside. Surrounded by revitalization and new investment, this home is ideally positioned for long-term appreciation. With the right vision, this could easily become a cash flowing standout. Conveniently located near major roadways, shopping, and public transportation, making it attractive for future tenants or buyers alike.
Key facts
- Built 1930
Property features AI
Finance
- Other: Above-grade finished area reported as 1,362 (assessor)
- Financial info: Cooperative ownership
Exterior
- Parking: On-street parking
- Utilities: Public water; Public sewer; Natural gas for heating and hot water; Natural gas for cooling
- Home design: Semi-detached property; Estimated year built
- Construction: Brick construction; Brick/mortar foundation
- Exterior features: Not in a federal flood zone; Ground rent paid annually; Above- and below-grade other structures noted
Interior
- Basement: Unfinished basement
- Bedrooms: Three bedrooms on the main level
- Bathrooms: One full bathroom on the main level; One half bathroom on the main level; One full bathroom total; One half bathroom total
- Heating & cooling: Hot water heating (natural gas); Central air conditioning (natural gas)
- Interior features: Level entry to main floor; Doors swing in; Accessible 32"+ wide doors; Accessible 36"+ wide halls; Accessible 48"+ wide halls
Neighborhood map
What this means for you Summary
Snapshot
- This is a 3-bed/1.0-bath townhouse listed at $169k.
Deal economics
- At list price, monthly cash flow is $189 ($2k/yr) — positive.
- The deal already cash-flows at list — no discount required.
- Meets the 1% rule at list price ($2k rent vs $169k).
- Cap rate 7.6% vs local median 2.5% in Yeadon — top-decile yield for the area; either an underpriced asset or a hidden risk that comps aren't pricing in. Stress-test before assuming the spread holds.
Location & tenants
- Location reads 77/100 on livability (#364 in PA, #3,181 nationally) — a middle-class / working-renter tenant base. Strengths: commute A+, cost of living A+, housing A; Watch: amenities D+.
- William Penn SD (suburban): math 11% / reading 28% proficiency, ranked #491 of 539 in PA (top 91%) — low school quality limits family demand, transient renter base, plan for 1-2y turnover; 69% free/reduced lunch — lower-income household profile, screen leases tightly.
- Zoned schools: W B Evans Magnet Sch (math 8% / reading 42%, grade F, #1,176 of 1,518 statewide, top 78%, 319 students, 100% FRL); Penn Wood Ms (math 5% / reading 28%, grade F, #463 of 512 statewide, top 91%, 683 students, 100% FRL); Penn Wood Hs (math 25% / reading 15%, grade F, #387 of 437 statewide, top 89%, 1,170 students, 95% FRL) — zoned schools average 98% FRL vs 69% district-wide (30 pts higher); higher-poverty schools than district average — tighter screening recommended.
- Market conditions: Rents rising fast (+8.9%/yr); 96 active listings in the ZIP; 40 comparable units currently listed for rent nearby; rentals at typical pace (median 26d on market — plan ~3-4 weeks tenant-placement turnaround); 299 units permitted in Delaware County in 2024 (5 in 5+ unit buildings).
- This rent runs 34% of the median local income ($61k/yr) — at the standard rent-burdened threshold; future hikes will face affordability resistance.
Forward outlook
- Local home prices are declining (-3.0%/yr); year-one equity from $1k of loan paydown is wiped out by about $5k of value loss. Plan a longer hold.
- At projected returns (-3.0% appreciation + 8.0% rent growth), your $47k cash investment doubles in ~9 years — after that, you're playing with house money.
Negotiation context
- Only 1 days on market — expect competitive offers; lowballing is unlikely to land.
- 8 sale attempts since 31y ago with the ask held roughly flat each time — persistent listings suggest the price (not the market) is what's stuck; bring a comps-based counter.
- Current owner paid $24k; list at $169k implies a 619% gain — meaningful room to come down on a strong offer.
Risks & watch-outs
- Watch-outs: built in 1930 — expect roof / HVAC / electrical / plumbing capex.
- Climate carrying-cost: major wind risk, 27% chance of damaging wind over 30y; extreme-heat days projected 7→15/yr by 2055 (HVAC capex compounding) — expect insurance premiums to compound above CPI over the hold.
Questions for the listing agent
- Built in 1930 — when were the roof, HVAC, electrical panel, plumbing, and water heater last replaced?
- Is there a deadline driving the sale (1031 exchange, divorce, estate, relocation)? That informs how much negotiation room exists.
- Schools are D-rated, which usually means shorter tenancies and higher turnover. Who's the typical renter profile here, and what's been the actual vacancy rate?
- What's the average days-on-market for RENTAL listings here right now (not sales)? A rising rental-DOM trend means longer vacancies and softer asking-rent achievability than the comps imply.
- What's the recent tenant-quality profile in this submarket — average credit score on applications, eviction rate, late-payment / NSF rate, and stable-employment percentage? A property-management company in the area should have these aggregated.
- How much new for-sale + rental construction is in the pipeline within 1–3 miles? Heavy new supply typically softens prices + rents 12–24 months out; constrained supply supports both.
Investment metrics
- 1% rule
- 1.02% ✓
- Cap rate
- 7.63%
- Cash-on-cash
- 4.79%
- DSCR
- 1.21
- GRM
- 8.2
CMA / ARV
- ARV (median comp)
- $275,169
- List price
- $169,000
- Delta
- -35.68%
- Verdict
- UNDERPRICED
- Comps
- 20 within 1.0 mi
Show comp detail 12 sales within ~0.75 mi
| Address | Dist | Beds/Ba | Sqft | Sold | Price | $/sf | Match |
|---|---|---|---|---|---|---|---|
| 734 Bullock Ave | 0.13mi | 3/1.0 | 1,346 (-1%) | 1mo | $175,000 | $130 | 91 |
| 524 Orchard Ave | 0.26mi | 3/2.5 | 1,288 (-5%) | 0mo | $275,000 | $214 | 73 |
| 825 Laurel Rd | 0.31mi | 3/1.5 | 1,280 (-6%) | 1mo | $275,000 | $215 | 73 |
| 530 Orchard Ave | 0.24mi | 4/1.5 (+1) | 1,288 (-5%) | 1mo | $290,000 | $225 | 72 |
| 537 Fern St | 0.37mi | 3/1.5 | 1,436 (+5%) | 1mo | $259,000 | $180 | 71 |
| 911 W Cobbs Creek Pkwy | 0.57mi | 3/2.5 | 1,376 (+1%) | 2mo | $335,000 | $243 | 64 |
| 1200 Angora Dr | 0.46mi | 3/1.0 | 1,530 (+12%) | 1mo | $265,000 | $173 | 57 |
| 22 Lexington Ave | 0.67mi | 4/1.0 (+1) | 1,308 (-4%) | 1mo | $280,000 | $214 | 56 |
| 1016 Whitby Ave | 0.34mi | 4/1.5 (+1) | 1,546 (+14%) | 1mo | $345,000 | $223 | 54 |
| 417 Laurel Rd | 0.39mi | 4/1.0 (+1) | 1,551 (+14%) | 2mo | $249,900 | $161 | 52 |
| 1300 Wycombe Ave | 0.72mi | 3/1.0 | 1,190 (-13%) | 1mo | $129,000 | $108 | 45 |
| 6528 Windsor St | 0.69mi | 3/1.5 | 1,536 (+13%) | 2mo | $209,900 | $137 | 43 |
Match score weights: distance 35% · size 25% · config 20% · recency 20%. Top-matched comps best support the ARV.
Projected returns pro-forma
-3.0% appreciation · 8.0% rent growth · sell at horizon
- IRR
- -3.3%
- Equity multiple
- 0.87×
- Total profit
- $-6,256
- Equity at exit
- $25,198
- IRR
- 11.3%
- Equity multiple
- 2.09×
- Total profit
- $51,454
- Equity at exit
- $14,612
Cash invested: $47,320 (down + closing). Projections, not guarantees.
Landlord ↔ Tenant lean methodology
- Overall (STATE)
- 62 Landlord-Friendly
- State Pennsylvania
- 62 Landlord-Friendly · EVEN
- County
- — inherits STATE
- City
- — inherits STATE
ZIP-level market 19050
- Rents YoY
- 8.9%
- Active inventory
- 96
- Price-to-rent
- 8.2×
Monthly cashflow live
- Estimated rent
- $1,717 high interval (Pro) →
- Mortgage (P&I)
- −$886
- Tax est. 1.5%
- −$211 /mo · $2,535/yr
- Insurance
- −$70
- HOA
- −$0
- Vacancy / Maint / Mgmt
- −$361
- Net cashflow
- $189
Break-even live
Sensitivity live
| Price | -10% $306 | -5% $247 | +0% $189 | +5% $130 | +10% $72 |
|---|---|---|---|---|---|
| Rent | -10% $53 | -5% $121 | +0% $189 | +5% $257 | +10% $325 |
| Rate | -1.0pp $274 | -0.5pp $232 | base $189 | +0.5pp $145 | +1.0pp $100 |
UW: 25.0% down · 7.5% · 30yr · 1.5% tax · 5.0% vac · 8.0% maint · 8.0% mgmt
Financing live
Cash to close
- Down payment
- $42,250
- Closing costs
- $5,070
- Reserves months
- —
- Total cash needed
- —
Loan-product check · same deal, 3 products live
Conventional
25% down · 7.5% · 30yr
- Down + closing
- —
- Monthly P&I
- —
- Monthly cashflow
- —
- DSCR
- —
- Eligible?
- —
Personal DTI + credit; lowest rate.
DSCR
20% down · 8.5% · 30yr
- Down + closing
- —
- Monthly P&I
- —
- Monthly cashflow
- —
- DSCR
- —
- Eligible?
- —
No personal income docs; deal must DSCR.
Hard money
10% down · 12.0% · 12mo
- Down + closing
- —
- Monthly P&I
- —
- Monthly cashflow
- —
- DSCR
- —
- Eligible?
- —
Short-term bridge; refi at stabilization.
Rent comps 40 comps
| Address | Beds | Baths | Sqft | Rent | $/sqft | DOM | Units | Dist |
|---|---|---|---|---|---|---|---|---|
| 608 Yeadon Ave Unit 1st Floor Yeadon, PA | 2.0 | 1.0 | 1000 | $1,400 | $1.40 | 19d | 1 | 0.14mi |
| 608 Yeadon Ave Unit 2nd Floor Yeadon, PA | 2.0 | 1.0 | 1000 | $1,400 | $1.40 | 14d | 1 | 0.14mi |
| 619 Baily Rd Lansdowne, PA | 3.0 | 1.0 | 1288 | $1,850 | $1.44 | 20d | 1 | 0.18mi |
| 826 Guenther Ave Lansdowne, PA | 2.0 | 1.0–2.0 | 800 | $1,699 | $2.12 | 26d | 1 | 0.20mi |
| 1200 Angora Dr Lansdowne, PA | 3.0 | 1.0 | 1530 | $2,300 | $1.50 | 7d | 1 | 0.49mi |
| 124 Lexington Ave Unit 2 Lansdowne, PA | 2.0 | 1.0 | 1000 | $1,500 | $1.50 | 4d | 1 | 0.83mi |
| 7116 Seaford Rd Upper Darby, PA | 2.0 | 1.0 | 996 | $1,600 | $1.61 | 45d | 1 | 0.87mi |
| 37 Concord Rd Darby, PA | 3.0 | 1.0 | 1120 | $1,795 | $1.60 | 45d | 1 | 0.90mi |
| 935 Maple Ter Darby, PA | 3.0 | 1.0 | 1266 | $1,585 | $1.25 | 12d | 1 | 0.91mi |
| 935 Maple Ter Darby, PA | 3.0 | 1.0 | 1266 | $1,585 | $1.25 | 7d | 1 | 0.91mi |
| 924 Maple Ter Darby, PA | 3.0 | 1.5 | 1190 | $2,000 | $1.68 | 7d | 1 | 0.94mi |
| 35 Elberon Ave Unit 2 Lansdowne, PA | 2.0 | 1.0 | 900 | $1,695 | $1.88 | 26d | 1 | 0.96mi |
| 7111 Greenwood Ave Upper Darby, PA | 3.0 | 1.5 | 1064 | $1,800 | $1.69 | 45d | 1 | 0.96mi |
| 7139 Greenwood Ave Upper Darby, PA | 3.0 | 1.0 | 1064 | $1,600 | $1.50 | 26d | 1 | 0.96mi |
| 146 S Lansdowne Ave Apt A9 Lansdowne, PA | 2.0 | 1.0 | 950 | $1,469 | $1.55 | 0d | 1 | 0.99mi |
| 110 N Union Ave Lansdowne, PA | 4.0 | 1.5 | 1678 | $2,345 | $1.40 | 22d | 1 | 1.01mi |
| 1300 Main St Unit Basement Darby, PA | 2.0 | 1.0 | 1000 | $1,450 | $1.45 | 26d | 1 | 1.02mi |
| 106 N 6th St Darby, PA | 2.0 | 1.0 | 1200 | $1,550 | $1.29 | 45d | 1 | 1.02mi |
| 6839 Radbourne Rd Upper Darby, PA | 3.0 | 1.5 | 1242 | $1,750 | $1.41 | 26d | 1 | 1.03mi |
| 702 Copley Rd Upper Darby, PA | 3.0 | 1.0 | 1044 | $1,750 | $1.68 | 26d | 1 | 1.03mi |
| 7147 Radbourne Rd Upper Darby, PA | 3.0 | 1.0 | 1096 | $1,850 | $1.69 | 14d | 1 | 1.04mi |
| 7026 Clinton Rd Upper Darby, PA | 2.0 | 1.5 | 902 | $1,650 | $1.83 | 45d | 1 | 1.05mi |
| 7050 Clinton Rd Upper Darby, PA | 2.0 | 1.0 | 977 | $1,550 | $1.59 | 45d | 1 | 1.06mi |
| 6965 Clinton Rd Upper Darby, PA | 2.0 | 1.0 | 986 | $1,675 | $1.70 | 45d | 1 | 1.07mi |
| 624 Briarcliff Rd Upper Darby, PA | 3.0 | 1.0 | 1307 | $1,700 | $1.30 | 45d | 1 | 1.07mi |
| 624 Briarcliff Rd Unit MAIN UNIT Upper Darby Township, PA | 3.0 | 1.0 | 1307 | $1,700 | $1.30 | 26d | 1 | 1.07mi |
| 6927 Guilford Rd Upper Darby, PA | 2.0 | 1.0 | 1182 | $1,495 | $1.26 | 4d | 1 | 1.09mi |
| 7216 Clinton Rd Upper Darby, PA | 3.0 | 1.0 | 1170 | $1,815 | $1.55 | 3d | 1 | 1.10mi |
| 69 S 7th St Darby, PA | 3.0 | 2.0 | 1446 | $1,700 | $1.18 | 45d | 1 | 1.20mi |
| 94 S 6th St Darby, PA | 3.0 | 1.5 | 1666 | $2,000 | $1.20 | 26d | 1 | 1.20mi |
| 909 Springfield Rd Unit D Darby, PA | 4.0 | 1.0 | 900 | $1,600 | $1.78 | 45d | 1 | 1.21mi |
| 31 Lamport Rd Upper Darby, PA | 3.0 | 1.0 | 1244 | $1,800 | $1.45 | 7d | 1 | 1.27mi |
| 209 Hamilton Ave Darby, PA | 4.0 | 1.0 | 1400 | $1,595 | $1.14 | 16d | 1 | 1.30mi |
| 101 W Baltimore Ave Unit B04 Lansdowne, PA | 2.0 | 1.0 | 925 | $1,469 | $1.59 | 26d | 1 | 1.31mi |
| 101 W Baltimore Ave Unit H4 Lansdowne, PA | 2.0 | 1.0 | 925 | $1,449 | $1.57 | 23d | 1 | 1.31mi |
| 2 Winthrop Rd Darby, PA | 3.0 | 1.5 | 1224 | $1,900 | $1.55 | 23d | 1 | 1.31mi |
| 292 N Wycombe Ave Lansdowne, PA | 2.0 | 1.0 | 1162 | $1,600 | $1.38 | 45d | 1 | 1.33mi |
| 430 Glendale Rd Upper Darby, PA | 3.0 | 1.0 | 1090 | $1,650 | $1.51 | 23d | 1 | 1.35mi |
| 304 S 3rd St Darby, PA | 3.0 | 1.0 | 1602 | $1,695 | $1.06 | 45d | 1 | 1.41mi |
| 304 S 3rd St Darby, PA | 3.0 | 1.0 | 1602 | $1,595 | $1.00 | 22d | 1 | 1.41mi |
Listing history 25 events
-
2026-06-21remarks 662-char remark
-
2026-06-21pricedays on market $169,000 Active 1 DOM
-
2026-06-02days on market $177,000 Active 287 DOM
-
2026-06-01days on market $177,000 Active 286 DOM
-
2026-05-31days on market $177,000 Active 285 DOM
-
2026-04-03status Active 194-char remark
-
2026-04-02historical 194-char remark
-
2026-03-22price $177,000 194-char remark
-
2026-03-22status Active 194-char remark
-
2026-03-21historical 194-char remark
-
2025-12-22status Active 194-char remark
-
2025-12-21historical 194-char remark
-
2025-11-24price $179,000 194-char remark
-
2025-09-22price $189,000 194-char remark
-
2025-09-04price $199,000 194-char remark
-
2025-08-17$225,000 Active 194-char remark
-
2025-08-12historical $225,000 194-char remark
-
2025-07-22historical
-
2025-06-21$230,000 Active
-
2025-06-17historical
-
2014-01-26historical
-
2013-06-26$99,990
-
1995-12-22soldstatus $23,500
-
1995-11-22historical
-
1995-05-25$23,500
ⓘ Source: listings_history table (triggers on properties + properties_extension) + one-shot
backfill from property_details.listing_events for pre-trigger history.
Climate risk First Street
- Flood 1/10 Low FEMA zone X (unshaded) · 0% chance over 30 yrs
- Wildfire 1/10 Low
- Heat 6/10 Major 7 d/yr ≥103°F today · 15 d/yr by 30 yrs out
- Wind 6/10 Major 27% chance of damaging wind over 30 yrs
- Air quality 4/10 Moderate 3 unhealthy d/yr today · 6 by 30 yrs out
Nearby sold comps map
Loading sold comps map…
Walkable amenities ~0.75 mi
Loading nearby amenities…
Taxation est. · year 1
- Rental income
- $20,609
- − Mortgage interest
- −$9,467
- − Property taxes
- −$2,535
- − Insurance
- −$845
- − Repairs & maintenance
- −$1,649
- − Management
- −$1,649
- − Depreciation
- −$4,916
- Taxable loss
- −$451
- Est. tax savings @ 24.0%
- +$108
- After-tax cash flow
- $2,374/yr
For passive investors: Depreciation is non-cash, so a rental often shows a tax loss while cash-flowing — sheltering income. Rental losses are passive: they offset passive income freely, and up to $25,000/yr can offset ordinary (W-2) income if you actively participate and your MAGI is under $100k (phasing out to $0 by $150k); unused losses carry forward. On sale, claimed depreciation is recaptured at up to 25%, and gains may owe capital-gains tax (a 1031 exchange can defer both). Figures are a year-1 estimate at your 24.0% rate — not tax advice; consult a CPA.
Schools (NCES district)
- District
- William Penn SD
- NCES district ID
- 4226390
- Math proficiency
- 11% ▼ -3.00%
- Reading proficiency
- 28% ▼ -7.00%
- Median HH income
- $48,543
- Composite
- 17.29/100
- National rank
- #9086
- State rank
- #491 of 539 in PA
Livability — Yeadon
- Score
- 77/100
- State rank
- #364
- US rank
- #3181
Category grades
Schools grade is shown separately in the Schools card above.
Census & demographics
- Census place
- Yeadon, PA
- County
- Delaware County · 399,863 people
- Metro
- Philadelphia-Camden-Wilmington, PA-NJ-DE-MD
- Population (ZIP)
- 29,373
- Household income
- $60,859
- Rent vs Own
- Severe rent burden
- 1738.0
Population outlook (Delaware County) Hauer SSP2
- Today (2025)
- 577,490 people
- By 2030
- 581,243 · +0.6%
- By 2040
- 584,700 · +1.2%
- By 2050
- 586,581 · +1.6%
- By 2075
- 598,706 · +3.7%
- By 2100
- 590,823 · +2.3%
Race, ethnicity, and origin ACS 2023
- Neighborhood character
- Predominantly Black (67%)
- Race & ethnicity
- Black 67% White 22% Two or more races 5% Hispanic / Latino 5% Asian 2%
- Common ancestry
- Swiss 4% Hispanic 3% Lithuanian 1%
- Foreign-born
- 17% · Canada, United Kingdom, Vietnam
- Languages at home
- 84% English-only · French/Haitian/Cajun 5% Spanish 3% Other Indo-European 1%
Political lean MEDSL · Delaware
- 2024 margin
- Strong D (+23.7) · D 61.4% · R 37.6% · Other 1.0%
- 2008→2024 swing
- +2.3pp toward D · 2008: 21.4pp · 2024: 23.7pp
- All cycles
- 2024: D+23.7 2020: D+26.7 2016: D+22.0 2012: D+21.8 2008: D+21.4
Not yet ingested
- Civics
- —
Market trends
- HPI YoY
- ▼ -202.83%
- Current HPI
- 287.6419
- Rent YoY
- ▲ 8.87%
- Metro
- Philadelphia-Camden-Wilmington, PA-NJ-DE-MD
- State GDP YoY
- ▲ 1.68%
- F500 in state
- 34
Industry mix (Fortune 500 HQ in PA)
| Industry | F500 HQs | Revenue |
|---|---|---|
| Healthcare | 2 | $309B |
|
||
| Insurance | 2 | $27B |
|
||
| Telecommunications / Media | 1 | $124B |
|
||
| Industrial Distribution | 1 | $22B |
|
||
| Financial Services | 1 | $20B |
|
||
| Chemicals / Materials | 1 | $18B |
|
||
Price history
+619.1% since first listed22 events — show timeline
- 2026-06-20 Listed $169,000 BRIGHT MLS
- 2026-06-02 Listing Removed — BRIGHT MLS
- 2026-04-03 Relisted — BRIGHT MLS
- 2026-04-02 Listing Removed — BRIGHT MLS
- 2026-03-22 Price Changed $177,000 BRIGHT MLS
- 2026-03-22 Relisted — BRIGHT MLS
- 2026-03-21 Listing Removed — BRIGHT MLS
- 2025-12-22 Relisted — BRIGHT MLS
- 2025-12-21 Listing Removed — BRIGHT MLS
- 2025-11-24 Price Changed $179,000 BRIGHT MLS
- 2025-09-22 Price Changed $189,000 BRIGHT MLS
- 2025-09-04 Price Changed $199,000 BRIGHT MLS
- 2025-08-17 Listed $225,000 BRIGHT MLS
- 2025-08-12 Coming Soon — BRIGHT MLS
- 2025-07-22 Listing Removed — BRIGHT MLS
- 2025-06-21 Listed $230,000 BRIGHT MLS
- 2025-06-17 Coming Soon — BRIGHT MLS
- 2014-01-26 Listing Removed — BRIGHT MLS
- 2013-06-26 Listed $99,990 BRIGHT MLS
- 1995-12-22 Sold (MLS) $23,500 BRIGHT MLS
- 1995-11-22 Listing Removed — BRIGHT MLS
- 1995-05-25 Listed $23,500 BRIGHT MLS
Property tax history
+6.2%/yrLatest (2026): $10,216 · +92.4% YoY. Source: county tax records.
Cash-flow waterfall
monthlySold comps — $/sqft
last 12 mo · ≤1 miLoading sold comps…