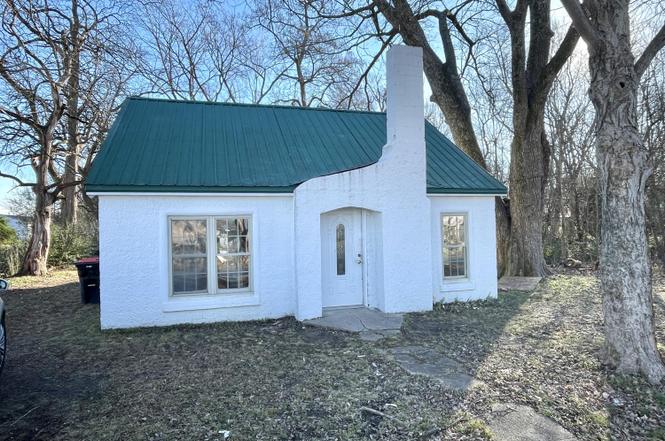
1436 N 18th Ave · Humboldt, TN
Flood risk 3/10 · Minor
- FEMA flood zone
- X (unshaded)
- Chance of flooding over 30 yrs
- 0.2%
- Est. flood insurance / yr
- $473 – $860
Fire risk 1/10 · Minimal
- Est. fire insurance / yr
- $949 – $1,763
Heat risk 6/10 · Moderate
- Hot days now (above 109°F)
- 7 days/yr
- Hot days in 30 yrs
- 20 days/yr
Wind risk 4/10 · Minor
- Chance of severe wind over 30 yrs
- 13.0%
Air-quality risk 1/10 · Minimal
- Unhealthy air days now
- 0 days/yr
- Unhealthy air days in 30 yrs
- 0 days/yr
Risk factors via First Street. Map © Google.
Why this score? — see what drove the B- grade
The composite is a weighted blend of 9 inputs, each scored 0–100. Each bar is that input's sub-score; the figure is the points it added to the 100-point composite (weight × sub-score).
- Cash flow +30.0/30.0
- 1% rule +10.0/10.0
- DSCR +10.0/10.0
- ARV discount +7.5/15.0
- Livability +3.0/5.0
- Rent growth +2.5/5.0
- Condition / age +2.5/5.0
- Schools +0.5/10.0
- Appreciation +0.0/10.0
$35,000
🖨 Deal sheet 📄 Offer letter ✓ Due diligence
Listing remarks
Great investment & fixer up property in Humboldt, TN - 2 bedrooms & 1 bath, large kitchen & laundry room. House has a metal roof & has been recently painted & new windows. This property has a 15 x 20 outbuilding for the handyman or extra storage. Call Denice Webb 731-414-1012 for more information. Home to be sold "As Is". Great investment property in Humboldt, TN - 2 bedrooms & 1 bath, large kitchen & laundry room. This house has a metal roof and has been recently painted & new windows. This property has a 15 x 20 outbuilding for the handyman or extra storage. Call Denice Webb 731-414-1012 for more information.
Key facts
- Metal roof
- Outbuilding
- Recently painted
Tags
Property features AI
Exterior
- Parking: 2 parking spaces
- Utilities: Public water; Public sewer; Electricity connected; Natural gas connected; Natural gas available
- Home design: Single family residence; One level
- Construction: Stucco construction; Slab foundation
- Exterior features: Metal roof
Interior
- Kitchen: Refrigerator
- Bedrooms: 2 bedrooms on the main level
- Flooring: Carpet; Vinyl
- Bathrooms: 1 full bathroom (main level)
- Heating & cooling: Natural gas heating; Window air conditioning units
- Interior features: Refrigerator included; 5 total rooms
- Laundry & utility: Laundry room with washer and electric dryer hookups
Neighborhood map
What this means for you Summary
Snapshot
- This is a 2-bed/1.0-bath single-family listed at $35k.
Deal economics
- At list price, monthly cash flow is $545 ($7k/yr) — positive.
- The deal already cash-flows at list — no discount required.
- Meets the 1% rule at list price ($950 rent vs $35k).
- Recommended offer: $31k (12.0% below list) — sets the bar for market timing.
Location & tenants
- Location reads 59/100 on livability (#289 in TN) — a working-class tenant base; expect higher turnover. Strengths: cost of living A+, housing A+; Watch: health & safety C-, schools F, crime F.
- Humboldt City Schools (town): math 4% / reading 9% proficiency, ranked #138 of 139 in TN (top 99%) — low school quality limits family demand, transient renter base, plan for 1-2y turnover; 86% free/reduced lunch — lower-income household profile, screen leases tightly.
- Market conditions: 151 active listings in the ZIP; 1 comparable units currently listed for rent nearby; 155 units permitted in Gibson County in 2024 (0 in 5+ unit buildings).
Forward outlook
- Local home prices are declining (-3.0%/yr); year-one equity from $242 of loan paydown is wiped out by about $1k of value loss. Plan a longer hold.
- Gibson County population projected to shrink 8% by 2050 — rents likely to lag national; underwrite the cash flow, not the appreciation.
- At projected returns (-3.0% appreciation + 3.0% rent growth), your $10k cash investment doubles in ~2 years — after that, you're playing with house money.
Negotiation context
- It's been on market 177 days — a 12% lower offer ($31k) is reasonable based on typical stale-listing flexibility.
- 2 sale attempts; this cycle's ask has dropped $24k (41%) from the opening price — seller is motivated, your offer sets the floor, not the list.
- Current owner paid $623; list at $35k implies a 5518% gain — meaningful room to come down on a strong offer.
Risks & watch-outs
- Watch-outs: built in 1933 — expect roof / HVAC / electrical / plumbing capex.
- Climate carrying-cost: extreme-heat days projected 7→20/yr by 2055 (HVAC capex compounding) — expect insurance premiums to compound above CPI over the hold.
Questions for the listing agent
- It's been on market 177 days. Have you received any prior offers? Is the seller open to a 12% concession, seller financing, or rate buy-down credit?
- Built in 1933 — when were the roof, HVAC, electrical panel, plumbing, and water heater last replaced?
- Why hasn't it sold? Are there any deal-killer items the seller is aware of (foundation, flood, title, zoning, code violations)?
- Is there a deadline driving the sale (1031 exchange, divorce, estate, relocation)? That informs how much negotiation room exists.
- Schools are F-rated, which usually means shorter tenancies and higher turnover. Who's the typical renter profile here, and what's been the actual vacancy rate?
- Crime grade is F in this area — have there been break-ins, vandalism, or insurance claims at this property in the last 3 years? What carrier currently insures it and at what premium?
- What's the average days-on-market for RENTAL listings here right now (not sales)? A rising rental-DOM trend means longer vacancies and softer asking-rent achievability than the comps imply.
- What's the recent tenant-quality profile in this submarket — average credit score on applications, eviction rate, late-payment / NSF rate, and stable-employment percentage? A property-management company in the area should have these aggregated.
- How much new for-sale + rental construction is in the pipeline within 1–3 miles? Heavy new supply typically softens prices + rents 12–24 months out; constrained supply supports both.
Investment metrics
- 1% rule
- 2.71% ✓
- Cap rate
- 24.97%
- Cash-on-cash
- 66.72%
- DSCR
- 3.97
- GRM
- 3.1
CMA / ARV
No comps found within radius.
Projected returns pro-forma
-3.0% appreciation · 3.0% rent growth · sell at horizon
- IRR
- 66.0%
- Equity multiple
- 3.96×
- Total profit
- $29,024
- Equity at exit
- $5,219
- IRR
- 70.3%
- Equity multiple
- 8.14×
- Total profit
- $69,927
- Equity at exit
- $3,026
Cash invested: $9,800 (down + closing). Projections, not guarantees.
Landlord ↔ Tenant lean methodology
- Overall (STATE)
- 87 Strongly Landlord-Friendly
- State Tennessee
- 87 Strongly Landlord-Friendly · R+13
- County
- — inherits STATE
- City
- — inherits STATE
ZIP-level market 38343
- Home prices YoY
- -18.1%
- Active inventory
- 151
- Price-to-rent
- 3.1×
Monthly cashflow live
- Estimated rent
- $950 medium interval (Pro) →
- Mortgage (P&I)
- −$184
- Tax from tax record
- −$8 /mo · $90/yr
- Insurance
- −$15
- HOA
- −$0
- Vacancy / Maint / Mgmt
- −$200
- Net cashflow
- $545
Break-even live
UW: 25.0% down · 7.5% · 30yr · 1.5% tax · 5.0% vac · 8.0% maint · 8.0% mgmt
Financing live
Cash to close
- Down payment
- $8,750
- Closing costs
- $1,050
- Reserves months
- —
- Total cash needed
- —
Loan-product check · same deal, 3 products live
Conventional
25% down · 7.5% · 30yr
- Down + closing
- —
- Monthly P&I
- —
- Monthly cashflow
- —
- DSCR
- —
- Eligible?
- —
Personal DTI + credit; lowest rate.
DSCR
20% down · 8.5% · 30yr
- Down + closing
- —
- Monthly P&I
- —
- Monthly cashflow
- —
- DSCR
- —
- Eligible?
- —
No personal income docs; deal must DSCR.
Hard money
10% down · 12.0% · 12mo
- Down + closing
- —
- Monthly P&I
- —
- Monthly cashflow
- —
- DSCR
- —
- Eligible?
- —
Short-term bridge; refi at stabilization.
Rent comps 1 comps
| Address | Beds | Baths | Sqft | Rent | $/sqft | DOM | Units | Dist |
|---|---|---|---|---|---|---|---|---|
| 1509 Vine St Humboldt, TN | 2.0 | 1.0 | 754 | $950 | $1.26 | 43d | 1 | 0.30mi |
Listing history 22 events
-
2026-06-18price $35,000 Active 177 DOM
-
2026-06-18days on market $49,900 Active 177 DOM
-
2026-06-17days on market $49,900 Active 176 DOM
-
2026-06-16days on market $49,900 Active 175 DOM
-
2026-06-15days on market $49,900 Active 174 DOM
-
2026-06-13days on market $49,900 Active 172 DOM
-
2026-06-12days on market $49,900 Active 171 DOM
-
2026-06-09days on market $49,900 Active 168 DOM
-
2026-06-08days on market $49,900 Active 167 DOM
-
2026-06-08days on market $49,900 Active 166 DOM
-
2026-06-07days on market $49,900 Active 165 DOM
-
2026-06-03days on market $49,900 Active 162 DOM
-
2026-06-02days on market $49,900 Active 161 DOM
-
2026-06-01days on market $49,900 Active 160 DOM
-
2026-05-31days on market $49,900 Active 159 DOM
-
2026-04-28price $49,900
-
2026-03-04status Active
-
2026-01-30status Pending
-
2026-01-24price $53,900
-
2025-11-20$59,000 Active
-
2020-08-13soldstatus $623
-
2003-10-30soldstatus $12,000
ⓘ Source: listings_history table (triggers on properties + properties_extension) + one-shot
backfill from property_details.listing_events for pre-trigger history.
Tax reassessment forecast TN · Resets to sale price
- Current annual tax
- $90 · $8/mo
- Projected year-2 tax
- $249 · $21/mo
- Expected delta
- +$159/yr (+$13/mo · 176.1%)
ⓘ Screening estimate from a state-policy table — verify with the county assessor before closing.
Climate risk First Street
- Flood 3/10 Moderate FEMA zone X (unshaded) · 20% chance over 30 yrs
- Wildfire 1/10 Low
- Heat 6/10 Major 7 d/yr ≥109°F today · 20 d/yr by 30 yrs out
- Wind 4/10 Moderate 13% chance of damaging wind over 30 yrs
- Air quality 1/10 Low 0 unhealthy d/yr today · 0 by 30 yrs out
Nearby sold comps map
Loading sold comps map…
Walkable amenities ~0.75 mi
Loading nearby amenities…
Taxation est. · year 1
- Rental income
- $11,400
- − Mortgage interest
- −$1,961
- − Property taxes
- −$90
- − Insurance
- −$175
- − Repairs & maintenance
- −$912
- − Management
- −$912
- − Depreciation
- −$1,018
- Taxable income
- $6,332
- Est. tax owed @ 24.0%
- −$1,520
- After-tax cash flow
- $5,019/yr
For passive investors: Depreciation is non-cash, so a rental often shows a tax loss while cash-flowing — sheltering income. Rental losses are passive: they offset passive income freely, and up to $25,000/yr can offset ordinary (W-2) income if you actively participate and your MAGI is under $100k (phasing out to $0 by $150k); unused losses carry forward. On sale, claimed depreciation is recaptured at up to 25%, and gains may owe capital-gains tax (a 1031 exchange can defer both). Figures are a year-1 estimate at your 24.0% rate — not tax advice; consult a CPA.
Schools (NCES district)
- District
- Humboldt City Schools
- NCES district ID
- 4701950
- Math proficiency
- 4% ▼ -11.00%
- Reading proficiency
- 9% ▼ -6.00%
- Median HH income
- $30,717
- Composite
- 4.86/100
- National rank
- #10042
- State rank
- #138 of 139 in TN
Livability — Humboldt
- Score
- 59/100
- State rank
- #289
- US rank
- #20318
Category grades
Schools grade is shown separately in the Schools card above.
Census & demographics
- Census place
- Humboldt, TN
- City population
- 15,672
- Population (ZIP)
- 15,672
Population outlook (Gibson County) Hauer SSP2
- Today (2025)
- 48,793 people
- By 2030
- 48,221 · -1.2%
- By 2040
- 46,793 · -4.1%
- By 2050
- 44,909 · -8.0%
- By 2075
- 40,191 · -17.6%
- By 2100
- 33,574 · -31.2%
Race, ethnicity, and origin ACS 2023
- Neighborhood character
- Predominantly White (65%)
- Race & ethnicity
- White 65% Black 23% Two or more races 6% Hispanic / Latino 5% Native American 1%
- Hispanic origin (detail)
- Mexican 5%
- Common ancestry
- Serbian 2% Italian 1% Lithuanian 1%
- Foreign-born
- 3% · Canada
- Languages at home
- 94% English-only · Spanish 5% Other Indo-European 1%
Political lean MEDSL · Gibson
- 2024 margin
- Solid R (+52.0) · D 23.6% · R 75.5%
- 2008→2024 swing
- -23.2pp toward R · 2008: -28.8pp · 2024: -52.0pp
- All cycles
- 2024: R+52.0 2020: R+47.0 2016: R+43.8 2012: R+32.1 2008: R+28.8
Not yet ingested
- Civics
- —
Market trends
- HPI YoY
- ▼ -45.61%
- Current HPI
- 206.7365
- Rent YoY
- —
- Metro
- —
- State GDP YoY
- ▲ 2.78%
- F500 in state
- 22
Industry mix (Fortune 500 HQ in TN)
| Industry | F500 HQs | Revenue |
|---|---|---|
| Healthcare | 3 | $91B |
|
||
| Retail | 3 | $72B |
|
||
| Transportation / Logistics | 1 | $88B |
|
||
| Paper / Packaging | 1 | $19B |
|
||
| Insurance | 1 | $13B |
|
||
| Energy | 1 | $12B |
|
||
Price history
+315.8% since first listed7 events — show timeline
- 2026-04-28 Price Changed $49,900 CWTAR
- 2026-03-04 Relisted — CWTAR
- 2026-01-30 Pending — CWTAR
- 2026-01-24 Price Changed $53,900 CWTAR
- 2025-11-20 Listed $59,000 CWTAR
- 2020-08-13 Sold (Public Records) $623 Public Records
- 2003-10-30 Sold (Public Records) $12,000 Public Records
Property tax history
-7.1%/yrLatest (2025): $90 · +0.0% YoY. Source: county tax records.
Cash-flow waterfall
monthlySold comps — $/sqft
last 12 mo · ≤1 miLoading sold comps…