20502 Moonrise River Ln · Houston, TX
Flood risk 1/10 · Minimal
- FEMA flood zone
- X (unshaded)
- Chance of flooding over 30 yrs
- 0.0%
- Est. flood insurance / yr
- $507 – $1,088
Fire risk 3/10 · Minor
- Est. fire insurance / yr
- $1,222 – $2,270
Heat risk 9/10 · Severe
- Hot days now (above 110°F)
- 7 days/yr
- Hot days in 30 yrs
- 23 days/yr
Wind risk 8/10 · Major
- Chance of severe wind over 30 yrs
- 99.0%
Air-quality risk 2/10 · Minimal
- Unhealthy air days now
- 2 days/yr
- Unhealthy air days in 30 yrs
- 2 days/yr
Risk factors via First Street. Map © Google.
Why this score? — see what drove the D- grade
The composite is a weighted blend of 9 inputs, each scored 0–100. Each bar is that input's sub-score; the figure is the points it added to the 100-point composite (weight × sub-score).
- Cash flow +10.4/30.0
- ARV discount +8.6/15.0
- Schools +4.4/10.0
- 1% rule +4.1/10.0
- Livability +3.7/5.0
- DSCR +3.0/10.0
- Condition / age +2.5/5.0
- Rent growth +2.2/5.0
- Appreciation +0.0/10.0
$231,467
🖨 Deal sheet (PDF) 📄 Offer letter ✓ Due diligence
Listing remarks
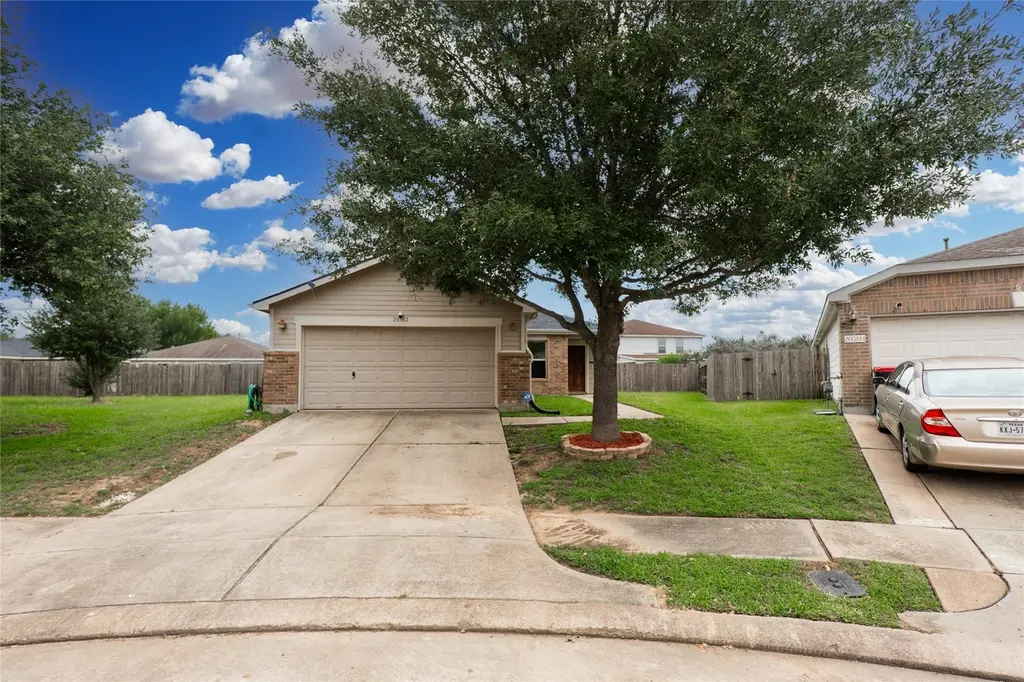
Welcome to 20502 Moonrise River Ln in Cypress, TX! This charming 3-bedroom, 2-bath home offers a comfortable open layout. Located in a Cul-de-sac. The split floorplan gives the primary suite added privacy, while the kitchen opens to the living and dining areas for easy everyday living. This home also features a new roof for added peace of mind. Conveniently located near Grand Parkway (99), shopping, and dining.
Key facts
- Split floorplan
- Cul-de-sac
- New roof
Tags
Property features AI
Finance
- HOA & community: Part of Canyon Village at Cypress association; Annual association fee of $574
Exterior
- Parking: Attached garage; Driveway; Garage parking (2 spaces)
- Utilities: Public water; Public sewer
- Home design: Residential property; Built in 2009; Single-level entry; Slab foundation; Composition roof
- Construction: Brick and cement siding construction
- Exterior features: Located on a cul-de-sac
Interior
- Kitchen: Dishwasher, Disposal, Gas Oven, Gas Range
- Bedrooms: Three bedrooms on the first floor (approx. 12x12, 12x12, 14x14)
- Flooring: Carpet; Laminate
- Bathrooms: Two full bathrooms
- Heating & cooling: Central heating (gas); Central air (electric)
- Interior features: Electric dryer hookup; Dishwasher, Disposal, Gas Oven, Gas Range
- Laundry & utility: Electric dryer hookup
Neighborhood map
What this means for you Summary
Snapshot
- This is a 3-bed/2.0-bath single-family listed at $231k.
Deal economics
- At list price, monthly cash flow is $-123 ($-1k/yr) — negative.
- To cash-flow at today's rent, offer at most $210k (9.4% below list).
- To meet the 1% rule (rent ≥ 1% of price), the offer needs to be $210k (9.2% below list).
- Recommended offer: $210k (9.4% below list) — sets the bar for cash-flow.
- Cap rate 5.7% vs local median 3.2% in Houston — top-decile yield for the area; either an underpriced asset or a hidden risk that comps aren't pricing in. Stress-test before assuming the spread holds.
Location & tenants
- Location reads 74/100 on livability (#184 in TX, #4,771 nationally) — a middle-class / working-renter tenant base. Strengths: amenities A+, cost of living A+, housing A+; Watch: crime F.
- Cypress-Fairbanks ISD (suburban): math 45% / reading 52% proficiency, ranked #161 of 826 in TX (top 20%) — families likely to look elsewhere, expect single-tenant / working-renter base with shorter leases.
- Zoned schools: Hopper Middle (math 24% / reading 34%, grade F, #1,103 of 1,662 statewide, top 67%, 930 students, 80% FRL); Cypress Springs H S (math 35% / reading 60%, grade D, #583 of 1,632 statewide, top 36%, 2,788 students, 68% FRL) — zoned schools average 74% FRL vs 43% district-wide (31 pts higher); higher-poverty schools than district average — tighter screening recommended.
- Market conditions: Rents soft (-1.3%/yr); 2065 active listings in the ZIP; 34 comparable units currently listed for rent nearby; rentals at typical pace (median 23d on market — plan ~3-4 weeks tenant-placement turnaround); 41% of comp listings sitting > 30 days — soft ceiling on asking rent; high-income renter base; 29,883 units permitted in Harris County in 2024 (8,621 in 5+ unit buildings).
- This rent is only 18% of the median local income ($144k/yr) — well below the 30% rent-burden line; pricing power to push rent on renewal without tenant pushback.
Forward outlook
- Local home prices are declining (-3.0%/yr); year-one equity from $2k of loan paydown is wiped out by about $7k of value loss. Plan a longer hold.
- Harris County population projected at +47% by 2050 — long-run rental-demand tailwind backs the buy-and-hold thesis.
Negotiation context
- It's been on market 37 days — a 3% lower offer ($225k) is reasonable based on typical stale-listing flexibility.
Risks & watch-outs
- Climate carrying-cost: severe wind risk, 99% chance of damaging wind over 30y; extreme-heat days projected 7→23/yr by 2055 (HVAC capex compounding) — expect insurance premiums to compound above CPI over the hold.
Questions for the listing agent
- What do current leases actually rent for vs. the listed asking? Can we see a recent rent roll and the last 12 months of T-12 income?
- It's been on market 37 days. Have you received any prior offers? Is the seller open to a 9% concession, seller financing, or rate buy-down credit?
- What does the HOA fee cover, when was the last increase, and are there any pending special assessments or reserve-fund shortfalls?
- Is there a deadline driving the sale (1031 exchange, divorce, estate, relocation)? That informs how much negotiation room exists.
- Schools are D-rated, which usually means shorter tenancies and higher turnover. Who's the typical renter profile here, and what's been the actual vacancy rate?
- Crime grade is F in this area — have there been break-ins, vandalism, or insurance claims at this property in the last 3 years? What carrier currently insures it and at what premium?
- The area grade is low — what's the realistic commute time and amenity access for the typical tenant pool here? Any planned neighborhood developments (good or bad) we should know about?
- What's the average days-on-market for RENTAL listings here right now (not sales)? A rising rental-DOM trend means longer vacancies and softer asking-rent achievability than the comps imply.
- What's the recent tenant-quality profile in this submarket — average credit score on applications, eviction rate, late-payment / NSF rate, and stable-employment percentage? A property-management company in the area should have these aggregated.
- How much new for-sale + rental construction is in the pipeline within 1–3 miles? Heavy new supply typically softens prices + rents 12–24 months out; constrained supply supports both.
Investment metrics
- 1% rule
- 0.91% ✗
- Cap rate
- 5.66%
- Cash-on-cash
- -2.27%
- DSCR
- 0.90
- GRM
- 9.2
CMA / ARV
- ARV (median comp)
- $237,023
- List price
- $231,467
- Delta
- -2.34%
- Verdict
- FAIR
- Comps
- 20 within 1.0 mi
Show comp detail 12 sales within ~0.75 mi
| Address | Dist | Beds/Ba | Sqft | Sold | Price | $/sf | Match |
|---|---|---|---|---|---|---|---|
| 20731 Cypress Post Dr | 0.17mi | 3/2.0 | 1,406 (+4%) | 4mo | $229,900 | $164 | 82 |
| 20615 Moonrise River Ln | 0.09mi | 4/2.0 (+1) | 1,400 (+4%) | 4mo | $240,000 | $171 | 82 |
| 7238 Cypress Prairie Dr | 0.39mi | 3/2.0 | 1,400 (+4%) | 10mo | $225,000 | $161 | 67 |
| 7319 Rising Brook Dr | 0.49mi | 3/2.0 | 1,355 (+0%) | 11mo | $210,000 | $155 | 67 |
| 7430 Riven Oaks Ct | 0.53mi | 3/2.0 | 1,469 (+9%) | 10mo | $245,000 | $167 | 52 |
| 7303 Rising Brook Dr | 0.51mi | 3/2.0 | 1,157 (-14%) | 0mo | $205,000 | $177 | 52 |
| 21042 Salt Rock Dr | 0.31mi | 4/2.0 (+1) | 1,544 (+14%) | 6mo | $319,900 | $207 | 52 |
| 21050 Salt Rock Dr | 0.34mi | 4/2.0 (+1) | 1,544 (+14%) | 6mo | $299,900 | $194 | 50 |
| 21115 Montego Bay Dr | 0.73mi | 3/2.0 | 1,416 (+5%) | 10mo | $315,138 | $223 | 50 |
| 7807 Meandering Oak Ln | 0.59mi | 3/2.0 | 1,522 (+13%) | 9mo | $260,000 | $171 | 44 |
| 19943 Sycamore Valley Dr | 0.75mi | 3/2.5 | 1,519 (+12%) | 2mo | $225,000 | $148 | 40 |
| 7331 River Pines Dr | 0.72mi | 3/2.5 | 1,505 (+11%) | 8mo | $245,000 | $163 | 39 |
Match score weights: distance 35% · size 25% · config 20% · recency 20%. Top-matched comps best support the ARV.
Projected returns pro-forma
-3.0% appreciation · 0.0% rent growth · sell at horizon
- IRR
- -23.8%
- Equity multiple
- 0.21×
- Total profit
- $-51,340
- Equity at exit
- $34,512
- IRR
- -32.4%
- Equity multiple
- -0.20×
- Total profit
- $-77,996
- Equity at exit
- $20,013
Cash invested: $64,811 (down + closing). Projections, not guarantees.
Landlord ↔ Tenant lean methodology
- Overall (STATE)
- 87 Strongly Landlord-Friendly
- State Texas
- 87 Strongly Landlord-Friendly · R+5
- County
- — inherits STATE
- City
- — inherits STATE
ZIP-level market 77433
- Home prices YoY
- -28.5%
- Rents YoY
- -1.3%
- Active inventory
- 2065
- Price-to-rent
- 9.2×
Monthly cashflow live
- Estimated rent
- $2,103 high interval (Pro) →
- Mortgage (P&I)
- −$1,214
- Tax from tax record
- −$426 /mo · $5,108/yr
- Insurance
- −$96
- HOA
- −$48
- Vacancy / Maint / Mgmt
- −$442
- Net cashflow
- $-123
Break-even live
Sensitivity live
| Price | -10% $8 | -5% $-57 | +0% $-123 | +5% $-188 | +10% $-254 |
|---|---|---|---|---|---|
| Rent | -10% $-289 | -5% $-206 | +0% $-123 | +5% $-40 | +10% $43 |
| Rate | -1.0pp $-6 | -0.5pp $-64 | base $-123 | +0.5pp $-183 | +1.0pp $-244 |
UW: 25.0% down · 7.5% · 30yr · 1.5% tax · 5.0% vac · 8.0% maint · 8.0% mgmt
Financing live
Cash to close
- Down payment
- $57,867
- Closing costs
- $6,944
- Reserves months
- —
- Total cash needed
- —
Loan-product check · same deal, 3 products live
Conventional
25% down · 7.5% · 30yr
- Down + closing
- —
- Monthly P&I
- —
- Monthly cashflow
- —
- DSCR
- —
- Eligible?
- —
Personal DTI + credit; lowest rate.
DSCR
20% down · 8.5% · 30yr
- Down + closing
- —
- Monthly P&I
- —
- Monthly cashflow
- —
- DSCR
- —
- Eligible?
- —
No personal income docs; deal must DSCR.
Hard money
10% down · 12.0% · 12mo
- Down + closing
- —
- Monthly P&I
- —
- Monthly cashflow
- —
- DSCR
- —
- Eligible?
- —
Short-term bridge; refi at stabilization.
Rent comps 34 comps
| Address | Beds | Baths | Sqft | Rent | $/sqft | DOM | Units | Dist |
|---|---|---|---|---|---|---|---|---|
| 21038 Treasure Gate Ln Cypress, TX | 4.0 | 2.5 | 1804 | $2,676 | $1.48 | 44d | 1 | 0.37mi |
| 21054 Montego Breeze Ln Cypress, TX | 3.0–5.0 | 2.0–3.5 | 1935 | $2,199 | $1.14 | 13d | 21 | 0.40mi |
| 20634 Longenbaugh Rd Cypress, TX | 2.0 | 2.0 | 1018 | $1,775 | $1.74 | 44d | 1 | 0.41mi |
| 20634 Longenbaugh Rd Cypress, TX | 2.0 | 2.0 | 1018 | $1,775 | $1.74 | 25d | 1 | 0.41mi |
| 7310 Coconut Bay Dr Cypress, TX | 4.0 | 2.0 | 1620 | $2,307 | $1.42 | 44d | 1 | 0.46mi |
| 20126 Breezy Oak Ct Cypress, TX | 3.0 | 2.0 | 1667 | $2,100 | $1.26 | 5d | 1 | 0.55mi |
| 20123 Braley Ct Cypress, TX | 3.0 | 2.5 | 1726 | $1,976 | $1.14 | 0d | 1 | 0.64mi |
| 20211 Longenbaugh Rd Cypress, TX | 1.0–3.0 | 1.0–2.0 | 1065 | $2,500 | $2.35 | 0d | 26 | 0.67mi |
| 19943 Crested Hill Ln Cypress, TX | 3.0 | 2.0 | 1204 | $1,621 | $1.35 | 8d | 1 | 0.68mi |
| 21054 Breezeway Cove Dr Bridgeland, TX | 3.0–4.0 | 2.5–3.5 | 1784 | $2,450 | $1.37 | 0d | 41 | 0.69mi |
| 20978 Farm to Market Road 529 Unit SWFS2 Cypress, TX | 2.0 | 2.0 | 1025 | $1,725 | $1.68 | 3d | 1 | 0.72mi |
| 20978 Farm to Market Road 529 Cypress, TX | 2.0 | 2.0 | 1025 | $1,725 | $1.68 | 44d | 1 | 0.72mi |
| 20217 Longenbaugh Rd Cypress, TX | 2.0 | 2.0 | 1112 | $1,565 | $1.41 | 44d | 1 | 0.73mi |
| 21235 Catalina Palm Dr Cypress, TX | 4.0 | 2.0 | 1756 | $2,600 | $1.48 | 44d | 1 | 0.74mi |
| 19917 Stoney Haven Dr Cypress, TX | 2.0 | 1.5 | 1060 | $1,579 | $1.49 | 44d | 1 | 0.79mi |
| 19939 Longenbaugh Rd Cypress, TX | 1.0–2.0 | 1.0–2.0 | 933 | $2,105 | $2.26 | 2d | 15 | 0.80mi |
| 8357 Fry Rd Cypress, TX | 2.0 | 2.0 | 1018 | $1,775 | $1.74 | 0d | 1 | 0.83mi |
| 8357 Fry Rd Unit FCC Cypress, TX | 2.0 | 2.0 | 1018 | $1,775 | $1.74 | 12d | 1 | 0.83mi |
| 20735 Dewberry Creek Ln Katy, TX | 4.0 | 2.0 | 1609 | $1,756 | $1.09 | 23d | 1 | 0.90mi |
| 7911 Tuscan Cypress Dr Cypress, TX | 4.0 | 3.0 | 1730 | $2,475 | $1.43 | 44d | 1 | 0.91mi |
| 6810 N Fry Rd Katy, TX | 1.0–3.0 | 1.0–3.0 | 1151 | $2,683 | $2.33 | 0d | 58 | 0.96mi |
| 19903 Mountain Dale Dr Cypress, TX | 3.0 | 2.0 | 1356 | $1,896 | $1.40 | 0d | 1 | 1.01mi |
| 7850 Maverick Trace Ln Cypress, TX | 3.0 | 3.0 | 1852 | $1,875 | $1.01 | 44d | 1 | 1.05mi |
| 21035 Carmel Valley Dr Katy, TX | 3.0 | 2.0 | 1431 | $1,791 | $1.25 | 25d | 1 | 1.05mi |
| 20507 Barker Bend Ct Katy, TX | 3.0 | 2.0 | 1488 | $1,825 | $1.23 | 44d | 1 | 1.11mi |
| 19715 Swan Valley Dr Cypress, TX | 3.0 | 2.0 | 1380 | $1,886 | $1.37 | 44d | 1 | 1.12mi |
| 6506 Garden Canyon Dr Katy, TX | 3.0 | 2.0 | 1842 | $1,895 | $1.03 | 23d | 1 | 1.27mi |
| 7558 Magnolia Orchid Ln Cypress, TX | 4.0 | 2.5 | 1743 | $2,390 | $1.37 | 44d | 1 | 1.28mi |
| 6619 Rusty Ridge Ln Katy, TX | 3.0 | 2.5 | 1450 | $1,895 | $1.31 | 4d | 1 | 1.29mi |
| 19442 Elmtree Estates Dr Katy, TX | 3.0 | 2.0 | 1735 | $1,776 | $1.02 | 13d | 1 | 1.31mi |
| 21447 FM 529 Rd Cypress, TX | 1.0–3.0 | 1.0–2.0 | 996 | $2,205 | $2.21 | 0d | 28 | 1.31mi |
| 19434 Glenway Falls Dr Katy, TX | 3.0 | 2.0 | 1326 | $1,800 | $1.36 | 44d | 1 | 1.40mi |
| 6402 Wild River Dr Katy, TX | 3.0 | 2.0 | 1572 | $2,091 | $1.33 | 3d | 1 | 1.45mi |
| 6747 Scarlet Sagebrush St Katy, TX | 3.0 | 2.0 | 1530 | $2,300 | $1.50 | 44d | 1 | 1.46mi |
HOA detail
- Monthly dues
- $48 · $576/yr
Listing history 16 events
-
2026-06-21days on market $231,467 Active 37 DOM
-
2026-06-18days on market $231,467 Active 34 DOM
-
2026-06-17days on market $231,467 Active 33 DOM
-
2026-06-16days on market $231,467 Active 32 DOM
-
2026-06-15days on market $231,467 Active 31 DOM
-
2026-06-13days on market $231,467 Active 29 DOM
-
2026-06-13days on market $231,467 Active 28 DOM
-
2026-06-09pricedays on market $231,467 Active 25 DOM
-
2026-06-08days on market $241,467 Active 24 DOM
-
2026-06-07days on market $241,467 Active 23 DOM
-
2026-06-04days on market $241,467 Active 20 DOM
-
2026-06-03days on market $241,467 Active 19 DOM
-
2026-06-02days on market $241,467 Active 18 DOM
-
2026-06-01days on market $241,467 Active 17 DOM
-
2026-05-31days on market $241,467 Active 16 DOM
-
2026-05-15$241,467 Active 414-char remark
ⓘ Source: listings_history table (triggers on properties + properties_extension) + one-shot
backfill from property_details.listing_events for pre-trigger history.
Tax reassessment forecast TX · Resets to sale price
- Current annual tax
- $5,108 · $426/mo
- Projected year-2 tax
- $5,108 · $426/mo
- Expected delta
- $0/yr ($0/mo · 0.0%)
ⓘ Screening estimate from a state-policy table — verify with the county assessor before closing.
Climate risk First Street
- Flood 1/10 Low FEMA zone X (unshaded) · 0% chance over 30 yrs
- Wildfire 3/10 Moderate
- Heat 9/10 Extreme 7 d/yr ≥110°F today · 23 d/yr by 30 yrs out
- Wind 8/10 Severe 99% chance of damaging wind over 30 yrs
- Air quality 2/10 Low 2 unhealthy d/yr today · 2 by 30 yrs out
Nearby sold comps map
Loading sold comps map…
Walkable amenities ~0.75 mi
Loading nearby amenities…
Taxation est. · year 1
- Rental income
- $25,234
- − Mortgage interest
- −$12,966
- − Property taxes
- −$5,108
- − Insurance
- −$1,157
- − Repairs & maintenance
- −$2,019
- − Management
- −$2,019
- − HOA
- −$576
- − Depreciation
- −$6,734
- Taxable loss
- −$5,344
- Est. tax savings @ 24.0%
- +$1,283
- After-tax cash flow
- $-190/yr
For passive investors: Depreciation is non-cash, so a rental often shows a tax loss while cash-flowing — sheltering income. Rental losses are passive: they offset passive income freely, and up to $25,000/yr can offset ordinary (W-2) income if you actively participate and your MAGI is under $100k (phasing out to $0 by $150k); unused losses carry forward. On sale, claimed depreciation is recaptured at up to 25%, and gains may owe capital-gains tax (a 1031 exchange can defer both). Figures are a year-1 estimate at your 24.0% rate — not tax advice; consult a CPA.
Schools (NCES district)
- District
- Cypress-Fairbanks ISD
- NCES district ID
- 4816110
- Math proficiency
- 45% ▼ -12.00%
- Reading proficiency
- 52% ▼ -2.00%
- Median HH income
- $72,025
- Composite
- 43.63/100
- National rank
- #2968
- State rank
- #161 of 826 in TX
Livability — Houston
- Score
- 74/100
- State rank
- #184
- US rank
- #4771
Category grades
Schools grade is shown separately in the Schools card above.
Census & demographics
- County
- Harris County · 4,702,590 people
- City population
- 3,226,434
- Metro
- Houston-The Woodlands-Sugar Land, TX
- Population (ZIP)
- 116,550
- Household income
- $143,934
- Rent vs Own
- Severe rent burden
- 1700.0
Population outlook (Harris County) Hauer SSP2
- Today (2025)
- 5,571,493 people
- By 2030
- 6,089,821 · +9.3%
- By 2040
- 7,142,806 · +28.2%
- By 2050
- 8,185,864 · +46.9%
- By 2075
- 10,574,329 · +89.8%
- By 2100
- 12,109,958 · +117.4%
Race, ethnicity, and origin ACS 2023
- Neighborhood character
- Highly diverse neighborhood (Simpson 0.73)
- Race & ethnicity
- White 39% Hispanic / Latino 27% Black 17% Two or more races 14% Asian 13%
- Hispanic origin (detail)
- Mexican 16%
- Common ancestry
- Lithuanian 2% Romanian 1% Italian 1%
- Foreign-born
- 21% · Canada, Vietnam, China
- Languages at home
- 66% English-only · Spanish 19% Other Indo-European 4% Vietnamese 4%
Political lean MEDSL · Harris
- 2024 margin
- Lean D (+5.5) · D 52.0% · R 46.4% · Other 1.6%
- 2008→2024 swing
- +3.9pp toward D · 2008: 1.6pp · 2024: 5.5pp
- All cycles
- 2024: D+5.5 2020: D+13.3 2016: D+12.4 2012: D+0.1 2008: D+1.6
Not yet ingested
- Civics
- —
Market trends
- HPI YoY
- ▼ -87.83%
- Current HPI
- 220.2136
- Rent YoY
- ▼ -1.27%
- Metro
- Houston-The Woodlands-Sugar Land, TX
- State GDP YoY
- ▲ 3.95%
- F500 in state
- 110
Industry mix (Fortune 500 HQ in TX)
| Industry | F500 HQs | Revenue |
|---|---|---|
| Energy | 16 | $1,198B |
|
||
| Technology | 5 | $198B |
|
||
| Engineering / Construction | 4 | $72B |
|
||
| Energy Services | 3 | $60B |
|
||
| Utilities | 3 | $41B |
|
||
| Healthcare | 2 | $330B |
|
||
Price history
-4.1% since first listed2 events — show timeline
- 2026-06-08 Price Changed $231,467 HARMLS
- 2026-05-15 Listed $241,467 HARMLS
Property tax history
+13.9%/yrLatest (2025): $5,108 · -0.5% YoY. Source: county tax records.
Cash-flow waterfall
monthlySold comps — $/sqft
last 12 mo · ≤1 miLoading sold comps…