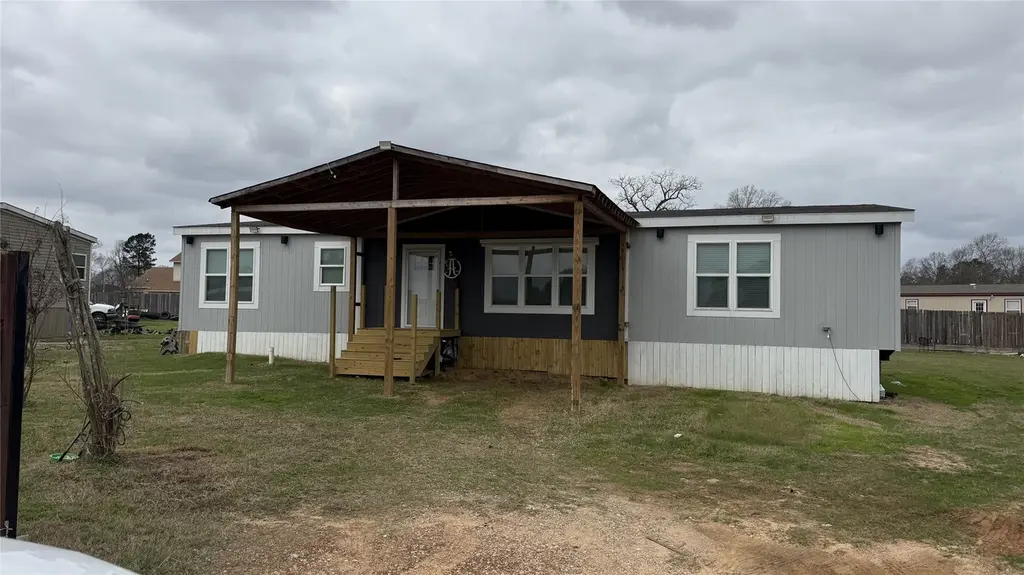
421 Bower Ln · Cut and Shoot, TX
Flood risk 1/10 · Minimal
- FEMA flood zone
- X (unshaded)
- Chance of flooding over 30 yrs
- 0.0%
- Est. flood insurance / yr
- $507 – $1,088
Fire risk 6/10 · Moderate
- Est. fire insurance / yr
- $1,222 – $2,270
Heat risk 9/10 · Severe
- Hot days now (above 111°F)
- 7 days/yr
- Hot days in 30 yrs
- 26 days/yr
Wind risk 8/10 · Major
- Chance of severe wind over 30 yrs
- 99.0%
Air-quality risk 2/10 · Minimal
- Unhealthy air days now
- 2 days/yr
- Unhealthy air days in 30 yrs
- 2 days/yr
Risk factors via First Street. Map © Google.
Why this score? — see what drove the B+ grade
The composite is a weighted blend of 9 inputs, each scored 0–100. Each bar is that input's sub-score; the figure is the points it added to the 100-point composite (weight × sub-score).
- Cash flow +30.0/30.0
- ARV discount +15.0/15.0
- DSCR +10.0/10.0
- 1% rule +8.0/10.0
- Schools +5.1/10.0
- Livability +2.8/5.0
- Condition / age +2.5/5.0
- Rent growth +2.4/5.0
- Appreciation +0.0/10.0
$149,990
🖨 Deal sheet 📄 Offer letter ✓ Due diligence
Listing remarks
Beautiful 2024 custom-built manufactured home located at 421 Bower in Conroe, TX. This property features 3 bedrooms, 2 full bathrooms, and an open-concept layout designed for modern living with a country feel. Situated on nearly half an acre, this unrestricted property offers endless possibilities—perfect for residential use, investment, or bringing your own vision to life. Enjoy the blend of contemporary finishes and spacious outdoor space in a peaceful setting
Key facts
- Peaceful setting
- Nearly half an acre
- Open-concept layout
Tags
Property features AI
Finance
- Other: Seller disclosure available
- HOA & community: Crockett Estate POA (annual association fee of $200)
Exterior
- Utilities: Public water; Public sewer
- Home design: Residential property; Built in 2024
- Construction: Composition roof; Block and pillar/post/pier foundation; Construction materials: Unknown
- Exterior features: Cleared lot in a subdivision
Interior
- Bedrooms: Three bedrooms on the first floor; Primary bedroom on the first floor
- Bathrooms: Two full bathrooms
- Heating & cooling: Central heating (electric); Central air conditioning (electric)
- Interior features: Open layout with 3 total rooms
Neighborhood map
What this means for you Summary
Snapshot
- This is a 3-bed/2.0-bath land listed at $150k.
Deal economics
- At list price, monthly cash flow is $648 ($8k/yr) — positive.
- The deal already cash-flows at list — no discount required.
- Meets the 1% rule at list price ($2k rent vs $150k).
- Cap rate 11.5% vs local median 4.8% in Cut and Shoot — top-decile yield for the area; either an underpriced asset or a hidden risk that comps aren't pricing in. Stress-test before assuming the spread holds.
Location & tenants
- Location reads 56/100 on livability (#1,326 in TX) — a working-class tenant base; expect higher turnover. Strengths: cost of living A+, housing A+; Watch: schools F, crime D-, amenities F.
- Conroe ISD (other): math 57% / reading 57% proficiency, ranked #69 of 826 in TX (top 8%) — acceptable for families but not a draw, mixed tenant base, ~2y average lease.
- Market conditions: Rents soft (-0.3%/yr); 714 active listings in the ZIP; 3 comparable units currently listed for rent nearby; rentals lingering (median 44d on market — plan ~5-8 weeks vacancy on turnover, expect pricing pressure); 67% of comp listings sitting > 30 days — soft ceiling on asking rent; solid renter incomes; 13,259 units permitted in Montgomery County in 2024 (1,402 in 5+ unit buildings).
- This rent runs 31% of the median local income ($75k/yr) — at the standard rent-burdened threshold; future hikes will face affordability resistance.
Forward outlook
- Local home prices are declining (-3.0%/yr); year-one equity from $1k of loan paydown is wiped out by about $4k of value loss. Plan a longer hold.
- Montgomery County population projected at +65% by 2050 — long-run rental-demand tailwind backs the buy-and-hold thesis.
- At projected returns (-3.0% appreciation + 0.0% rent growth), your $42k cash investment doubles in ~9 years — after that, you're playing with house money.
Negotiation context
- Only 9 days on market — expect competitive offers; lowballing is unlikely to land.
- 2 sale attempts with the ask held roughly flat each time — persistent listings suggest the price (not the market) is what's stuck; bring a comps-based counter.
Risks & watch-outs
- Climate carrying-cost: severe wind risk, 99% chance of damaging wind over 30y; major wildfire risk; extreme-heat days projected 7→26/yr by 2055 (HVAC capex compounding) — expect insurance premiums to compound above CPI over the hold.
Questions for the listing agent
- What does the HOA fee cover, when was the last increase, and are there any pending special assessments or reserve-fund shortfalls?
- Is there a deadline driving the sale (1031 exchange, divorce, estate, relocation)? That informs how much negotiation room exists.
- Schools are F-rated, which usually means shorter tenancies and higher turnover. Who's the typical renter profile here, and what's been the actual vacancy rate?
- Crime grade is D in this area — have there been break-ins, vandalism, or insurance claims at this property in the last 3 years? What carrier currently insures it and at what premium?
- What's the average days-on-market for RENTAL listings here right now (not sales)? A rising rental-DOM trend means longer vacancies and softer asking-rent achievability than the comps imply.
- What's the recent tenant-quality profile in this submarket — average credit score on applications, eviction rate, late-payment / NSF rate, and stable-employment percentage? A property-management company in the area should have these aggregated.
- How much new for-sale + rental construction is in the pipeline within 1–3 miles? Heavy new supply typically softens prices + rents 12–24 months out; constrained supply supports both.
Investment metrics
- 1% rule
- 1.30% ✓
- Cap rate
- 11.48%
- Cash-on-cash
- 18.53%
- DSCR
- 1.82
- GRM
- 6.4
CMA / ARV
- ARV (median comp)
- $192,728
- List price
- $149,990
- Delta
- -11.79%
- Verdict
- UNDERPRICED
- Comps
- 6 within 1.0 mi
Projected returns pro-forma
-3.0% appreciation · 0.0% rent growth · sell at horizon
- IRR
- 7.1%
- Equity multiple
- 1.27×
- Total profit
- $11,200
- Equity at exit
- $22,364
- IRR
- 13.8%
- Equity multiple
- 1.97×
- Total profit
- $40,540
- Equity at exit
- $12,968
Cash invested: $41,997 (down + closing). Projections, not guarantees.
Landlord ↔ Tenant lean methodology
- Overall (STATE)
- 87 Strongly Landlord-Friendly
- State Texas
- 87 Strongly Landlord-Friendly · R+5
- County
- — inherits STATE
- City
- — inherits STATE
ZIP-level market 77303
- Home prices YoY
- -22.4%
- Rents YoY
- -0.3%
- Active inventory
- 714
- Price-to-rent
- 6.4×
Monthly cashflow live
- Estimated rent
- $1,956 medium interval (Pro) →
- Mortgage (P&I)
- −$787
- Tax from tax record
- −$31 /mo · $374/yr
- Insurance
- −$62
- HOA
- −$17
- Vacancy / Maint / Mgmt
- −$411
- Net cashflow
- $648
Break-even live
UW: 25.0% down · 7.5% · 30yr · 1.5% tax · 5.0% vac · 8.0% maint · 8.0% mgmt
Financing live
Cash to close
- Down payment
- $37,498
- Closing costs
- $4,500
- Reserves months
- —
- Total cash needed
- —
Loan-product check · same deal, 3 products live
Conventional
25% down · 7.5% · 30yr
- Down + closing
- —
- Monthly P&I
- —
- Monthly cashflow
- —
- DSCR
- —
- Eligible?
- —
Personal DTI + credit; lowest rate.
DSCR
20% down · 8.5% · 30yr
- Down + closing
- —
- Monthly P&I
- —
- Monthly cashflow
- —
- DSCR
- —
- Eligible?
- —
No personal income docs; deal must DSCR.
Hard money
10% down · 12.0% · 12mo
- Down + closing
- —
- Monthly P&I
- —
- Monthly cashflow
- —
- DSCR
- —
- Eligible?
- —
Short-term bridge; refi at stabilization.
Rent comps 3 comps
| Address | Beds | Baths | Sqft | Rent | $/sqft | DOM | Units | Dist |
|---|---|---|---|---|---|---|---|---|
| 343 Parkin Ct Cut and Shoot, TX | 3.0 | 2.0 | 2014 | $1,985 | $0.99 | 43d | 1 | 0.71mi |
| 2140 Cedar Bend Dr Conroe, TX | 4.0 | 3.0 | 1871 | $1,995 | $1.07 | 10d | 1 | 1.17mi |
| 2221 Cedar Valley Dr Conroe, TX | 3.0 | 2.0 | 1920 | $1,695 | $0.88 | 43d | 1 | 1.19mi |
HOA detail
- Monthly dues
- $17 · $204/yr
Listing history 11 events
-
2026-06-09days on market $149,990 Active 9 DOM
-
2026-06-08days on market $149,990 Active 8 DOM
-
2026-06-07days on market $149,990 Active 7 DOM
-
2026-06-04days on market $149,990 Active 4 DOM
-
2026-06-03days on market $149,990 Active 3 DOM
-
2026-06-02days on market $149,990 Active 2 DOM
-
2026-06-01pricedays on market $149,990 Active 1 DOM
-
2026-05-31days on market $170,000 Active 68 DOM
-
2026-04-29price $170,000 472-char remark
-
2026-04-10price $190,000 472-char remark
-
2026-03-24$230,000 Active 472-char remark
ⓘ Source: listings_history table (triggers on properties + properties_extension) + one-shot
backfill from property_details.listing_events for pre-trigger history.
Tax reassessment forecast TX · Resets to sale price
- Current annual tax
- $374 · $31/mo
- Projected year-2 tax
- $2,745 · $229/mo
- Expected delta
- +$2,371/yr (+$198/mo · 634.6%)
ⓘ Screening estimate from a state-policy table — verify with the county assessor before closing.
Climate risk First Street
- Flood 1/10 Low FEMA zone X (unshaded) · 0% chance over 30 yrs
- Wildfire 6/10 Major
- Heat 9/10 Extreme 7 d/yr ≥111°F today · 26 d/yr by 30 yrs out
- Wind 8/10 Severe 99% chance of damaging wind over 30 yrs
- Air quality 2/10 Low 2 unhealthy d/yr today · 2 by 30 yrs out
Nearby sold comps map
Loading sold comps map…
Walkable amenities ~0.75 mi
Loading nearby amenities…
Taxation est. · year 1
- Rental income
- $23,477
- − Mortgage interest
- −$8,402
- − Property taxes
- −$374
- − Insurance
- −$750
- − Repairs & maintenance
- −$1,878
- − Management
- −$1,878
- − HOA
- −$204
- − Depreciation
- −$4,363
- Taxable income
- $5,628
- Est. tax owed @ 24.0%
- −$1,351
- After-tax cash flow
- $6,430/yr
For passive investors: Depreciation is non-cash, so a rental often shows a tax loss while cash-flowing — sheltering income. Rental losses are passive: they offset passive income freely, and up to $25,000/yr can offset ordinary (W-2) income if you actively participate and your MAGI is under $100k (phasing out to $0 by $150k); unused losses carry forward. On sale, claimed depreciation is recaptured at up to 25%, and gains may owe capital-gains tax (a 1031 exchange can defer both). Figures are a year-1 estimate at your 24.0% rate — not tax advice; consult a CPA.
Schools (NCES district)
- District
- Conroe ISD
- NCES district ID
- 4815000
- Math proficiency
- 57% ▼ -6.00%
- Reading proficiency
- 57% ▼ -1.00%
- Median HH income
- $71,541
- Composite
- 50.65/100
- National rank
- #1833
- State rank
- #69 of 826 in TX
Livability — Cut and Shoot
- Score
- 56/100
- State rank
- #1326
- US rank
- #22835
Category grades
Schools grade is shown separately in the Schools card above.
Census & demographics
- County
- Montgomery County · 663,713 people
- Metro
- Houston-The Woodlands-Sugar Land, TX
- Population (ZIP)
- 28,854
- Household income
- $75,348
- Rent vs Own
- Severe rent burden
- 464.0
Population outlook (Montgomery County) Hauer SSP2
- Today (2025)
- 713,896 people
- By 2030
- 805,263 · +12.8%
- By 2040
- 992,708 · +39.1%
- By 2050
- 1,179,590 · +65.2%
- By 2075
- 1,628,084 · +128.1%
- By 2100
- 1,937,880 · +171.5%
Race, ethnicity, and origin ACS 2023
- Neighborhood character
- Diverse neighborhood (Simpson 0.56)
- Race & ethnicity
- White 54% Hispanic / Latino 38% Two or more races 17% Black 4%
- Hispanic origin (detail)
- Mexican 25%
- Common ancestry
- Lithuanian 1% Romanian 1% Slovak 1%
- Foreign-born
- 13% · Canada, Jamaica
- Languages at home
- 69% English-only · Spanish 31%
Political lean MEDSL · Montgomery
- 2024 margin
- Solid R (+45.5) · D 26.8% · R 72.3%
- 2008→2024 swing
- +7.2pp toward D · 2008: -52.7pp · 2024: -45.5pp
- All cycles
- 2024: R+45.5 2020: R+43.8 2016: R+51.4 2012: R+60.7 2008: R+52.7
Not yet ingested
- Civics
- —
Market trends
- HPI YoY
- ▼ -77.71%
- Current HPI
- 269.5367
- Rent YoY
- ▼ -0.31%
- Metro
- Houston-The Woodlands-Sugar Land, TX
- State GDP YoY
- ▲ 3.95%
- F500 in state
- 110
Industry mix (Fortune 500 HQ in TX)
| Industry | F500 HQs | Revenue |
|---|---|---|
| Energy | 16 | $1,198B |
|
||
| Technology | 5 | $198B |
|
||
| Engineering / Construction | 4 | $72B |
|
||
| Energy Services | 3 | $60B |
|
||
| Utilities | 3 | $41B |
|
||
| Healthcare | 2 | $330B |
|
||
Price history
-34.8% since first listed6 events — show timeline
- 2026-06-12 Listing Removed — HARMLS
- 2026-05-31 Listing Removed — HARMLS
- 2026-05-31 Listed $149,990 HARMLS
- 2026-04-29 Price Changed $170,000 HARMLS
- 2026-04-10 Price Changed $190,000 HARMLS
- 2026-03-24 Listed $230,000 HARMLS
Property tax history
+10.6%/yrLatest (2025): $374 · -0.4% YoY. Source: county tax records.
Cash-flow waterfall
monthlySold comps — $/sqft
last 12 mo · ≤1 miLoading sold comps…