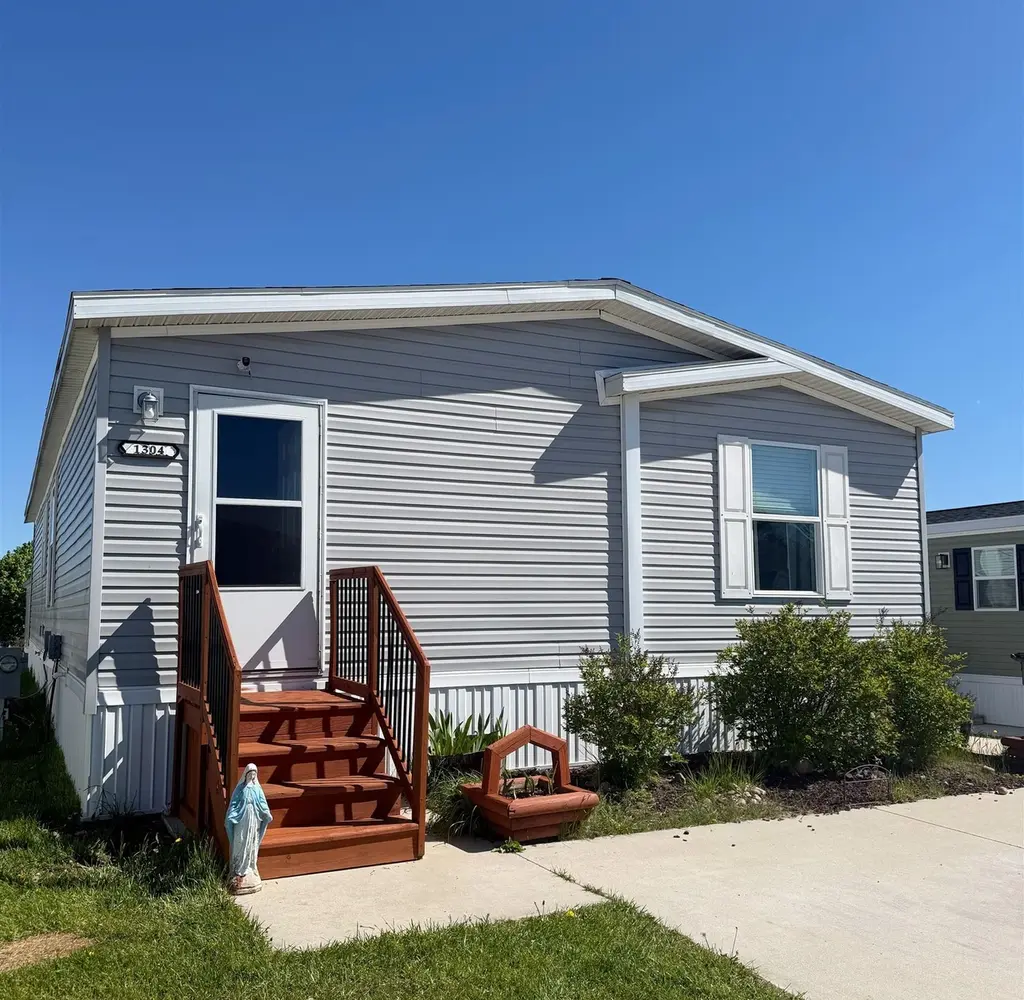
1304 Powder Horn Dr · Mount Pleasant, MI
Flood risk No data
- FEMA flood zone
- —
- Chance of flooding over 30 yrs
- —
- Est. flood insurance / yr
- —
Fire risk No data
- Est. fire insurance / yr
- —
Heat risk No data
- Hot days now (above threshold)
- —
- Hot days in 30 yrs
- —
Wind risk No data
- Chance of severe wind over 30 yrs
- —
Air-quality risk No data
- Unhealthy air days now
- —
- Unhealthy air days in 30 yrs
- —
Risk factors via First Street. Map © Google.
Why this score? — see what drove the B grade
The composite is a weighted blend of 9 inputs, each scored 0–100. Each bar is that input's sub-score; the figure is the points it added to the 100-point composite (weight × sub-score).
- Cash flow +30.0/30.0
- 1% rule +10.0/10.0
- DSCR +10.0/10.0
- ARV discount +7.5/15.0
- Rent growth +5.0/5.0
- Livability +4.1/5.0
- Schools +3.3/10.0
- Condition / age +2.5/5.0
- Appreciation +0.0/10.0
$80,000
🖨 Deal sheet 📄 Offer letter ✓ Due diligence
Listing remarks MLS
Welcome to Summerhill Village. .. Lets talk about comfort, convenience and a peaceful setting. This 3 bedroom 2 bathroom is ready for its new owners. Inside you will enjoy the comforts of central air, open kitchen overlooking the living space. The large island is great for baking and can we talk about the large pantry? The main bedroom has a massive walk- in- closet with built -in storage. Summerhill Community offers a new Clubhouse that includes a playground, dog park and outdoor space and is ideal for your private parties and gatherings. Public transportation is available. All village infrastructure (water, sewer and internet lines) has been updated. Lot Rent is $460
Key facts
- Built in storage
- Large island
- Large pantry
Tags
Property features AI
Exterior
- Utilities: Public water; Shared septic
- Home design: Single-family residence; One story
- Construction: Vinyl siding; Pillar/post/pier foundation; Built area above grade: 1,404 square feet
- Exterior features: Shed(s); Pets allowed
Interior
- Kitchen: Dishwasher; Microwave; Oven; Range; Refrigerator
- Bedrooms: 3 bedrooms
- Bathrooms: 2 full bathrooms
- Heating & cooling: Central air; Ceiling fan(s); Forced air heating; Natural gas heating
- Interior features: Entrance foyer; Seven total rooms
Neighborhood map
What this means for you Summary
Snapshot
- This is a 3-bed/2.0-bath other listed at $80k.
Deal economics
- At list price, monthly cash flow is $515 ($6k/yr) — positive.
- The deal already cash-flows at list — no discount required.
- Meets the 1% rule at list price ($1k rent vs $80k).
- Recommended offer: $70k (12.0% below list) — sets the bar for market timing.
- Cap rate 14.0% vs local median 3.4% in Mount Pleasant — top-decile yield for the area; either an underpriced asset or a hidden risk that comps aren't pricing in. Stress-test before assuming the spread holds.
Location & tenants
- Location reads 82/100 on livability (#55 in MI, #1,063 nationally) — a professional / high-income tenant draw. Strengths: amenities A+, cost of living A+, health & safety A+; Watch: crime C-, employment F.
- Mt. Pleasant City School District (town): math 33% / reading 48% proficiency, ranked #229 of 540 in MI (top 42%) — families likely to look elsewhere, expect single-tenant / working-renter base with shorter leases.
- Market conditions: Rents rising fast (+16.9%/yr); 249 active listings in the ZIP; 1 comparable units currently listed for rent nearby; 72 units permitted in Isabella County in 2024 (0 in 5+ unit buildings).
- This rent runs 32% of the median local income ($51k/yr) — at the standard rent-burdened threshold; future hikes will face affordability resistance.
Forward outlook
- Local home prices are declining (-3.0%/yr); year-one equity from $553 of loan paydown is wiped out by about $2k of value loss. Plan a longer hold.
- Isabella County population projected at +9% by 2050 — modest demand growth; plan on rents tracking national, not racing it.
- At projected returns (-3.0% appreciation + 8.0% rent growth), your $22k cash investment doubles in ~4 years — after that, you're playing with house money.
Negotiation context
- It's been on market 130 days — a 12% lower offer ($70k) is reasonable based on typical stale-listing flexibility.
- 10 sale attempts since 5y ago with the ask held roughly flat each time — persistent listings suggest the price (not the market) is what's stuck; bring a comps-based counter.
Questions for the listing agent
- It's been on market 130 days. Have you received any prior offers? Is the seller open to a 12% concession, seller financing, or rate buy-down credit?
- Why hasn't it sold? Are there any deal-killer items the seller is aware of (foundation, flood, title, zoning, code violations)?
- Is there a deadline driving the sale (1031 exchange, divorce, estate, relocation)? That informs how much negotiation room exists.
- Schools are B-rated — typically a magnet for longer-tenancy family renters. What's the average tenant stay here, and is there a school-zone premium baked into asking?
- What's the average days-on-market for RENTAL listings here right now (not sales)? A rising rental-DOM trend means longer vacancies and softer asking-rent achievability than the comps imply.
- What's the recent tenant-quality profile in this submarket — average credit score on applications, eviction rate, late-payment / NSF rate, and stable-employment percentage? A property-management company in the area should have these aggregated.
- How much new for-sale + rental construction is in the pipeline within 1–3 miles? Heavy new supply typically softens prices + rents 12–24 months out; constrained supply supports both.
Investment metrics
- 1% rule
- 1.69% ✓
- Cap rate
- 14.02%
- Cash-on-cash
- 27.59%
- DSCR
- 2.23
- GRM
- 4.9
CMA / ARV
No comps found within radius.
Projected returns pro-forma
-3.0% appreciation · 8.0% rent growth · sell at horizon
- IRR
- 27.2%
- Equity multiple
- 2.21×
- Total profit
- $27,000
- Equity at exit
- $11,928
- IRR
- 37.6%
- Equity multiple
- 5.39×
- Total profit
- $98,342
- Equity at exit
- $6,917
Cash invested: $22,400 (down + closing). Projections, not guarantees.
Landlord ↔ Tenant lean methodology
- Overall (STATE)
- 62 Landlord-Friendly
- State Michigan
- 62 Landlord-Friendly · EVEN
- County
- — inherits STATE
- City
- — inherits STATE
ZIP-level market 48858
- Home prices YoY
- -31.9%
- Rents YoY
- 16.9%
- Active inventory
- 249
- Price-to-rent
- 4.9×
Monthly cashflow live
- Estimated rent
- $1,352 medium interval (Pro) →
- Mortgage (P&I)
- −$420
- Tax est. 1.5%
- −$100 /mo · $1,200/yr
- Insurance
- −$33
- HOA
- −$0
- Vacancy / Maint / Mgmt
- −$284
- Net cashflow
- $515
Break-even live
UW: 25.0% down · 7.5% · 30yr · 1.5% tax · 5.0% vac · 8.0% maint · 8.0% mgmt
Financing live
Cash to close
- Down payment
- $20,000
- Closing costs
- $2,400
- Reserves months
- —
- Total cash needed
- —
Loan-product check · same deal, 3 products live
Conventional
25% down · 7.5% · 30yr
- Down + closing
- —
- Monthly P&I
- —
- Monthly cashflow
- —
- DSCR
- —
- Eligible?
- —
Personal DTI + credit; lowest rate.
DSCR
20% down · 8.5% · 30yr
- Down + closing
- —
- Monthly P&I
- —
- Monthly cashflow
- —
- DSCR
- —
- Eligible?
- —
No personal income docs; deal must DSCR.
Hard money
10% down · 12.0% · 12mo
- Down + closing
- —
- Monthly P&I
- —
- Monthly cashflow
- —
- DSCR
- —
- Eligible?
- —
Short-term bridge; refi at stabilization.
Rent comps 1 comps
| Address | Beds | Baths | Sqft | Rent | $/sqft | DOM | Units | Dist |
|---|---|---|---|---|---|---|---|---|
| 5280 S Mission Rd Mt Pleasant, MI | 2.0–4.0 | 2.0 | 1264 | $1,332 | $1.05 | 43d | 4 | 0.14mi |
Listing history 50 events
-
2026-06-19days on market $80,000 Active 130 DOM
-
2026-06-18days on market $80,000 Active 129 DOM
-
2026-06-17days on market $80,000 Active 128 DOM
-
2026-06-16days on market $80,000 Active 127 DOM
-
2026-06-15days on market $80,000 Active 126 DOM
-
2026-06-14days on market $80,000 Active 124 DOM
-
2026-06-12days on market $80,000 Active 123 DOM
-
2026-06-09days on market $80,000 Active 120 DOM
-
2026-06-08days on market $80,000 Active 119 DOM
-
2026-06-07days on market $80,000 Active 118 DOM
-
2026-06-05days on market $80,000 Active 115 DOM
-
2026-06-03days on market $80,000 Active 114 DOM
-
2026-06-02days on market $80,000 Active 113 DOM
-
2026-06-01days on market $80,000 Active 112 DOM
-
2026-05-31days on market $80,000 Active 111 DOM
-
2026-05-30days on market $80,000 Active 110 DOM
-
2026-02-09$80,000 Active
Show marketing remark (677 chars)
Welcome to Summerhill Village. .. Lets talk about comfort, convenience and a peaceful setting. This 3 bedroom 2 bathroom is ready for its new owners. Inside you will enjoy the comforts of central air, open kitchen overlooking the living space. The large island is great for baking and can we talk about the large pantry? The main bedroom has a massive walk- in- closet with built -in storage. Summerhill Community offers a new Clubhouse that includes a playground, dog park and outdoor space and is ideal for your private parties and gatherings. Public transportation is available. All village infrastructure (water, sewer and internet lines) has been updated. Lot Rent is $460
-
2026-02-09$80,000 Active 677-char remark
Show marketing remark (677 chars)
Welcome to Summerhill Village. .. Lets talk about comfort, convenience and a peaceful setting. This 3 bedroom 2 bathroom is ready for its new owners. Inside you will enjoy the comforts of central air, open kitchen overlooking the living space. The large island is great for baking and can we talk about the large pantry? The main bedroom has a massive walk- in- closet with built -in storage. Summerhill Community offers a new Clubhouse that includes a playground, dog park and outdoor space and is ideal for your private parties and gatherings. Public transportation is available. All village infrastructure (water, sewer and internet lines) has been updated. Lot Rent is $460
-
2024-11-01historical
-
2024-10-31historical
-
2024-08-29price $77,000
-
2024-08-28price $77,000
-
2024-08-28price $77,000
-
2024-08-22historical
-
2024-06-23price $85,000
-
2024-06-23price $85,000
-
2024-06-22price $85,000
-
2024-06-22price $85,000
-
2024-04-02$88,000 Active
-
2024-04-02$88,000 Active
-
2024-04-02$88,000 Active
-
2024-04-01historical
-
2024-03-31historical
-
2024-02-23price $88,000
-
2024-02-23price $88,000
-
2024-02-22price $88,000
-
2024-01-31price $88,500
-
2024-01-30price $88,500
-
2024-01-30price $88,500
-
2023-12-05historical
-
2023-12-05$89,000 Active
-
2023-12-05$89,000 Active
-
2023-12-05historical
-
2023-11-01price $89,000
-
2023-11-01price $89,000
-
2023-11-01price $89,000
-
2023-10-21price $90,000
-
2023-10-20price $90,000
-
2023-10-20price $90,000
-
2023-09-27$95,000 Active
ⓘ Source: listings_history table (triggers on properties + properties_extension) + one-shot
backfill from property_details.listing_events for pre-trigger history.
Nearby sold comps map
Loading sold comps map…
Walkable amenities ~0.75 mi
Loading nearby amenities…
Taxation est. · year 1
- Rental income
- $16,221
- − Mortgage interest
- −$4,481
- − Property taxes
- −$1,200
- − Insurance
- −$400
- − Repairs & maintenance
- −$1,298
- − Management
- −$1,298
- − Depreciation
- −$2,327
- Taxable income
- $5,217
- Est. tax owed @ 24.0%
- −$1,252
- After-tax cash flow
- $4,928/yr
For passive investors: Depreciation is non-cash, so a rental often shows a tax loss while cash-flowing — sheltering income. Rental losses are passive: they offset passive income freely, and up to $25,000/yr can offset ordinary (W-2) income if you actively participate and your MAGI is under $100k (phasing out to $0 by $150k); unused losses carry forward. On sale, claimed depreciation is recaptured at up to 25%, and gains may owe capital-gains tax (a 1031 exchange can defer both). Figures are a year-1 estimate at your 24.0% rate — not tax advice; consult a CPA.
Schools (NCES district)
- District
- Mt. Pleasant City School District
- NCES district ID
- 2624750
- Math proficiency
- 33% ▼ -5.00%
- Reading proficiency
- 48% ▼ -3.00%
- Median HH income
- $32,344
- Composite
- 33.16/100
- National rank
- #5548
- State rank
- #229 of 540 in MI
Livability — Mount Pleasant
- Score
- 82/100
- State rank
- #55
- US rank
- #1063
Category grades
Schools grade is shown separately in the Schools card above.
Census & demographics
- County
- Isabella County · 42,226 people
- Metro
- Mount Pleasant, MI
- Population (ZIP)
- 42,226
- Household income
- $51,267
- Rent vs Own
- Severe rent burden
- 2381.0
Population outlook (Isabella County) Hauer SSP2
- Today (2025)
- 75,111 people
- By 2030
- 77,600 · +3.3%
- By 2040
- 79,890 · +6.4%
- By 2050
- 81,568 · +8.6%
- By 2075
- 86,602 · +15.3%
- By 2100
- 92,201 · +22.8%
Race, ethnicity, and origin ACS 2023
- Neighborhood character
- Predominantly White (81%)
- Race & ethnicity
- White 81% Two or more races 6% Hispanic / Latino 5% Native American 4% Black 3% Asian 2%
- Hispanic origin (detail)
- Mexican 3%
- Common ancestry
- Romanian 6% Slovak 3% Iranian 3%
- Foreign-born
- 4% · Canada
- Languages at home
- 94% English-only · Spanish 2% Other Indo-European 1% German/W. Germanic 0%
Political lean MEDSL · Isabella
- 2024 margin
- Lean R (+7.5) · D 45.5% · R 53.0% · Other 1.6%
- 2008→2024 swing
- -26.7pp toward R · 2008: 19.2pp · 2024: -7.5pp
- All cycles
- 2024: R+7.5 2020: R+2.5 2016: R+3.7 2012: D+9.3 2008: D+19.2
Not yet ingested
- Civics
- —
Market trends
- HPI YoY
- ▼ -96.75%
- Current HPI
- 206.1153
- Rent YoY
- ▲ 16.89%
- Metro
- Mount Pleasant, MI
- State GDP YoY
- ▲ 1.37%
- F500 in state
- 28
Industry mix (Fortune 500 HQ in MI)
| Industry | F500 HQs | Revenue |
|---|---|---|
| Automotive Parts | 3 | $48B |
|
||
| Automotive | 2 | $372B |
|
||
| Chemicals | 1 | $45B |
|
||
| Automotive Retail | 1 | $29B |
|
||
| Healthcare / Medical Devices | 1 | $23B |
|
||
| Automotive Technology | 1 | $20B |
|
||
Price history
+1.7% since first listed37 events — show timeline
- 2026-02-09 Listed $80,000 REALCOMP
- 2026-02-09 Listed $80,000 MiRealSource-MiMLS
- 2024-11-01 Listing Removed — MiRealSource-MiMLS
- 2024-10-31 Listing Removed — REALCOMP
- 2024-08-29 Price Changed $77,000 MiRealSource-MiMLS
- 2024-08-28 Price Changed $77,000 REALCOMP
- 2024-08-28 Price Changed $77,000 SW Michigan MLS
- 2024-08-22 Listing Removed — MiRealSource-MiMLS
- 2024-06-23 Price Changed $85,000 MiRealSource-MiMLS
- 2024-06-23 Price Changed $85,000 MiRealSource-MiMLS
- 2024-06-22 Price Changed $85,000 REALCOMP
- 2024-06-22 Price Changed $85,000 SW Michigan MLS
- 2024-04-02 Listed $88,000 MiRealSource-MiMLS
- 2024-04-02 Listed $88,000 MiRealSource-MiMLS
- 2024-04-02 Listed $88,000 REALCOMP
- 2024-04-01 Listing Removed — MiRealSource-MiMLS
- 2024-03-31 Listing Removed — REALCOMP
- 2024-02-23 Price Changed $88,000 MiRealSource-MiMLS
- 2024-02-23 Price Changed $88,000 REALCOMP
- 2024-02-22 Price Changed $88,000 SW Michigan MLS
- 2024-01-31 Price Changed $88,500 MiRealSource-MiMLS
- 2024-01-30 Price Changed $88,500 REALCOMP
- 2024-01-30 Price Changed $88,500 SW Michigan MLS
- 2023-12-05 Listing Removed — MiRealSource-MiMLS
- 2023-12-05 Listed $89,000 MiRealSource-MiMLS
- 2023-12-05 Listed $89,000 REALCOMP
- 2023-12-05 Listing Removed — REALCOMP
- 2023-11-01 Price Changed $89,000 MiRealSource-MiMLS
- 2023-11-01 Price Changed $89,000 REALCOMP
- 2023-11-01 Price Changed $89,000 SW Michigan MLS
- 2023-10-21 Price Changed $90,000 MiRealSource-MiMLS
- 2023-10-20 Price Changed $90,000 REALCOMP
- 2023-10-20 Price Changed $90,000 SW Michigan MLS
- 2023-09-27 Listed $95,000 MiRealSource-MiMLS
- 2023-09-27 Listed $95,000 REALCOMP
- 2021-06-25 Sold (MLS) $78,699 REALCOMP
- 2021-06-03 Listed $78,699 REALCOMP
Cash-flow waterfall
monthlySold comps — $/sqft
last 12 mo · ≤1 miLoading sold comps…