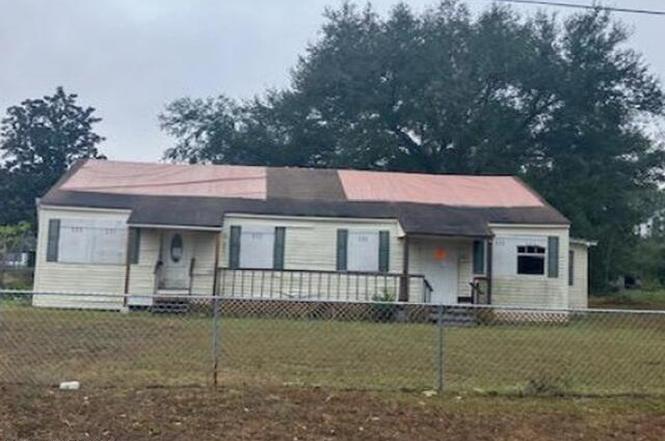
 Duplex
7220 Bunion Dr · Jacksonville, FL
Flood risk 1/10 · Minimal
- FEMA flood zone
- X (unshaded)
- Chance of flooding over 30 yrs
- 0.0%
- Est. flood insurance / yr
- $507 – $1,088
Fire risk 5/10 · Moderate
- Est. fire insurance / yr
- $947 – $1,759
Heat risk 8/10 · Major
- Hot days now (above 107°F)
- 7 days/yr
- Hot days in 30 yrs
- 20 days/yr
Wind risk 10/10 · Severe
- Chance of severe wind over 30 yrs
- 99.0%
Air-quality risk 3/10 · Minor
- Unhealthy air days now
- 3 days/yr
- Unhealthy air days in 30 yrs
- 4 days/yr
Risk factors via First Street. Map © Google.
Why this score? — see what drove the D+ grade
The composite is a weighted blend of 9 inputs, each scored 0–100. Each bar is that input's sub-score; the figure is the points it added to the 100-point composite (weight × sub-score).
- Cash flow +15.0/30.0
- ARV discount +7.5/15.0
- 1% rule +5.0/10.0
- DSCR +5.0/10.0
- Livability +4.2/5.0
- Schools +3.9/10.0
- Rent growth +3.2/5.0
- Condition / age +2.5/5.0
- Appreciation +0.0/10.0
$61,500
🖨 Deal sheet 📄 Offer letter ✓ Due diligence
Multi-family units
County records classify this as Multi-Family (5+ Unit). Listing-text estimate: 2 units. estimate disagrees with records
5+ unit building — per-unit beds/baths from public records are typically unavailable; the breakdown below (if shown) is an estimate from the listing text.
Listing remarks MLS
Perfect Investment Property! Each side has 2 bed 1 bath. New electric, New Central heating and cooling, new vinyl siding, and new plumbing. Lot dimensions are 300 x 105. Storage unit 20 x 30. All appliances Stay! 3/4 Acre fenced in. This home wont last long!
Key facts
- Income potential
- Large lot
- Many renovations
Tags
Neighborhood map
What this means for you Summary
Snapshot
- This is a 2 × 2-bed/1.0-bath units multifamily listed at $62k.
Deal economics
- At list price, monthly cash flow is $2k ($26k/yr) — positive. Per door: $1k/mo.
- The deal already cash-flows at list — no discount required.
- Meets the 1% rule at list price ($3k rent vs $62k).
- Recommended offer: $61k (1.5% below list) — sets the bar for market timing.
- Cap rate 48.0% vs local median 4.0% in Jacksonville — top-decile yield for the area; either an underpriced asset or a hidden risk that comps aren't pricing in. Stress-test before assuming the spread holds.
Location & tenants
- Location reads 83/100 on livability (#50 in FL, #911 nationally) — a professional / high-income tenant draw. Strengths: amenities A+, commute A+, housing A+.
- Duval (urban): math 46% / reading 45% proficiency, ranked #48 of 73 in FL (top 66%) — families likely to look elsewhere, expect single-tenant / working-renter base with shorter leases.
- Market conditions: Rents rising (+2.6%/yr); 137 active listings in the ZIP; 33 comparable units currently listed for rent nearby; rentals at typical pace (median 15d on market — plan ~3-4 weeks tenant-placement turnaround); solid renter incomes; 6,503 units permitted in Duval County in 2024 (1,131 in 5+ unit buildings).
- At $3,243/mo this rent would consume 45% of the median local household income ($86k/yr) (locally 666% of renters already pay >50% of income on rent) — very limited rent-growth headroom before tenants either downsize or default.
Forward outlook
- Local home prices are declining (-3.0%/yr); year-one equity from $425 of loan paydown is wiped out by about $2k of value loss. Plan a longer hold.
- Duval County population projected at +19% by 2050 — long-run rental-demand tailwind backs the buy-and-hold thesis.
- At projected returns (-3.0% appreciation + 2.6% rent growth), your $17k cash investment doubles in ~1 year — after that, you're playing with house money.
Negotiation context
- It's been on market 18 days — a 2% lower offer ($61k) is reasonable based on typical stale-listing flexibility.
- 4 sale attempts since 22y ago with the ask held roughly flat each time — persistent listings suggest the price (not the market) is what's stuck; bring a comps-based counter.
Risks & watch-outs
- Watch-outs: built in 1942 — expect roof / HVAC / electrical / plumbing capex.
- Climate carrying-cost: severe wind risk, 99% chance of damaging wind over 30y; moderate wildfire risk; extreme-heat days projected 7→20/yr by 2055 (HVAC capex compounding) — expect insurance premiums to compound above CPI over the hold.
Questions for the listing agent
- Can we see the unit-by-unit rent roll, current vacancy, and any below-market leases? What's the average tenancy length?
- What capital expenditures (roof, boiler, parking lot, exteriors) have been made in the last 5 years, and what's planned in the next 2?
- Built in 1942 — when were the roof, HVAC, electrical panel, plumbing, and water heater last replaced?
- Is there a deadline driving the sale (1031 exchange, divorce, estate, relocation)? That informs how much negotiation room exists.
- Schools are B-rated — typically a magnet for longer-tenancy family renters. What's the average tenant stay here, and is there a school-zone premium baked into asking?
- The area grade is low — what's the realistic commute time and amenity access for the typical tenant pool here? Any planned neighborhood developments (good or bad) we should know about?
- What's the average days-on-market for RENTAL listings here right now (not sales)? A rising rental-DOM trend means longer vacancies and softer asking-rent achievability than the comps imply.
- What's the recent tenant-quality profile in this submarket — average credit score on applications, eviction rate, late-payment / NSF rate, and stable-employment percentage? A property-management company in the area should have these aggregated.
- How much new apartment / multifamily construction is in the pipeline within 1–3 miles? Heavy new supply (>2% of stock underway) typically softens rents 12–24 months out; light construction supports rent growth.
Investment metrics
- 1% rule
- 5.27% ✓
- Cap rate
- 47.99%
- Cash-on-cash
- 148.92%
- DSCR
- 7.63
- GRM
- 1.6
CMA / ARV
No comps found within radius.
Projected returns pro-forma
-3.0% appreciation · 2.62% rent growth · sell at horizon
- IRR
- —
- Equity multiple
- 8.26×
- Total profit
- $124,952
- Equity at exit
- $9,170
- IRR
- —
- Equity multiple
- 17.22×
- Total profit
- $279,230
- Equity at exit
- $5,317
Cash invested: $17,220 (down + closing). Projections, not guarantees.
Landlord ↔ Tenant lean methodology
- Overall (STATE)
- 87 Strongly Landlord-Friendly
- State Florida
- 87 Strongly Landlord-Friendly · R+3
- County
- — inherits STATE
- City
- — inherits STATE
ZIP-level market 32222
- Home prices YoY
- -20.0%
- Rents YoY
- 2.6%
- Active inventory
- 137
- Price-to-rent
- 3.2×
Monthly cashflow live
- Estimated rent
- $3,243 medium interval (Pro) →
- Mortgage (P&I)
- −$323
- Tax est. 1.5%
- −$77 /mo · $922/yr
- Insurance
- −$26
- HOA
- −$0
- Vacancy / Maint / Mgmt
- −$681
- Net cashflow
- $2,137
Break-even live
2-unit breakdown (identical units grouped — click to expand)
| Units | Beds | Baths | Est. rent |
|---|---|---|---|
| 2× units | 2 | 1 | $3,242 |
| #1 | 2 | 1 | $1,621 |
| #2 | 2 | 1 | $1,621 |
| Total (2 units) | $3,243 | ||
UW: 25.0% down · 7.5% · 30yr · 1.5% tax · 5.0% vac · 8.0% maint · 8.0% mgmt
Financing live
Cash to close
- Down payment
- $15,375
- Closing costs
- $1,845
- Reserves months
- —
- Total cash needed
- —
Loan-product check · same deal, 3 products live
Conventional
25% down · 7.5% · 30yr
- Down + closing
- —
- Monthly P&I
- —
- Monthly cashflow
- —
- DSCR
- —
- Eligible?
- —
Personal DTI + credit; lowest rate.
DSCR
20% down · 8.5% · 30yr
- Down + closing
- —
- Monthly P&I
- —
- Monthly cashflow
- —
- DSCR
- —
- Eligible?
- —
No personal income docs; deal must DSCR.
Hard money
10% down · 12.0% · 12mo
- Down + closing
- —
- Monthly P&I
- —
- Monthly cashflow
- —
- DSCR
- —
- Eligible?
- —
Short-term bridge; refi at stabilization.
Rent comps 33 comps
| Address | Beds | Baths | Sqft | Rent | $/sqft | DOM | Units | Dist |
|---|---|---|---|---|---|---|---|---|
| 7529 Falcon Trace Dr W Jacksonville, FL | 3.0 | 2.0 | 1484 | $1,850 | $1.25 | 2d | 1 | 0.52mi |
| 6925 Monica Ct Jacksonville, FL | 4.0 | 2.0 | 1526 | $1,840 | $1.21 | 24d | 1 | 0.59mi |
| 7573 Falcon Trace Ct Jacksonville, FL | 3.0 | 2.0 | 1385 | $1,750 | $1.26 | 14d | 1 | 0.66mi |
| 8754 Kaye Ln Jacksonville, FL | 4.0 | 2.0 | 1760 | $2,120 | $1.20 | 24d | 1 | 0.76mi |
| 8073 Leafcrest Dr Jacksonville, FL | 3.0 | 2.0 | 1525 | $1,845 | $1.21 | 4d | 1 | 0.79mi |
| 8682 Kaye Ln Jacksonville, FL | 4.0 | 2.0 | 1648 | $2,024 | $1.23 | 4d | 1 | 0.85mi |
| 8682 Kaye Ln Jacksonville, FL | 4.0 | 2.0 | 1648 | $2,024 | $1.23 | 7d | 1 | 0.85mi |
| 7540 Collins Ct Jacksonville, FL | 3.0 | 2.0 | 1472 | $1,785 | $1.21 | 24d | 1 | 0.87mi |
| 8137 Leafcrest Dr Jacksonville, FL | 3.0 | 2.0 | 1427 | $1,855 | $1.30 | 7d | 1 | 0.89mi |
| 8146 Leafcrest Dr Jacksonville, FL | 4.0 | 2.0 | 2163 | $2,300 | $1.06 | 10d | 1 | 0.91mi |
| 9202 Redtail Dr Jacksonville, FL | 4.0 | 2.0 | 1669 | $2,060 | $1.23 | 4d | 1 | 0.92mi |
| 8522 Sugartree Dr Jacksonville, FL | 3.0 | 2.0 | 1437 | $1,895 | $1.32 | 4d | 1 | 0.92mi |
| 7650 Dover Cliff Dr S Jacksonville, FL | 3.0 | 2.0 | 1248 | $1,880 | $1.51 | 4d | 1 | 0.92mi |
| 7658 Collins Ridge Blvd Jacksonville, FL | 3.0 | 2.0 | 1542 | $1,881 | $1.22 | 20d | 1 | 1.03mi |
| 8516 Bending Branch Ct Jacksonville, FL | 3.0 | 2.0 | 1573 | $1,775 | $1.13 | 16d | 1 | 1.03mi |
| 8023 Tuxford Ln Jacksonville, FL | 3.0 | 2.0 | 1538 | $1,950 | $1.27 | 24d | 1 | 1.08mi |
| 8131 Cumberland Gap Trl Jacksonville, FL | 3.0 | 2.0 | 1298 | $1,624 | $1.25 | 14d | 1 | 1.15mi |
| 8077 Welbeck Ln Jacksonville, FL | 3.0 | 2.0 | 1460 | $1,985 | $1.36 | 10d | 1 | 1.17mi |
| 8077 Cumberland Gap Trl Jacksonville, FL | 3.0 | 2.5 | 1307 | $1,750 | $1.34 | 24d | 1 | 1.18mi |
| 8382 Stelling Dr S Jacksonville, FL | 3.0 | 2.0 | 1279 | $1,750 | $1.37 | 4d | 1 | 1.24mi |
| 9056 Tahoe Ln Jacksonville, FL | 4.0 | 2.0 | 1705 | $1,995 | $1.17 | 7d | 1 | 1.26mi |
| 9086 Tahoe Ln Jacksonville, FL | 3.0 | 2.0 | 1564 | $1,850 | $1.18 | 24d | 1 | 1.27mi |
| 8134 Rocky Creek Dr Jacksonville, FL | 3.0 | 2.0 | 1689 | $1,250 | $0.74 | 14d | 1 | 1.28mi |
| 7820 Collins Ridge Blvd E Jacksonville, FL | 3.0 | 2.0 | 1357 | $1,950 | $1.44 | 20d | 1 | 1.29mi |
| 9099 Tahoe Ln Jacksonville, FL | 3.0 | 2.0 | 1564 | $2,000 | $1.28 | 24d | 1 | 1.30mi |
| 7852 Catskills Ct Jacksonville, FL | 3.0 | 2.0 | 1352 | $2,276 | $1.68 | 3d | 1 | 1.32mi |
| 7840 Old Middleburg Rd S Jacksonville, FL | 3.0 | 2.0 | 1144 | $1,495 | $1.31 | 21d | 1 | 1.35mi |
| 8106 Byrd Landing Ct Jacksonville, FL | 4.0 | 2.5 | 1889 | $2,315 | $1.23 | 4d | 1 | 1.38mi |
| 8528 Echoridge Ct Jacksonville, FL | 4.0 | 2.0 | 1803 | $2,395 | $1.33 | 17d | 1 | 1.42mi |
| 8236 Hot Springs Dr N Jacksonville, FL | 3.0 | 2.0 | 1734 | $1,865 | $1.08 | 7d | 1 | 1.44mi |
| 7940 Collins Bay Ct Jacksonville, FL | 3.0 | 2.0 | 1554 | $2,025 | $1.30 | 20d | 1 | 1.46mi |
| 7811 Invermere Blvd N Jacksonville, FL | 4.0 | 2.0 | 1831 | $1,990 | $1.09 | 20d | 1 | 1.48mi |
| 10104 Bedford Lakes Ct Jacksonville, FL | 3.0 | 2.0 | 2064 | $2,100 | $1.02 | 14d | 1 | 1.50mi |
Listing history 12 events
-
2026-02-25status Pending
-
2026-02-25status Active
-
2026-01-09status Pending
-
2026-01-07historical
-
2025-12-22$61,500 Active
-
2020-11-19historical
-
2020-11-16$85,000 Active
-
2004-11-17soldstatus $100,800
-
2004-11-08historical 258-char remark
Show marketing remark (258 chars)
Perfect Investment Property! Each side has 2 bed 1 bath. New electric, New Central heating and cooling, new vinyl siding, and new plumbing. Lot dimensions are 300 x 105. Storage unit 20 x 30. All appliances Stay! 3/4 Acre fenced in. This home wont last long!
-
2004-11-05soldstatus $100,800 258-char remark
Show marketing remark (258 chars)
Perfect Investment Property! Each side has 2 bed 1 bath. New electric, New Central heating and cooling, new vinyl siding, and new plumbing. Lot dimensions are 300 x 105. Storage unit 20 x 30. All appliances Stay! 3/4 Acre fenced in. This home wont last long!
-
2004-07-16$104,900 258-char remark
Show marketing remark (258 chars)
Perfect Investment Property! Each side has 2 bed 1 bath. New electric, New Central heating and cooling, new vinyl siding, and new plumbing. Lot dimensions are 300 x 105. Storage unit 20 x 30. All appliances Stay! 3/4 Acre fenced in. This home wont last long!
-
1999-12-14soldstatus $30,000
ⓘ Source: listings_history table (triggers on properties + properties_extension) + one-shot
backfill from property_details.listing_events for pre-trigger history.
Climate risk First Street
- Flood 1/10 Low FEMA zone X (unshaded) · 0% chance over 30 yrs
- Wildfire 5/10 Major
- Heat 8/10 Severe 7 d/yr ≥107°F today · 20 d/yr by 30 yrs out
- Wind 10/10 Extreme 99% chance of damaging wind over 30 yrs
- Air quality 3/10 Moderate 3 unhealthy d/yr today · 4 by 30 yrs out
Nearby sold comps map
Loading sold comps map…
Walkable amenities ~0.75 mi
Loading nearby amenities…
Taxation est. · year 1
- Rental income
- $38,916
- − Mortgage interest
- −$3,445
- − Property taxes
- −$922
- − Insurance
- −$308
- − Repairs & maintenance
- −$3,113
- − Management
- −$3,113
- − Depreciation
- −$1,789
- Taxable income
- $26,225
- Est. tax owed @ 24.0%
- −$6,294
- After-tax cash flow
- $19,349/yr
For passive investors: Depreciation is non-cash, so a rental often shows a tax loss while cash-flowing — sheltering income. Rental losses are passive: they offset passive income freely, and up to $25,000/yr can offset ordinary (W-2) income if you actively participate and your MAGI is under $100k (phasing out to $0 by $150k); unused losses carry forward. On sale, claimed depreciation is recaptured at up to 25%, and gains may owe capital-gains tax (a 1031 exchange can defer both). Figures are a year-1 estimate at your 24.0% rate — not tax advice; consult a CPA.
Schools (NCES district)
- District
- Duval
- NCES district ID
- 1200480
- Math proficiency
- 46% ▼ -11.00%
- Reading proficiency
- 45% ▼ -4.00%
- Median HH income
- $48,987
- Composite
- 38.97/100
- National rank
- #4076
- State rank
- #48 of 73 in FL
Livability — Jacksonville
- Score
- 83/100
- State rank
- #50
- US rank
- #911
Category grades
Schools grade is shown separately in the Schools card above.
Census & demographics
- Census place
- Jacksonville, FL
- County
- Duval County · 1,015,274 people
- City population
- 979,034
- Metro
- Jacksonville, FL
- Population (ZIP)
- 18,258
- Household income
- $85,649
- Rent vs Own
- Severe rent burden
- 666.0
Population outlook (Duval County) Hauer SSP2
- Today (2025)
- 1,013,010 people
- By 2030
- 1,059,228 · +4.6%
- By 2040
- 1,141,439 · +12.7%
- By 2050
- 1,205,258 · +19.0%
- By 2075
- 1,324,282 · +30.7%
- By 2100
- 1,319,620 · +30.3%
Race, ethnicity, and origin ACS 2023
- Neighborhood character
- Highly diverse neighborhood (Simpson 0.70)
- Race & ethnicity
- White 39% Black 34% Hispanic / Latino 16% Two or more races 8% Asian 3%
- Hispanic origin (detail)
- Mexican 1% Puerto Rican 6% Cuban 2% Dominican 1%
- Common ancestry
- Italian 2% Iranian 1% Romanian 1%
- Foreign-born
- 13% · Canada, Vietnam
- Languages at home
- 83% English-only · Spanish 12% Tagalog/Filipino 3% Other Asian/Pacific 1%
Political lean MEDSL · Duval
- 2024 margin
- Toss-up / Even · D 48.7% · R 50.1% · Other 1.2%
- 2008→2024 swing
- +0.4pp no change · 2008: -1.9pp · 2024: -1.5pp
- All cycles
- 2024: R+1.5 2020: D+3.8 2016: R+1.5 2012: R+3.6 2008: R+1.9
Not yet ingested
- Civics
- —
Market trends
- HPI YoY
- ▼ -64.56%
- Current HPI
- 257.6466
- Rent YoY
- ▲ 2.62%
- Metro
- Jacksonville, FL
- State GDP YoY
- ▲ 3.28%
- F500 in state
- 36
Industry mix (Fortune 500 HQ in FL)
| Industry | F500 HQs | Revenue |
|---|---|---|
| Industrial Technology | 2 | $29B |
|
||
| Insurance | 2 | $17B |
|
||
| Retail | 1 | $60B |
|
||
| Technology Distribution | 1 | $58B |
|
||
| Homebuilding | 1 | $35B |
|
||
| Technology Manufacturing | 1 | $35B |
|
||
Price history
+105.0% since first listed12 events — show timeline
- 2026-02-25 Pending — realMLS
- 2026-02-25 Relisted — realMLS
- 2026-01-09 Pending — realMLS
- 2026-01-07 Listing Removed — realMLS
- 2025-12-22 Listed $61,500 realMLS
- 2020-11-19 Listing Removed — realMLS
- 2020-11-16 Listed $85,000 realMLS
- 2004-11-17 Sold (Public Records) $100,800 Public Records
- 2004-11-08 Listing Removed — realMLS
- 2004-11-05 Sold (MLS) $100,800 realMLS
- 2004-07-16 Listed $104,900 realMLS
- 1999-12-14 Sold (Public Records) $30,000 Public Records
Property tax history
+6.5%/yrLatest (2025): $3,658 · +17.1% YoY. Source: county tax records.
Cash-flow waterfall
monthlySold comps — $/sqft
last 12 mo · ≤1 miLoading sold comps…