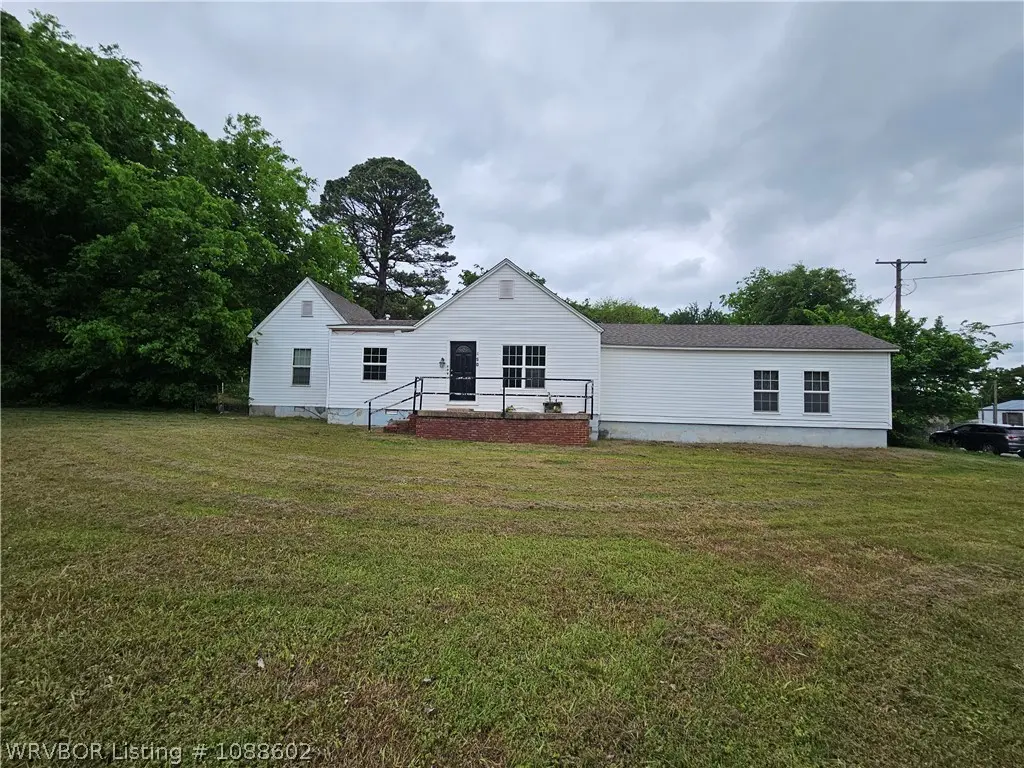
509 Sherwood Ave · Bonanza, AR
Flood risk 1/10 · Minimal
- FEMA flood zone
- X (unshaded)
- Chance of flooding over 30 yrs
- 0.0%
- Est. flood insurance / yr
- $507 – $1,088
Fire risk 7/10 · Major
- Est. fire insurance / yr
- $1,499 – $2,785
Heat risk 7/10 · Major
- Hot days now (above 111°F)
- 7 days/yr
- Hot days in 30 yrs
- 20 days/yr
Wind risk 2/10 · Minimal
- Chance of severe wind over 30 yrs
- 3.0%
Air-quality risk 2/10 · Minimal
- Unhealthy air days now
- 0 days/yr
- Unhealthy air days in 30 yrs
- 1 days/yr
Risk factors via First Street. Map © Google.
Why this score? — see what drove the B- grade
The composite is a weighted blend of 9 inputs, each scored 0–100. Each bar is that input's sub-score; the figure is the points it added to the 100-point composite (weight × sub-score).
- Cash flow +30.0/30.0
- 1% rule +10.0/10.0
- DSCR +10.0/10.0
- ARV discount +7.5/15.0
- Livability +3.3/5.0
- Rent growth +2.9/5.0
- Condition / age +2.5/5.0
- Schools +2.3/10.0
- Appreciation +0.0/10.0
$85,000
🖨 Deal sheet (PDF) 📄 Offer letter ✓ Due diligence
Listing remarks
Built in 1980 this spacious home has a 2 year old roof, newer windows and a huge corner lot. Priced at only $85000 this would make a great home or rental property.
Key facts
- 2 year old roof
- Huge corner lot
- Newer windows
Tags
Property features AI
Exterior
- Parking: Attached garage with 1 covered space
- Utilities: Public water; Public sewer; Electricity available; Natural gas available
- Home design: Single family residence; One-story house; Entry level: one
- Construction: Masonite and vinyl siding; Asphalt shingle roof; Built as a single-story structure
- Exterior features: Porch; Partial backyard fencing; Back yard fencing; Additional outbuilding/storage; Spa details: see remarks; Cleared, level corner city lot; Paved public road access
Interior
- Kitchen: Range; Range hood; Refrigerator; Gas water heater
- Flooring: Ceramic tile; Laminate; Vinyl
- Bathrooms: 1 full bathroom
- Heating & cooling: Natural gas heating; Space heater; Wood stove; Electric cooling; Window cooling units
- Interior features: Built-in features; Ceiling fans; Double pane windows; Other interior features
- Laundry & utility: Washer hookup; Electric dryer hookup
Neighborhood map
What this means for you Summary
Snapshot
- This is a 2-bed/1.0-bath single-family listed at $85k.
Deal economics
- At list price, monthly cash flow is $547 ($7k/yr) — positive.
- The deal already cash-flows at list — no discount required.
- Meets the 1% rule at list price ($1k rent vs $85k).
- Recommended offer: $82k (3.0% below list) — sets the bar for market timing.
Location & tenants
- Location reads 66/100 on livability (#137 in AR) — a middle-class / working-renter tenant base. Strengths: crime A+, cost of living A+, housing A+; Watch: amenities F, commute F, employment D-.
- Hackett School District (rural): math 24% / reading 29% proficiency, ranked #173 of 238 in AR (top 73%) — low school quality limits family demand, transient renter base, plan for 1-2y turnover.
- Zoned schools: Hackett Elementary School (math 24% / reading 16%, grade F, #376 of 454 statewide, top 84%, 493 students, 100% FRL); Hackett High School (math 24% / reading 40%, grade F, #119 of 292 statewide, top 43%, 327 students, 100% FRL) — zoned schools average 100% FRL vs 54% district-wide (46 pts higher); higher-poverty schools than district average — tighter screening recommended.
- Market conditions: Rents rising (+1.6%/yr); 239 active listings in the ZIP; solid renter incomes; 388 units permitted in Sebastian County in 2024 (16 in 5+ unit buildings).
Forward outlook
- Local home prices are declining (-3.0%/yr); year-one equity from $588 of loan paydown is wiped out by about $3k of value loss. Plan a longer hold.
- Sebastian County population projected at +7% by 2050 — modest demand growth; plan on rents tracking national, not racing it.
- At projected returns (-3.0% appreciation + 1.6% rent growth), your $24k cash investment doubles in ~5 years — after that, you're playing with house money.
Negotiation context
- It's been on market 59 days — a 3% lower offer ($82k) is reasonable based on typical stale-listing flexibility.
Risks & watch-outs
- Climate carrying-cost: major wildfire risk; extreme-heat days projected 7→20/yr by 2055 (HVAC capex compounding) — expect insurance premiums to compound above CPI over the hold.
Questions for the listing agent
- It's been on market 59 days. Have you received any prior offers? Is the seller open to a 3% concession, seller financing, or rate buy-down credit?
- Is there a deadline driving the sale (1031 exchange, divorce, estate, relocation)? That informs how much negotiation room exists.
- Schools are F-rated, which usually means shorter tenancies and higher turnover. Who's the typical renter profile here, and what's been the actual vacancy rate?
- What's the average days-on-market for RENTAL listings here right now (not sales)? A rising rental-DOM trend means longer vacancies and softer asking-rent achievability than the comps imply.
- What's the recent tenant-quality profile in this submarket — average credit score on applications, eviction rate, late-payment / NSF rate, and stable-employment percentage? A property-management company in the area should have these aggregated.
- How much new for-sale + rental construction is in the pipeline within 1–3 miles? Heavy new supply typically softens prices + rents 12–24 months out; constrained supply supports both.
Investment metrics
- 1% rule
- 1.69% ✓
- Cap rate
- 14.01%
- Cash-on-cash
- 27.57%
- DSCR
- 2.23
- GRM
- 4.9
CMA / ARV
- ARV (on-the-fly)
- $170,905
- Comps found
- 5
Show comp detail 5 sales within ~0.75 mi
| Address | Dist | Beds/Ba | Sqft | Sold | Price | $/sf | Match |
|---|---|---|---|---|---|---|---|
| 111 Sherwood Ave | 0.26mi | 2/2.0 | 1,274 (-1%) | 6mo | $140,000 | $110 | 77 |
| 107 Sherwood Ave | 0.28mi | 3/1.0 (+1) | 1,140 (-11%) | 0mo | $152,000 | $133 | 63 |
| 606 Mcconnell Ave | 0.06mi | 2/1.0 | 1,120 (-13%) | 18mo | $12,650 | $11 | 61 |
| 501 S Fifth Ave | 0.33mi | 3/1.0 (+1) | 1,428 (+11%) | 6mo | $258,000 | $181 | 56 |
| 1018 Lavender Rd | 0.60mi | 3/2.5 (+1) | 1,378 (+7%) | 1mo | $234,000 | $170 | 48 |
Match score weights: distance 35% · size 25% · config 20% · recency 20%. Top-matched comps best support the ARV.
Projected returns pro-forma
-3.0% appreciation · 1.57% rent growth · sell at horizon
- IRR
- 20.0%
- Equity multiple
- 1.80×
- Total profit
- $19,032
- Equity at exit
- $12,674
- IRR
- 27.3%
- Equity multiple
- 3.24×
- Total profit
- $53,379
- Equity at exit
- $7,349
Cash invested: $23,800 (down + closing). Projections, not guarantees.
Landlord ↔ Tenant lean methodology
- Overall (STATE)
- 92 Strongly Landlord-Friendly
- State Arkansas
- 92 Strongly Landlord-Friendly · R+14
- County
- — inherits STATE
- City
- — inherits STATE
ZIP-level market 72916
- Home prices YoY
- -20.1%
- Rents YoY
- 1.6%
- Active inventory
- 239
- Price-to-rent
- 4.9×
Monthly cashflow live
- Estimated rent
- $1,436 medium interval (Pro) →
- Mortgage (P&I)
- −$446
- Tax est. 1.5%
- −$106 /mo · $1,275/yr
- Insurance
- −$35
- HOA
- −$0
- Vacancy / Maint / Mgmt
- −$301
- Net cashflow
- $547
Break-even live
Sensitivity live
| Price | -10% $605 | -5% $576 | +0% $547 | +5% $517 | +10% $488 |
|---|---|---|---|---|---|
| Rent | -10% $433 | -5% $490 | +0% $547 | +5% $603 | +10% $660 |
| Rate | -1.0pp $590 | -0.5pp $568 | base $547 | +0.5pp $525 | +1.0pp $502 |
UW: 25.0% down · 7.5% · 30yr · 1.5% tax · 5.0% vac · 8.0% maint · 8.0% mgmt
Financing live
Cash to close
- Down payment
- $21,250
- Closing costs
- $2,550
- Reserves months
- —
- Total cash needed
- —
Loan-product check · same deal, 3 products live
Conventional
25% down · 7.5% · 30yr
- Down + closing
- —
- Monthly P&I
- —
- Monthly cashflow
- —
- DSCR
- —
- Eligible?
- —
Personal DTI + credit; lowest rate.
DSCR
20% down · 8.5% · 30yr
- Down + closing
- —
- Monthly P&I
- —
- Monthly cashflow
- —
- DSCR
- —
- Eligible?
- —
No personal income docs; deal must DSCR.
Hard money
10% down · 12.0% · 12mo
- Down + closing
- —
- Monthly P&I
- —
- Monthly cashflow
- —
- DSCR
- —
- Eligible?
- —
Short-term bridge; refi at stabilization.
Listing history 19 events
-
2026-06-22days on market $85,000 Active 59 DOM
-
2026-06-19days on market $85,000 Active 57 DOM
-
2026-06-18days on market $85,000 Active 56 DOM
-
2026-06-17days on market $85,000 Active 55 DOM
-
2026-06-16days on market $85,000 Active 54 DOM
-
2026-06-15days on market $85,000 Active 53 DOM
-
2026-06-14days on market $85,000 Active 51 DOM
-
2026-06-13days on market $85,000 Active 50 DOM
-
2026-06-10days on market $85,000 Active 48 DOM
-
2026-06-09days on market $85,000 Active 47 DOM
-
2026-06-08days on market $85,000 Active 46 DOM
-
2026-06-07days on market $85,000 Active 45 DOM
-
2026-06-05days on market $85,000 Active 42 DOM
-
2026-06-03days on market $85,000 Active 41 DOM
-
2026-06-02days on market $85,000 Active 40 DOM
-
2026-06-01days on market $85,000 Active 39 DOM
-
2026-05-31days on market $85,000 Active 38 DOM
-
2026-05-30days on market $85,000 Active 37 DOM
-
2026-04-23$85,000 Active
ⓘ Source: listings_history table (triggers on properties + properties_extension) + one-shot
backfill from property_details.listing_events for pre-trigger history.
Climate risk First Street
- Flood 1/10 Low FEMA zone X (unshaded) · 0% chance over 30 yrs
- Wildfire 7/10 Severe
- Heat 7/10 Severe 7 d/yr ≥111°F today · 20 d/yr by 30 yrs out
- Wind 2/10 Low 3% chance of damaging wind over 30 yrs
- Air quality 2/10 Low 0 unhealthy d/yr today · 1 by 30 yrs out
Nearby sold comps map
Loading sold comps map…
Walkable amenities ~0.75 mi
Loading nearby amenities…
Taxation est. · year 1
- Rental income
- $17,227
- − Mortgage interest
- −$4,761
- − Property taxes
- −$1,275
- − Insurance
- −$425
- − Repairs & maintenance
- −$1,378
- − Management
- −$1,378
- − Depreciation
- −$2,473
- Taxable income
- $5,537
- Est. tax owed @ 24.0%
- −$1,329
- After-tax cash flow
- $5,232/yr
For passive investors: Depreciation is non-cash, so a rental often shows a tax loss while cash-flowing — sheltering income. Rental losses are passive: they offset passive income freely, and up to $25,000/yr can offset ordinary (W-2) income if you actively participate and your MAGI is under $100k (phasing out to $0 by $150k); unused losses carry forward. On sale, claimed depreciation is recaptured at up to 25%, and gains may owe capital-gains tax (a 1031 exchange can defer both). Figures are a year-1 estimate at your 24.0% rate — not tax advice; consult a CPA.
Schools (NCES district)
- District
- Hackett School District
- NCES district ID
- 0507170
- Math proficiency
- 24% ▼ -16.00%
- Reading proficiency
- 29% ▼ -17.00%
- Median HH income
- $42,751
- Composite
- 22.59/100
- National rank
- #8071
- State rank
- #173 of 238 in AR
Livability — Bonanza
- Score
- 66/100
- State rank
- #137
- US rank
- #12289
Category grades
Schools grade is shown separately in the Schools card above.
Census & demographics
- Census place
- Bonanza, AR
- County
- Sebastian County · 99,312 people
- Metro
- Fort Smith, AR-OK
- Population (ZIP)
- 11,711
- Household income
- $87,983
- Rent vs Own
- Severe rent burden
- 141.0
Population outlook (Sebastian County) Hauer SSP2
- Today (2025)
- 133,992 people
- By 2030
- 136,620 · +2.0%
- By 2040
- 140,832 · +5.1%
- By 2050
- 143,301 · +6.9%
- By 2075
- 147,964 · +10.4%
- By 2100
- 145,848 · +8.8%
Race, ethnicity, and origin ACS 2023
- Neighborhood character
- Predominantly White (75%)
- Race & ethnicity
- White 75% Two or more races 10% Asian 7% Hispanic / Latino 6% Black 4%
- Hispanic origin (detail)
- Mexican 5%
- Common ancestry
- Italian 4% Scandinavian 2% Slovak 2%
- Foreign-born
- 6% · Canada
- Languages at home
- 89% English-only · Spanish 3% Other Asian/Pacific 3% German/W. Germanic 2%
Political lean MEDSL · Sebastian
- 2024 margin
- Solid R (+37.5) · D 30.0% · R 67.6% · Other 2.4%
- 2008→2024 swing
- -2.9pp toward R · 2008: -34.6pp · 2024: -37.5pp
- All cycles
- 2024: R+37.5 2020: R+35.5 2016: R+38.1 2012: R+37.1 2008: R+34.6
Not yet ingested
- Civics
- —
Market trends
- HPI YoY
- ▼ -54.92%
- Current HPI
- 218.0302
- Rent YoY
- ▲ 1.57%
- Metro
- Fort Smith, AR-OK
- State GDP YoY
- ▲ 3.80%
- F500 in state
- 10
Industry mix (Fortune 500 HQ in AR)
| Industry | F500 HQs | Revenue |
|---|---|---|
| Retail | 1 | $681B |
|
||
| Food / Agriculture | 1 | $53B |
|
||
| Retail / Energy | 1 | $22B |
|
||
| Transportation / Logistics | 1 | $12B |
|
||
| Energy | 1 | $4B |
|
||
Price history
1 event — show timeline
- 2026-04-23 Listed $85,000 WRVBOR
Property tax history
-34.0%/yrLatest (2023): $5 · -90.9% YoY. Source: county tax records.
Cash-flow waterfall
monthlySold comps — $/sqft
last 12 mo · ≤1 miLoading sold comps…