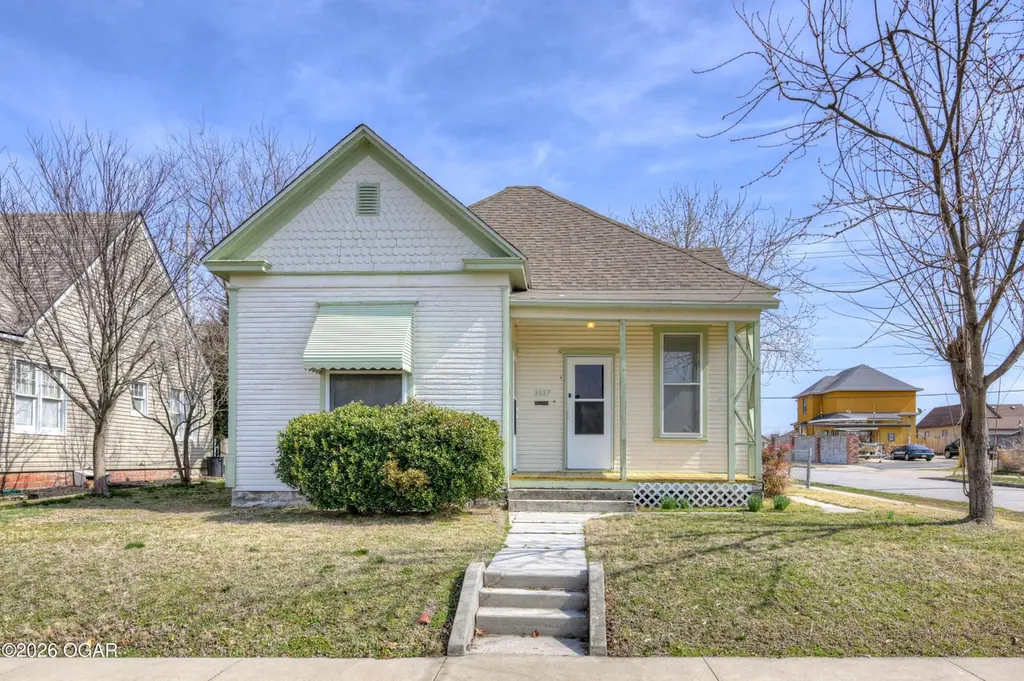
2127 Byers Ave · Joplin, MO
Flood risk 1/10 · Minimal
- FEMA flood zone
- X (unshaded)
- Chance of flooding over 30 yrs
- 0.0%
- Est. flood insurance / yr
- $507 – $1,088
Fire risk 4/10 · Minor
- Est. fire insurance / yr
- $1,054 – $1,958
Heat risk 6/10 · Moderate
- Hot days now (above 107°F)
- 7 days/yr
- Hot days in 30 yrs
- 20 days/yr
Wind risk 2/10 · Minimal
- Chance of severe wind over 30 yrs
- 2.0%
Air-quality risk 2/10 · Minimal
- Unhealthy air days now
- 1 days/yr
- Unhealthy air days in 30 yrs
- 1 days/yr
Risk factors via First Street. Map © Google.
Why this score? — see what drove the C+ grade
The composite is a weighted blend of 9 inputs, each scored 0–100. Each bar is that input's sub-score; the figure is the points it added to the 100-point composite (weight × sub-score).
- Cash flow +26.2/30.0
- DSCR +8.9/10.0
- ARV discount +7.5/15.0
- 1% rule +5.8/10.0
- Rent growth +5.0/5.0
- Livability +3.2/5.0
- Schools +2.9/10.0
- Condition / age +2.5/5.0
- Appreciation +0.0/10.0
$125,000
🖨 Deal sheet 📄 Offer letter ✓ Due diligence
Listing remarks MLS
Affordable and move-in ready 2-bedroom, 1-bath (Jack-and-Jill style) home offers 1,020 square feet of comfortable living space. Newer flooring throughout the living and bedrooms, complemented by fresh interior paint that gives it a clean, updated feel. Eat-In kitchen provides convenience with a gas range and refrigerator and the bathroom features a practical tub/shower combination. You'll also find washer and dryer hookups for added functionality. Outside, enjoy a fully fenced backyard with chain-link fencing and a detached one-car garage, on corner lot. With its thoughtful updates and spacious layout, this home is a great opportunity for first-time buyers, downsizers, or investors.
Key facts
- Remodeled
- Fenced yard
- Good neighborhood
Tags
Neighborhood map
What this means for you Summary
Snapshot
- This is a 3-bed/1.0-bath other listed at $125k.
Deal economics
- At list price, monthly cash flow is $319 ($4k/yr) — positive.
- The deal already cash-flows at list — no discount required.
- Meets the 1% rule at list price ($1k rent vs $125k).
- Cap rate 9.4% vs local median 5.1% in Joplin — top-decile yield for the area; either an underpriced asset or a hidden risk that comps aren't pricing in. Stress-test before assuming the spread holds.
Location & tenants
- Location reads 64/100 on livability (#318 in MO) — a middle-class / working-renter tenant base. Strengths: cost of living A+, housing A+; Watch: schools D+, crime F, amenities F.
- Joplin Schools (urban): math 30% / reading 39% proficiency, ranked #231 of 324 in MO (top 71%) — families likely to look elsewhere, expect single-tenant / working-renter base with shorter leases.
- Market conditions: Rents rising fast (+15.7%/yr); 353 active listings in the ZIP; 15 comparable units currently listed for rent nearby; rentals at typical pace (median 22d on market — plan ~3-4 weeks tenant-placement turnaround); 602 units permitted in Jasper County in 2024 (0 in 5+ unit buildings).
Forward outlook
- Local home prices are declining (-3.0%/yr); year-one equity from $864 of loan paydown is wiped out by about $4k of value loss. Plan a longer hold.
- At projected returns (-3.0% appreciation + 8.0% rent growth), your $35k cash investment doubles in ~8 years — after that, you're playing with house money.
Negotiation context
- Only 7 days on market — expect competitive offers; lowballing is unlikely to land.
- 2 sale attempts with the ask held roughly flat each time — persistent listings suggest the price (not the market) is what's stuck; bring a comps-based counter.
Risks & watch-outs
- Watch-outs: built in 1903 — expect roof / HVAC / electrical / plumbing capex.
- Climate carrying-cost: extreme-heat days projected 7→20/yr by 2055 (HVAC capex compounding) — expect insurance premiums to compound above CPI over the hold.
Questions for the listing agent
- Built in 1903 — when were the roof, HVAC, electrical panel, plumbing, and water heater last replaced?
- Is there a deadline driving the sale (1031 exchange, divorce, estate, relocation)? That informs how much negotiation room exists.
- Schools are D-rated, which usually means shorter tenancies and higher turnover. Who's the typical renter profile here, and what's been the actual vacancy rate?
- Crime grade is F in this area — have there been break-ins, vandalism, or insurance claims at this property in the last 3 years? What carrier currently insures it and at what premium?
- What's the average days-on-market for RENTAL listings here right now (not sales)? A rising rental-DOM trend means longer vacancies and softer asking-rent achievability than the comps imply.
- What's the recent tenant-quality profile in this submarket — average credit score on applications, eviction rate, late-payment / NSF rate, and stable-employment percentage? A property-management company in the area should have these aggregated.
- How much new for-sale + rental construction is in the pipeline within 1–3 miles? Heavy new supply typically softens prices + rents 12–24 months out; constrained supply supports both.
Investment metrics
- 1% rule
- 1.08% ✓
- Cap rate
- 9.35%
- Cash-on-cash
- 10.92%
- DSCR
- 1.49
- GRM
- 7.7
CMA / ARV
No comps found within radius.
Projected returns pro-forma
-3.0% appreciation · 8.0% rent growth · sell at horizon
- IRR
- 5.0%
- Equity multiple
- 1.20×
- Total profit
- $7,086
- Equity at exit
- $18,638
- IRR
- 18.2%
- Equity multiple
- 2.84×
- Total profit
- $64,416
- Equity at exit
- $10,808
Cash invested: $35,000 (down + closing). Projections, not guarantees.
Landlord ↔ Tenant lean methodology
- Overall (STATE)
- 81 Strongly Landlord-Friendly
- State Missouri
- 81 Strongly Landlord-Friendly · R+10
- County
- — inherits STATE
- City
- — inherits STATE
ZIP-level market 64804
- Rents YoY
- 15.7%
- Active inventory
- 353
- Price-to-rent
- 7.7×
Monthly cashflow live
- Estimated rent
- $1,344 high interval (Pro) →
- Mortgage (P&I)
- −$656
- Tax from tax record
- −$36 /mo · $431/yr
- Insurance
- −$52
- HOA
- −$0
- Vacancy / Maint / Mgmt
- −$282
- Net cashflow
- $319
Break-even live
UW: 25.0% down · 7.5% · 30yr · 1.5% tax · 5.0% vac · 8.0% maint · 8.0% mgmt
Financing live
Cash to close
- Down payment
- $31,250
- Closing costs
- $3,750
- Reserves months
- —
- Total cash needed
- —
Loan-product check · same deal, 3 products live
Conventional
25% down · 7.5% · 30yr
- Down + closing
- —
- Monthly P&I
- —
- Monthly cashflow
- —
- DSCR
- —
- Eligible?
- —
Personal DTI + credit; lowest rate.
DSCR
20% down · 8.5% · 30yr
- Down + closing
- —
- Monthly P&I
- —
- Monthly cashflow
- —
- DSCR
- —
- Eligible?
- —
No personal income docs; deal must DSCR.
Hard money
10% down · 12.0% · 12mo
- Down + closing
- —
- Monthly P&I
- —
- Monthly cashflow
- —
- DSCR
- —
- Eligible?
- —
Short-term bridge; refi at stabilization.
Rent comps 15 comps
| Address | Beds | Baths | Sqft | Rent | $/sqft | DOM | Units | Dist |
|---|---|---|---|---|---|---|---|---|
| 2201 S Pearl Ave Joplin, MO | 3.0 | 2.0 | 1487 | $1,475 | $0.99 | 21d | 1 | 0.09mi |
| 2010 S Moffet Ave Joplin, MO | 2.0 | 1.0 | 1000 | $950 | $0.95 | 21d | 1 | 0.16mi |
| 2012 S Connor Ave Joplin, MO | 3.0 | 2.0 | 1379 | $1,595 | $1.16 | 21d | 1 | 0.29mi |
| 2602 S Moffet Ave Joplin, MO | 3.0 | 2.0 | 1214 | $1,300 | $1.07 | 21d | 1 | 0.35mi |
| 1907 S Picher Ave Joplin, MO | 2.0 | 1.0 | 1032 | $900 | $0.87 | 21d | 1 | 0.47mi |
| 1806 Pennsylvania Ave Joplin, MO | 3.0 | 1.0 | 1295 | $1,050 | $0.81 | 21d | 1 | 0.49mi |
| 2830 S Pearl Ave Joplin, MO | 2.0 | 2.0 | 1000 | $1,200 | $1.20 | 21d | 1 | 0.56mi |
| 623 W Junge Blvd Joplin, MO | 3.0 | 2.0 | 1217 | $1,500 | $1.23 | 21d | 1 | 0.72mi |
| 3117 S Wall Ave Joplin, MO | 2.0 | 1.0 | 944 | $1,095 | $1.16 | 21d | 1 | 0.80mi |
| 1715 Wisconsin Ave #2 Joplin, MO | 2.0 | 2.0 | 1000 | $900 | $0.90 | 21d | 1 | 1.02mi |
| 2521 S Tyler Ave Joplin, MO | 3.0 | 2.0 | 1500 | $1,700 | $1.13 | 21d | 1 | 1.03mi |
| 2515 S Willard Ave Joplin, MO | 3.0 | 2.0 | 1500 | $1,600 | $1.07 | 21d | 1 | 1.18mi |
| 2019 W 26th St Joplin, MO | 2.0 | 2.0 | 1000 | $1,100 | $1.10 | 21d | 1 | 1.18mi |
| 524 S Moffet Ave Joplin, MO | 3.0 | 1.0 | 900 | $855 | $0.95 | 21d | 1 | 1.31mi |
| 2002 W 11th St Joplin, MO | 3.0 | 1.0 | 1200 | $1,200 | $1.00 | 21d | 1 | 1.44mi |
Listing history 6 events
-
2026-06-16days on market $125,000 Active 7 DOM
-
2026-06-15days on market $125,000 Active 6 DOM
-
2026-06-14days on market $125,000 Active 4 DOM
-
2026-06-13days on market $125,000 Active 3 DOM
-
2026-06-10remarks 88-char remark
-
2026-06-10$125,000 Active 1 DOM
ⓘ Source: listings_history table (triggers on properties + properties_extension) + one-shot
backfill from property_details.listing_events for pre-trigger history.
Tax reassessment forecast MO · Resets to sale price
- Current annual tax
- $431 · $36/mo
- Projected year-2 tax
- $1,212 · $101/mo
- Expected delta
- +$782/yr (+$65/mo · 181.6%)
ⓘ Screening estimate from a state-policy table — verify with the county assessor before closing.
Climate risk First Street
- Flood 1/10 Low FEMA zone X (unshaded) · 0% chance over 30 yrs
- Wildfire 4/10 Moderate
- Heat 6/10 Major 7 d/yr ≥107°F today · 20 d/yr by 30 yrs out
- Wind 2/10 Low 2% chance of damaging wind over 30 yrs
- Air quality 2/10 Low 1 unhealthy d/yr today · 1 by 30 yrs out
Nearby sold comps map
Loading sold comps map…
Walkable amenities ~0.75 mi
Loading nearby amenities…
Taxation est. · year 1
- Rental income
- $16,132
- − Mortgage interest
- −$7,002
- − Property taxes
- −$431
- − Insurance
- −$625
- − Repairs & maintenance
- −$1,291
- − Management
- −$1,291
- − Depreciation
- −$3,636
- Taxable income
- $1,857
- Est. tax owed @ 24.0%
- −$446
- After-tax cash flow
- $3,377/yr
For passive investors: Depreciation is non-cash, so a rental often shows a tax loss while cash-flowing — sheltering income. Rental losses are passive: they offset passive income freely, and up to $25,000/yr can offset ordinary (W-2) income if you actively participate and your MAGI is under $100k (phasing out to $0 by $150k); unused losses carry forward. On sale, claimed depreciation is recaptured at up to 25%, and gains may owe capital-gains tax (a 1031 exchange can defer both). Figures are a year-1 estimate at your 24.0% rate — not tax advice; consult a CPA.
Schools (NCES district)
- District
- Joplin Schools
- NCES district ID
- 2916350
- Math proficiency
- 30% ▼ -3.00%
- Reading proficiency
- 39% ▼ -3.00%
- Median HH income
- $38,648
- Composite
- 28.82/100
- National rank
- #6657
- State rank
- #231 of 324 in MO
Livability — Joplin
- Score
- 64/100
- State rank
- #318
- US rank
- #14578
Category grades
Schools grade is shown separately in the Schools card above.
Census & demographics
- Census place
- Joplin, MO
- County
- Newton County · 37,016 people
- City population
- 73,303
- Metro
- Joplin, MO
- Population (ZIP)
- 37,016
- Household income
- $62,574
- Rent vs Own
- Severe rent burden
- 1082.0
Population outlook (Jasper County) Hauer SSP2
- Today (2025)
- 120,033 people
- By 2030
- 120,091 · +0.0%
- By 2040
- 119,297 · -0.6%
- By 2050
- 117,705 · -1.9%
- By 2075
- 110,402 · -8.0%
- By 2100
- 99,719 · -16.9%
Race, ethnicity, and origin ACS 2023
- Neighborhood character
- Predominantly White (84%)
- Race & ethnicity
- White 84% Two or more races 9% Hispanic / Latino 6% Black 2% Asian 2%
- Hispanic origin (detail)
- Mexican 3%
- Common ancestry
- Slovak 3% Italian 2% Lithuanian 2%
- Foreign-born
- 3% · Canada, Vietnam
- Languages at home
- 96% English-only · Spanish 1% Other Indo-European 1% Vietnamese 1%
Political lean MEDSL · Jasper
- 2024 margin
- Solid R (+46.8) · D 25.9% · R 72.7% · Other 1.4%
- 2008→2024 swing
- -13.6pp toward R · 2008: -33.2pp · 2024: -46.8pp
- All cycles
- 2024: R+46.8 2020: R+46.2 2016: R+50.8 2012: R+41.0 2008: R+33.2
Not yet ingested
- Civics
- —
Market trends
- HPI YoY
- ▼ -204.80%
- Current HPI
- 279.4471
- Rent YoY
- ▲ 15.66%
- Metro
- Joplin, MO
- State GDP YoY
- ▲ 1.84%
- F500 in state
- 20
Industry mix (Fortune 500 HQ in MO)
| Industry | F500 HQs | Revenue |
|---|---|---|
| Healthcare | 1 | $163B |
|
||
| Insurance | 1 | $21B |
|
||
| Industrial Technology | 1 | $17B |
|
||
| Retail | 1 | $16B |
|
||
| Industrial Distribution | 1 | $10B |
|
||
| Utilities | 1 | $9B |
|
||
Price history
+5.9% since first listed5 events — show timeline
- 2026-06-09 Listed $125,000 FSBO.com
- 2026-04-24 Sold (Public Records) — Public Records
- 2026-04-22 Sold (MLS) — OGAR
- 2026-03-18 Pending — OGAR
- 2026-03-05 Listed $118,000 OGAR
Property tax history
+2.4%/yrLatest (2025): $431 · +11.9% YoY. Source: county tax records.
Cash-flow waterfall
monthlySold comps — $/sqft
last 12 mo · ≤1 miLoading sold comps…