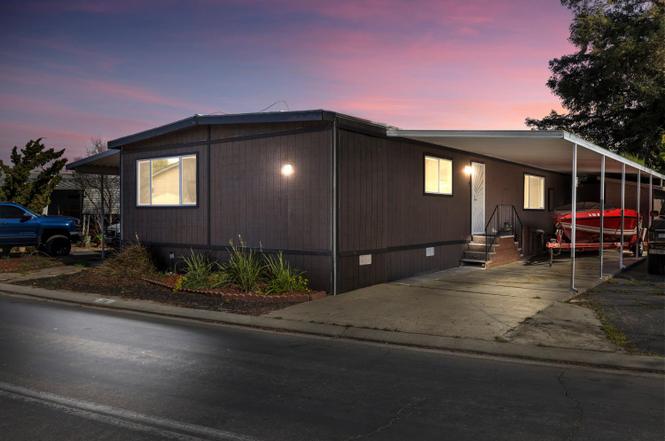
2621 Prescott Rd #79 · Modesto, CA
Flood risk 1/10 · Minimal
- FEMA flood zone
- X (unshaded)
- Chance of flooding over 30 yrs
- 0.0%
- Est. flood insurance / yr
- $507 – $1,088
Fire risk 5/10 · Moderate
- Est. fire insurance / yr
- $659 – $1,223
Heat risk 6/10 · Moderate
- Hot days now (above 102°F)
- 7 days/yr
- Hot days in 30 yrs
- 15 days/yr
Wind risk 1/10 · Minimal
- Chance of severe wind over 30 yrs
- —
Air-quality risk 10/10 · Severe
- Unhealthy air days now
- 28 days/yr
- Unhealthy air days in 30 yrs
- 32 days/yr
Risk factors via First Street. Map © Google.
Why this score? — see what drove the B+ grade
The composite is a weighted blend of 9 inputs, each scored 0–100. Each bar is that input's sub-score; the figure is the points it added to the 100-point composite (weight × sub-score).
- Cash flow +30.0/30.0
- ARV discount +15.0/15.0
- 1% rule +10.0/10.0
- DSCR +10.0/10.0
- Livability +3.2/5.0
- Rent growth +3.1/5.0
- Schools +2.6/10.0
- Condition / age +2.5/5.0
- Appreciation +0.0/10.0
$89,000
🖨 Deal sheet (PDF) 📄 Offer letter ✓ Due diligence
Listing remarks
Welcome to 2621 Prescott Rd #79 in Modesto-a beautifully remodeled home in a sought-after 55+ community offering space, style, and a rare sense of privacy. This 3-bedroom, 2-bath home offers 1,536 square feet of updated living space with modern finishes throughout. The open-concept design features a spacious kitchen with custom wood countertops, updated cabinetry, and great flow into the main living and dining areas perfect for everyday living or entertaining. The primary suite is generously sized, with two additional bedrooms ideal for guests or a home office. A standout feature is the expansive open grass area directly behind the home. While community property, it's rarely used and provid
Key facts
- Clubhouse
- Updated cabinetry
- Remodeled home
Tags
Property features AI
Finance
- Financial info: Land lease: yes; amount $810
- HOA & community: No association; Senior community
Exterior
- Parking: Covered parking; 3 total parking spaces
- Utilities: Public water; Public sewer; 220 volts available in laundry
- Home design: Manufactured in park (double wide); Built in 1972; Updated/remodeled
- Construction: Metal skirting; Other roof
- Exterior features: Backyard; See remarks for additional lot details; Storage shed(s)
Interior
- Kitchen: Island; Wood counters; Free standing refrigerator; Gas cook top; Dishwasher; Disposal
- Bedrooms: 3 bedrooms
- Flooring: Laminate
- Bathrooms: 2 full bathrooms; Tub with shower over; Shower stall(s)
- Heating & cooling: Central heating; Central cooling; Ceiling fan(s)
- Interior features: Cathedral/vaulted living room ceiling; Dual pane full windows; Updated/remodeled condition; Storage area
- Laundry & utility: Laundry hookups in kitchen/inside area/inside room; 220V in laundry; Gas water heater
Neighborhood map
What this means for you Summary
Snapshot
- This is a 3-bed/2.0-bath manufactured listed at $89k.
Deal economics
- At list price, monthly cash flow is $1k ($15k/yr) — positive.
- The deal already cash-flows at list — no discount required.
- Meets the 1% rule at list price ($2k rent vs $89k).
- Recommended offer: $81k (9.0% below list) — sets the bar for market timing.
- Cap rate 23.2% vs local median 3.2% in Modesto — top-decile yield for the area; either an underpriced asset or a hidden risk that comps aren't pricing in. Stress-test before assuming the spread holds.
Location & tenants
- Location reads 63/100 on livability (#451 in CA) — a middle-class / working-renter tenant base. Strengths: housing A+; Watch: amenities C-, schools D+, health & safety D+.
- Stanislaus Union Elementary (urban): math 24% / reading 35% proficiency, ranked #344 of 517 in CA (top 66%) — low school quality limits family demand, transient renter base, plan for 1-2y turnover.
- Market conditions: Rents rising (+2.2%/yr); 161 active listings in the ZIP; 17 comparable units currently listed for rent nearby; rentals at typical pace (median 14d on market — plan ~3-4 weeks tenant-placement turnaround); solid renter incomes; 923 units permitted in Stanislaus County in 2024 (63 in 5+ unit buildings).
- This rent runs 38% of the median local income ($76k/yr) — at the standard rent-burdened threshold; future hikes will face affordability resistance.
Forward outlook
- Local home prices are declining (-3.0%/yr); year-one equity from $615 of loan paydown is wiped out by about $3k of value loss. Plan a longer hold.
- Stanislaus County population projected at +14% by 2050 — modest demand growth; plan on rents tracking national, not racing it.
- At projected returns (-3.0% appreciation + 2.2% rent growth), your $25k cash investment doubles in ~2 years — after that, you're playing with house money.
Negotiation context
- It's been on market 105 days — a 9% lower offer ($81k) is reasonable based on typical stale-listing flexibility.
Risks & watch-outs
- Climate carrying-cost: moderate wildfire risk; extreme-heat days projected 7→15/yr by 2055 (HVAC capex compounding) — expect insurance premiums to compound above CPI over the hold.
Questions for the listing agent
- It's been on market 105 days. Have you received any prior offers? Is the seller open to a 9% concession, seller financing, or rate buy-down credit?
- Built in 1972 — when were the roof, HVAC, electrical panel, plumbing, and water heater last replaced?
- Why hasn't it sold? Are there any deal-killer items the seller is aware of (foundation, flood, title, zoning, code violations)?
- Is there a deadline driving the sale (1031 exchange, divorce, estate, relocation)? That informs how much negotiation room exists.
- Schools are D-rated, which usually means shorter tenancies and higher turnover. Who's the typical renter profile here, and what's been the actual vacancy rate?
- Crime grade is F in this area — have there been break-ins, vandalism, or insurance claims at this property in the last 3 years? What carrier currently insures it and at what premium?
- What's the average days-on-market for RENTAL listings here right now (not sales)? A rising rental-DOM trend means longer vacancies and softer asking-rent achievability than the comps imply.
- What's the recent tenant-quality profile in this submarket — average credit score on applications, eviction rate, late-payment / NSF rate, and stable-employment percentage? A property-management company in the area should have these aggregated.
- How much new for-sale + rental construction is in the pipeline within 1–3 miles? Heavy new supply typically softens prices + rents 12–24 months out; constrained supply supports both.
Investment metrics
- 1% rule
- 2.66% ✓
- Cap rate
- 23.24%
- Cash-on-cash
- 60.54%
- DSCR
- 3.69
- GRM
- 3.1
CMA / ARV
- ARV (on-the-fly)
- $127,488
- Comps found
- 12
Show comp detail 12 sales within ~0.75 mi
| Address | Dist | Beds/Ba | Sqft | Sold | Price | $/sf | Match |
|---|---|---|---|---|---|---|---|
| 2621 Prescott Rd #53 | 0.07mi | 3/2.0 | 1,530 (-0%) | 4mo | $105,000 | $69 | 93 |
| 2621 Prescott Rd #17 | 0.07mi | 3/2.0 | 1,573 (+2%) | 2mo | $118,000 | $75 | 91 |
| 2621 Prescott Rd #87 | 0.09mi | 3/2.0 | 1,512 (-2%) | 5mo | $130,000 | $86 | 89 |
| 2621 Prescott Rd #151 | 0.09mi | 2/2.0 (-1) | 1,512 (-2%) | 2mo | $125,000 | $83 | 86 |
| 2621 Prescott Road Space 224 #224 | 0.00mi | 2/2.0 (-1) | 1,440 (-6%) | 3mo | $122,300 | $85 | 82 |
| 2621 Prescott Rd Unit 249a | 0.00mi | 2/2.0 (-1) | 1,440 (-6%) | 6mo | $100,000 | $69 | 80 |
| 2621 Prescott #189 | 0.00mi | 2/2.0 (-1) | 1,740 (+13%) | 2mo | $65,000 | $37 | 71 |
| 2113 Barrington Ln | 0.41mi | 3/2.0 | 1,620 (+6%) | 1mo | $300,000 | $185 | 70 |
| 2124 Key West Ln | 0.43mi | 3/2.0 | 1,620 (+6%) | 1mo | $337,000 | $208 | 70 |
| 2621 Prescott Rd #106 | 0.09mi | 2/2.0 (-1) | 1,344 (-12%) | 1mo | $71,500 | $53 | 69 |
| 2621 Prescott Rd #262 | 0.13mi | 2/2.0 (-1) | 1,344 (-12%) | 2mo | $69,000 | $51 | 67 |
| 2129 Viking Ln | 0.38mi | 2/2.0 (-1) | 1,344 (-12%) | 2mo | $205,000 | $153 | 55 |
Match score weights: distance 35% · size 25% · config 20% · recency 20%. Top-matched comps best support the ARV.
Projected returns pro-forma
-3.0% appreciation · 2.25% rent growth · sell at horizon
- IRR
- 58.5%
- Equity multiple
- 3.56×
- Total profit
- $63,910
- Equity at exit
- $13,270
- IRR
- 63.0%
- Equity multiple
- 7.09×
- Total profit
- $151,725
- Equity at exit
- $7,695
Cash invested: $24,920 (down + closing). Projections, not guarantees.
Landlord ↔ Tenant lean methodology
- Overall (STATE)
- 18 Strongly Tenant-Friendly
- State California
- 18 Strongly Tenant-Friendly · D+13
- County
- — inherits STATE
- City
- — inherits STATE
ZIP-level market 95350
- Rents YoY
- 2.2%
- Active inventory
- 161
- Price-to-rent
- 3.1×
Monthly cashflow live
- Estimated rent
- $2,370 high interval (Pro) →
- Mortgage (P&I)
- −$467
- Tax est. 1.5%
- −$111 /mo · $1,335/yr
- Insurance
- −$37
- HOA
- −$0
- Vacancy / Maint / Mgmt
- −$498
- Net cashflow
- $1,257
Break-even live
Sensitivity live
| Price | -10% $1,319 | -5% $1,288 | +0% $1,257 | +5% $1,226 | +10% $1,196 |
|---|---|---|---|---|---|
| Rent | -10% $1,070 | -5% $1,164 | +0% $1,257 | +5% $1,351 | +10% $1,444 |
| Rate | -1.0pp $1,302 | -0.5pp $1,280 | base $1,257 | +0.5pp $1,234 | +1.0pp $1,211 |
UW: 25.0% down · 7.5% · 30yr · 1.5% tax · 5.0% vac · 8.0% maint · 8.0% mgmt
Financing live
Cash to close
- Down payment
- $22,250
- Closing costs
- $2,670
- Reserves months
- —
- Total cash needed
- —
Loan-product check · same deal, 3 products live
Conventional
25% down · 7.5% · 30yr
- Down + closing
- —
- Monthly P&I
- —
- Monthly cashflow
- —
- DSCR
- —
- Eligible?
- —
Personal DTI + credit; lowest rate.
DSCR
20% down · 8.5% · 30yr
- Down + closing
- —
- Monthly P&I
- —
- Monthly cashflow
- —
- DSCR
- —
- Eligible?
- —
No personal income docs; deal must DSCR.
Hard money
10% down · 12.0% · 12mo
- Down + closing
- —
- Monthly P&I
- —
- Monthly cashflow
- —
- DSCR
- —
- Eligible?
- —
Short-term bridge; refi at stabilization.
Rent comps 17 comps
| Address | Beds | Baths | Sqft | Rent | $/sqft | DOM | Units | Dist |
|---|---|---|---|---|---|---|---|---|
| 2112 Eicher Ave Modesto, CA | 2.0 | 1.0 | 1100 | $1,995 | $1.81 | 14d | 1 | 0.24mi |
| 1712 Applegate Dr Modesto, CA | 3.0 | 2.0 | 1120 | $2,595 | $2.32 | 14d | 1 | 0.48mi |
| 2404 Strivens Ave Modesto, CA | 3.0 | 1.0 | 1200 | $2,498 | $2.08 | 14d | 1 | 0.68mi |
| 2821 Lou Ann Dr Modesto, CA | 2.0 | 1.5–2.0 | 1035 | $2,150 | $2.08 | 11d | 3 | 0.80mi |
| 3500 Shawnee Dr Modesto, CA | 2.0 | 2.0 | 1100 | $2,100 | $1.91 | 14d | 1 | 0.80mi |
| 1809 La Corunna Pl Modesto, CA | 2.0 | 3.0 | 1300 | $2,100 | $1.62 | 14d | 1 | 0.85mi |
| 3200 Hahn Dr Modesto, CA | 2.0–3.0 | 2.0–2.5 | 1262 | $2,631 | $2.08 | 3d | 5 | 0.88mi |
| 2213 Camborne Dr Unit 1 Modesto, CA | 2.0 | 2.0 | 1220 | $2,395 | $1.96 | 24d | 1 | 0.92mi |
| 1701 Linwood Dr Modesto, CA | 3.0 | 2.0 | 1499 | $2,050 | $1.37 | 14d | 1 | 1.08mi |
| 3904 Breda Ct Modesto, CA | 3.0 | 2.0 | 1680 | $2,400 | $1.43 | 21d | 1 | 1.18mi |
| 3830 Carver Rd Modesto, CA | 4.0 | 3.0 | 2077 | $2,950 | $1.42 | 24d | 1 | 1.19mi |
| 1836 Brahms Way Modesto, CA | 4.0 | 2.0 | 1640 | $2,645 | $1.61 | 24d | 1 | 1.33mi |
| 1836 Brahms Way Modesto, CA | 4.0 | 2.0 | 1640 | $2,645 | $1.61 | 14d | 1 | 1.33mi |
| 2704 Snyder Ave Modesto, CA | 3.0 | 2.0 | 1806 | $2,495 | $1.38 | 11d | 1 | 1.38mi |
| 3445 Colonial Dr Modesto, CA | 1.0–2.0 | 1.0 | 918 | $2,295 | $2.50 | 14d | 10 | 1.40mi |
| 3820 Gareth Ln Apt C Modesto, CA | 2.0 | 2.0 | 1100 | $1,895 | $1.72 | 14d | 1 | 1.45mi |
| 3620 Historic Ct Modesto, CA | 3.0 | 2.0 | 1569 | $2,800 | $1.78 | 11d | 1 | 1.50mi |
Listing history 15 events
-
2026-06-18days on market $89,000 Active 105 DOM
-
2026-06-17days on market $89,000 Active 104 DOM
-
2026-06-16days on market $89,000 Active 103 DOM
-
2026-06-15days on market $89,000 Active 102 DOM
-
2026-06-14days on market $89,000 Active 100 DOM
-
2026-06-13days on market $89,000 Active 99 DOM
-
2026-06-10days on market $89,000 Active 97 DOM
-
2026-06-09days on market $89,000 Active 96 DOM
-
2026-06-08days on market $89,000 Active 95 DOM
-
2026-06-07days on market $89,000 Active 94 DOM
-
2026-06-03days on market $89,000 Active 90 DOM
-
2026-06-02days on market $89,000 Active 89 DOM
-
2026-06-01days on market $89,000 Active 88 DOM
-
2026-05-31days on market $89,000 Active 87 DOM
-
2026-05-30pricedays on market $89,000 Active 86 DOM
ⓘ Source: listings_history table (triggers on properties + properties_extension) + one-shot
backfill from property_details.listing_events for pre-trigger history.
Climate risk First Street
- Flood 1/10 Low FEMA zone X (unshaded) · 0% chance over 30 yrs
- Wildfire 5/10 Major
- Heat 6/10 Major 7 d/yr ≥102°F today · 15 d/yr by 30 yrs out
- Wind 1/10 Low
- Air quality 10/10 Extreme 28 unhealthy d/yr today · 32 by 30 yrs out
Nearby sold comps map
Loading sold comps map…
Walkable amenities ~0.75 mi
Loading nearby amenities…
Taxation est. · year 1
- Rental income
- $28,439
- − Mortgage interest
- −$4,985
- − Property taxes
- −$1,335
- − Insurance
- −$445
- − Repairs & maintenance
- −$2,275
- − Management
- −$2,275
- − Depreciation
- −$2,589
- Taxable income
- $14,534
- Est. tax owed @ 24.0%
- −$3,488
- After-tax cash flow
- $11,598/yr
For passive investors: Depreciation is non-cash, so a rental often shows a tax loss while cash-flowing — sheltering income. Rental losses are passive: they offset passive income freely, and up to $25,000/yr can offset ordinary (W-2) income if you actively participate and your MAGI is under $100k (phasing out to $0 by $150k); unused losses carry forward. On sale, claimed depreciation is recaptured at up to 25%, and gains may owe capital-gains tax (a 1031 exchange can defer both). Figures are a year-1 estimate at your 24.0% rate — not tax advice; consult a CPA.
Schools (NCES district)
- District
- Stanislaus Union Elementary
- NCES district ID
- 0637950
- Math proficiency
- 24% ▼ -14.00%
- Reading proficiency
- 35% ▼ -12.00%
- Median HH income
- $53,731
- Composite
- 26.11/100
- National rank
- #7286
- State rank
- #344 of 517 in CA
Livability — Modesto
- Score
- 63/100
- State rank
- #451
- US rank
- #15229
Category grades
Schools grade is shown separately in the Schools card above.
Census & demographics
- Census place
- Modesto, CA
- County
- Stanislaus County · 445,786 people
- City population
- 225,261
- Metro
- Modesto, CA
- Population (ZIP)
- 57,136
- Household income
- $75,621
- Rent vs Own
- Severe rent burden
- 2163.0
Population outlook (Stanislaus County) Hauer SSP2
- Today (2025)
- 579,493 people
- By 2030
- 598,000 · +3.2%
- By 2040
- 630,930 · +8.9%
- By 2050
- 658,300 · +13.6%
- By 2075
- 712,363 · +22.9%
- By 2100
- 719,805 · +24.2%
Race, ethnicity, and origin ACS 2023
- Neighborhood character
- Diverse neighborhood (Simpson 0.64)
- Race & ethnicity
- White 45% Hispanic / Latino 39% Two or more races 19% Asian 6% Black 5% Native American 2%
- Hispanic origin (detail)
- Mexican 35%
- Common ancestry
- Russian 3% Slovak 2% Portuguese 1%
- Foreign-born
- 14% · Canada, Vietnam
- Languages at home
- 70% English-only · Spanish 23% Other Indo-European 3% Other Asian/Pacific 1%
Political lean MEDSL · Stanislaus
- 2024 margin
- R (+11.0) · D 43.2% · R 54.2% · Other 2.6%
- 2008→2024 swing
- -12.7pp toward R · 2008: 1.7pp · 2024: -11.0pp
- All cycles
- 2024: R+11.0 2020: D+0.8 2016: D+0.6 2012: D+0.7 2008: D+1.7
Not yet ingested
- Civics
- —
Market trends
- HPI YoY
- ▼ -555.05%
- Current HPI
- 307.9532
- Rent YoY
- ▲ 2.25%
- Metro
- Modesto, CA
- State GDP YoY
- ▲ 3.21%
- F500 in state
- 116
Industry mix (Fortune 500 HQ in CA)
| Industry | F500 HQs | Revenue |
|---|---|---|
| Technology | 27 | $1,492B |
|
||
| Financial Services | 3 | $174B |
|
||
| Retail | 3 | $44B |
|
||
| Insurance | 3 | $26B |
|
||
| Media / Entertainment | 2 | $115B |
|
||
| Pharmaceuticals / Biotech | 2 | $62B |
|
||
Cash-flow waterfall
monthlySold comps — $/sqft
last 12 mo · ≤1 miLoading sold comps…