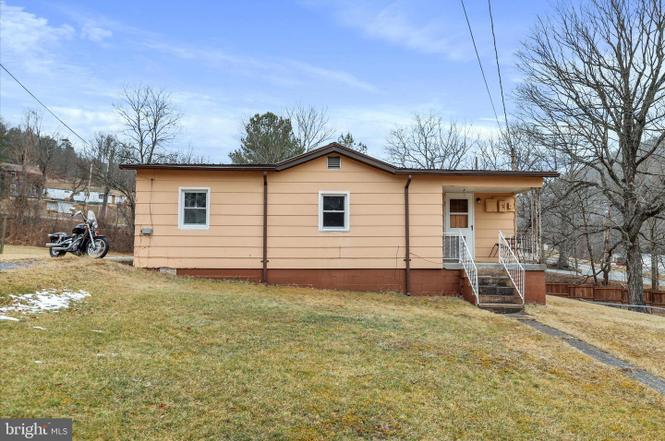
48 Wayland Dr · Keyser, WV
Flood risk 5/10 · Moderate
- FEMA flood zone
- X (unshaded)
- Chance of flooding over 30 yrs
- 0.65%
- Est. flood insurance / yr
- $507 – $1,088
Fire risk 4/10 · Minor
- Est. fire insurance / yr
- $787 – $1,461
Heat risk 4/10 · Minor
- Hot days now (above 98°F)
- 7 days/yr
- Hot days in 30 yrs
- 18 days/yr
Wind risk 2/10 · Minimal
- Chance of severe wind over 30 yrs
- —
Air-quality risk 1/10 · Minimal
- Unhealthy air days now
- 0 days/yr
- Unhealthy air days in 30 yrs
- 0 days/yr
Risk factors via First Street. Map © Google.
Why this score? — see what drove the C grade
The composite is a weighted blend of 9 inputs, each scored 0–100. Each bar is that input's sub-score; the figure is the points it added to the 100-point composite (weight × sub-score).
- Cash flow +20.7/30.0
- ARV discount +7.5/15.0
- Appreciation +6.7/10.0
- DSCR +6.6/10.0
- 1% rule +5.5/10.0
- Livability +3.4/5.0
- Rent growth +2.5/5.0
- Schools +2.5/10.0
- Condition / age +2.5/5.0
$80,000
🖨 Deal sheet 📄 Offer letter ✓ Due diligence
Listing remarks
Simple. Solid. Affordable. A smart place to start. This 726± sq ft, 2-bedroom, 1-bath home sits on a level 0.59-acre lot and offers exactly what many buyers are looking for today: simplicity, efficiency, and opportunity. The home itself is straightforward and functional—easy to maintain, economical to own, and well-suited for someone ready to step out on their own and establish independence. The layout makes good use of the space, with two bedrooms, a full bath, and comfortable living areas that are practical and livable. What truly sets this property apart is the lot. The nearly 0.6-acre parcel is level, open, and highly usable, offering ample room for future expansion, a deta
Key facts
- Close to schools
- Usable lot
- Level lot
Tags
Property features AI
Finance
- Other: Pets allowed with no pet restrictions
- Financial info:
- HOA & community:
Exterior
- Parking: Gravel driveway; Driveway parking with 3 spaces (3 driveway/garage and parking spaces total)
- Security:
- Utilities: Public water; Public sewer; No municipal trash service
- Home design: Detached structure; Metal roof; Crawl space foundation; Building not winterized; Fee simple ownership
- Construction: Frame construction; Year built (per assessor)
- Exterior features: Private, premium, level lot; Not in development; Rural location outside city limits; Gravel road surface with private road responsibility
Interior
- Kitchen:
- Bedrooms: 2 bedrooms on the main level
- Flooring: Carpet; Vinyl
- Bathrooms: 1 full bathroom on the main level
- Heating & cooling: Electric baseboard heating; Electric hot water
- Interior features: Paneled walls
- Laundry & utility: Laundry on the main floor
Neighborhood map
What this means for you Summary
Snapshot
- This is a 2-bed/1.0-bath single-family listed at $80k.
Deal economics
- At list price, monthly cash flow is $109 ($1k/yr) — positive.
- The deal already cash-flows at list — no discount required.
- Meets the 1% rule at list price ($838 rent vs $80k).
- Recommended offer: $70k (12.0% below list) — sets the bar for market timing.
- Cap rate 7.9% vs local median 4.0% in Keyser — top-decile yield for the area; either an underpriced asset or a hidden risk that comps aren't pricing in. Stress-test before assuming the spread holds.
Location & tenants
- Location reads 67/100 on livability (#93 in WV) — a middle-class / working-renter tenant base. Strengths: cost of living A+, housing A+, crime B; Watch: employment D+, amenities F, commute F.
- Mineral County Schools (rural): math 26% / reading 34% proficiency, ranked #32 of 55 in WV (top 58%) — families likely to look elsewhere, expect single-tenant / working-renter base with shorter leases.
- Zoned schools: Keyser Primary School (math 22% / reading 22%, grade F, #324 of 377 statewide, top 89%, 562 students, 0% FRL); Keyser Middle School (math 18% / reading 31%, grade F, #84 of 109 statewide, top 81%, 719 students, 0% FRL); Keyser High School (math 27% / reading 42%, grade F, #42 of 110 statewide, top 47%, 671 students, 0% FRL) — zoned schools average 0% FRL vs 41% district-wide (41 pts lower); this property's tenant base skews higher-income than the district average.
- Market conditions: 49 active listings in the ZIP; 64 units permitted in Mineral County in 2024 (0 in 5+ unit buildings).
Forward outlook
- In year one you build about $3k of equity ($553 loan paydown + $3k appreciation (3.4% local appreciation)).
- Mineral County population projected at -26% by 2050 — secular population decline; favor cash flow + early exit over multi-decade hold.
- At projected returns (3.4% appreciation + 3.0% rent growth), your $22k cash investment doubles in ~5 years — after that, you're playing with house money.
- By year 10, paydown + projected appreciation supports a ~$31k cash-out refi (75% LTV) — recoverable capital for the next deal without selling this one.
Negotiation context
- It's been on market 126 days — a 12% lower offer ($70k) is reasonable based on typical stale-listing flexibility.
Risks & watch-outs
- Watch-outs: built in 1955 — expect roof / HVAC / electrical / plumbing capex.
- Climate carrying-cost: moderate flood risk — expect insurance premiums to compound above CPI over the hold.
Questions for the listing agent
- It's been on market 126 days. Have you received any prior offers? Is the seller open to a 12% concession, seller financing, or rate buy-down credit?
- Built in 1955 — when were the roof, HVAC, electrical panel, plumbing, and water heater last replaced?
- Why hasn't it sold? Are there any deal-killer items the seller is aware of (foundation, flood, title, zoning, code violations)?
- Is there a deadline driving the sale (1031 exchange, divorce, estate, relocation)? That informs how much negotiation room exists.
- Schools are D-rated, which usually means shorter tenancies and higher turnover. Who's the typical renter profile here, and what's been the actual vacancy rate?
- What's the average days-on-market for RENTAL listings here right now (not sales)? A rising rental-DOM trend means longer vacancies and softer asking-rent achievability than the comps imply.
- What's the recent tenant-quality profile in this submarket — average credit score on applications, eviction rate, late-payment / NSF rate, and stable-employment percentage? A property-management company in the area should have these aggregated.
- How much new for-sale + rental construction is in the pipeline within 1–3 miles? Heavy new supply typically softens prices + rents 12–24 months out; constrained supply supports both.
Investment metrics
- 1% rule
- 1.05% ✓
- Cap rate
- 7.93%
- Cash-on-cash
- 5.84%
- DSCR
- 1.26
- GRM
- 8.0
CMA / ARV
No comps found within radius.
Projected returns pro-forma
3.36% appreciation · 3.0% rent growth · sell at horizon
- IRR
- 13.9%
- Equity multiple
- 1.81×
- Total profit
- $18,145
- Equity at exit
- $37,623
- IRR
- 15.5%
- Equity multiple
- 3.37×
- Total profit
- $52,999
- Equity at exit
- $59,299
Cash invested: $22,400 (down + closing). Projections, not guarantees.
Landlord ↔ Tenant lean methodology
- Overall (STATE)
- 83 Strongly Landlord-Friendly
- State West Virginia
- 83 Strongly Landlord-Friendly · R+22
- County
- — inherits STATE
- City
- — inherits STATE
ZIP-level market 26726
- Home prices YoY
- 1.6%
- Active inventory
- 49
- Price-to-rent
- 8.0×
Monthly cashflow live
- Estimated rent
- $838 medium interval (Pro) →
- Mortgage (P&I)
- −$420
- Tax est. 1.5%
- −$100 /mo · $1,200/yr
- Insurance
- −$33
- HOA
- −$0
- Vacancy / Maint / Mgmt
- −$176
- Net cashflow
- $109
Break-even live
UW: 25.0% down · 7.5% · 30yr · 1.5% tax · 5.0% vac · 8.0% maint · 8.0% mgmt
Financing live
Cash to close
- Down payment
- $20,000
- Closing costs
- $2,400
- Reserves months
- —
- Total cash needed
- —
Loan-product check · same deal, 3 products live
Conventional
25% down · 7.5% · 30yr
- Down + closing
- —
- Monthly P&I
- —
- Monthly cashflow
- —
- DSCR
- —
- Eligible?
- —
Personal DTI + credit; lowest rate.
DSCR
20% down · 8.5% · 30yr
- Down + closing
- —
- Monthly P&I
- —
- Monthly cashflow
- —
- DSCR
- —
- Eligible?
- —
No personal income docs; deal must DSCR.
Hard money
10% down · 12.0% · 12mo
- Down + closing
- —
- Monthly P&I
- —
- Monthly cashflow
- —
- DSCR
- —
- Eligible?
- —
Short-term bridge; refi at stabilization.
Listing history 3 events
-
2026-05-18price $80,000
-
2026-03-23price $89,900
-
2026-01-22$94,900 Active
ⓘ Source: listings_history table (triggers on properties + properties_extension) + one-shot
backfill from property_details.listing_events for pre-trigger history.
Climate risk First Street
- Flood 5/10 Major FEMA zone X (unshaded) · 65% chance over 30 yrs
- Wildfire 4/10 Moderate
- Heat 4/10 Moderate 7 d/yr ≥98°F today · 18 d/yr by 30 yrs out
- Wind 2/10 Low
- Air quality 1/10 Low 0 unhealthy d/yr today · 0 by 30 yrs out
Nearby sold comps map
Loading sold comps map…
Walkable amenities ~0.75 mi
Loading nearby amenities…
Taxation est. · year 1
- Rental income
- $10,054
- − Mortgage interest
- −$4,481
- − Property taxes
- −$1,200
- − Insurance
- −$400
- − Repairs & maintenance
- −$804
- − Management
- −$804
- − Depreciation
- −$2,327
- Taxable income
- $37
- Est. tax owed @ 24.0%
- −$9
- After-tax cash flow
- $1,299/yr
For passive investors: Depreciation is non-cash, so a rental often shows a tax loss while cash-flowing — sheltering income. Rental losses are passive: they offset passive income freely, and up to $25,000/yr can offset ordinary (W-2) income if you actively participate and your MAGI is under $100k (phasing out to $0 by $150k); unused losses carry forward. On sale, claimed depreciation is recaptured at up to 25%, and gains may owe capital-gains tax (a 1031 exchange can defer both). Figures are a year-1 estimate at your 24.0% rate — not tax advice; consult a CPA.
Schools (NCES district)
- District
- Mineral County Schools
- NCES district ID
- 5400870
- Math proficiency
- 26% ▼ -12.00%
- Reading proficiency
- 34% ▼ -7.00%
- Median HH income
- $36,161
- Composite
- 24.85/100
- National rank
- #7590
- State rank
- #32 of 55 in WV
Livability — Keyser
- Score
- 67/100
- State rank
- #93
- US rank
- #10850
Category grades
Schools grade is shown separately in the Schools card above.
Census & demographics
- Population (ZIP)
- 12,619
Population outlook (Mineral County) Hauer SSP2
- Today (2025)
- 25,357 people
- By 2030
- 24,009 · -5.3%
- By 2040
- 21,321 · -15.9%
- By 2050
- 18,801 · -25.9%
- By 2075
- 13,934 · -45.0%
- By 2100
- 10,141 · -60.0%
Race, ethnicity, and origin ACS 2023
- Neighborhood character
- Predominantly White (91%)
- Race & ethnicity
- White 91% Two or more races 5% Black 2%
- Common ancestry
- Slovak 4% Lithuanian 1% Romanian 1%
- Foreign-born
- 0% · Canada
Political lean MEDSL · Mineral
- 2024 margin
- Solid R (+60.2) · D 19.2% · R 79.4% · Other 1.4%
- 2008→2024 swing
- -26.7pp toward R · 2008: -33.5pp · 2024: -60.2pp
- All cycles
- 2024: R+60.2 2020: R+57.3 2016: R+60.8 2012: R+45.0 2008: R+33.5
Not yet ingested
- Civics
- —
Market trends
- HPI YoY
- ▲ 3.36%
- Current HPI
- 212.7657
- Rent YoY
- —
- Metro
- —
- State GDP YoY
- —
- F500 in state
- 0
Price history
-15.7% since first listed3 events — show timeline
- 2026-05-18 Price Changed $80,000 BRIGHT MLS
- 2026-03-23 Price Changed $89,900 BRIGHT MLS
- 2026-01-22 Listed $94,900 BRIGHT MLS
Cash-flow waterfall
monthlySold comps — $/sqft
last 12 mo · ≤1 miLoading sold comps…