 🏷️ Likely Rental
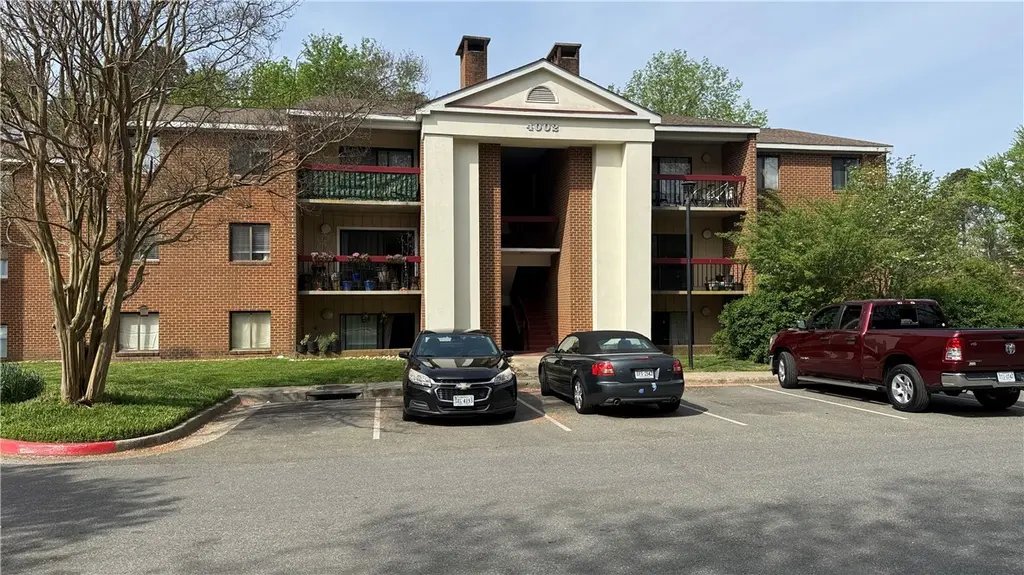
4002 Governors Sq #7 · Williamsburg, VA
Flood risk 1/10 · Minimal
- FEMA flood zone
- X (unshaded)
- Chance of flooding over 30 yrs
- 0.0%
- Est. flood insurance / yr
- $507 – $1,088
Fire risk 2/10 · Minimal
- Est. fire insurance / yr
- $666 – $1,236
Heat risk 8/10 · Major
- Hot days now (above 108°F)
- 7 days/yr
- Hot days in 30 yrs
- 16 days/yr
Wind risk 6/10 · Moderate
- Chance of severe wind over 30 yrs
- 66.0%
Air-quality risk 2/10 · Minimal
- Unhealthy air days now
- 1 days/yr
- Unhealthy air days in 30 yrs
- 1 days/yr
Risk factors via First Street. Map © Google.
Why this score? — see what drove the C- grade
The composite is a weighted blend of 9 inputs, each scored 0–100. Each bar is that input's sub-score; the figure is the points it added to the 100-point composite (weight × sub-score).
- ARV discount +15.0/15.0
- Cash flow +12.7/30.0
- Schools +5.0/10.0
- 1% rule +4.2/10.0
- Livability +4.2/5.0
- DSCR +3.8/10.0
- Rent growth +3.1/5.0
- Condition / age +2.5/5.0
- Appreciation +0.0/10.0
$210,000
🖨 Deal sheet 📄 Offer letter ✓ Due diligence
Listing remarks
This is a great 1st time buyer or downsizing situation as an alternative to renting! With $10,000 in possible closing cost allowance we can move you from renting to buying almost immediately, ! This is a 3 Bedroom condo is located in the middle of Williamsburg convenient to shopping, dining, entertaining near the New Town area. With 3 bedrooms and 2 full baths, a 45SF covered patio it has the space you need and hard to find at this price point! The community is on a local transportation route and has a park/playground. If you're an investor there is no rental cap and this would immediately have great cash flow potential with rent in the $1500-$1600/ mo range as is. Check out the floor plans
Key facts
- $259 HOA
- Built 1985
- Listed 61 days
Property features AI
Finance
- HOA & community: Homeowners association with monthly fee ($259); HOA covers association management, common areas, grounds maintenance, structure maintenance, snow removal, and trash; Association management provided by Town Management - Roy Dawson; Community amenities include a playground and park
Exterior
- Security: Smoke detectors
- Utilities: Public water; Public sewer; Public power
- Home design: Single-story; Entry level is 2; R5 zoning
- Construction: Brick, frame, drywall, and concrete construction; Asphalt shingle roof; Slab foundation; Built as listed (actual year built)
- Exterior features: Balcony
Interior
- Kitchen: Dishwasher; Range; Refrigerator
- Bedrooms: Three bedrooms (all on first level)
- Flooring: Carpet; Vinyl
- Bathrooms: Two full bathrooms
- Heating & cooling: Heat pump (heating and cooling); Electric heating
- Interior features: Sliding doors; Electric ventless fireplace
Neighborhood map
What this means for you Summary
Snapshot
- This is a 2-bed/2.0-bath single-family listed at $210k.
Deal economics
- At list price, monthly cash flow is $-21 ($-255/yr) — negative.
- To cash-flow at today's rent, offer at most $206k (1.8% below list).
- To meet the 1% rule (rent ≥ 1% of price), the offer needs to be $194k (7.8% below list).
- Recommended offer: $194k (7.8% below list) — sets the bar for 1% rule.
- Cap rate 6.2% vs local median 3.1% in Williamsburg — top-decile yield for the area; either an underpriced asset or a hidden risk that comps aren't pricing in. Stress-test before assuming the spread holds.
Location & tenants
- Location reads 84/100 on livability (#31 in VA, #734 nationally) — a professional / high-income tenant draw. Strengths: schools A+, amenities A+, commute A+; Watch: cost of living D.
- Market conditions: Rents rising (+2.5%/yr); 422 active listings in the ZIP; 13 comparable units currently listed for rent nearby; rentals leasing fast (median 2d on market — plan ~1-2 weeks tenant-placement turnaround); solid renter incomes; 358 units permitted in James City County in 2024 (24 in 5+ unit buildings).
Forward outlook
- Local home prices are declining (-3.0%/yr); year-one equity from $1k of loan paydown is wiped out by about $6k of value loss. Plan a longer hold.
- James City County population projected at +29% by 2050 — long-run rental-demand tailwind backs the buy-and-hold thesis.
Negotiation context
- It's been on market 61 days — a 6% lower offer ($197k) is reasonable based on typical stale-listing flexibility.
- 2 sale attempts since 11y ago with the ask held roughly flat each time — persistent listings suggest the price (not the market) is what's stuck; bring a comps-based counter.
Risks & watch-outs
- Climate carrying-cost: major wind risk, 66% chance of damaging wind over 30y; extreme-heat days projected 7→16/yr by 2055 (HVAC capex compounding) — expect insurance premiums to compound above CPI over the hold.
Questions for the listing agent
- What do current leases actually rent for vs. the listed asking? Can we see a recent rent roll and the last 12 months of T-12 income?
- It's been on market 61 days. Have you received any prior offers? Is the seller open to a 8% concession, seller financing, or rate buy-down credit?
- What does the HOA fee cover, when was the last increase, and are there any pending special assessments or reserve-fund shortfalls?
- Why hasn't it sold? Are there any deal-killer items the seller is aware of (foundation, flood, title, zoning, code violations)?
- Is there a deadline driving the sale (1031 exchange, divorce, estate, relocation)? That informs how much negotiation room exists.
- Schools are A-rated — typically a magnet for longer-tenancy family renters. What's the average tenant stay here, and is there a school-zone premium baked into asking?
- What's the average days-on-market for RENTAL listings here right now (not sales)? A rising rental-DOM trend means longer vacancies and softer asking-rent achievability than the comps imply.
- What's the recent tenant-quality profile in this submarket — average credit score on applications, eviction rate, late-payment / NSF rate, and stable-employment percentage? A property-management company in the area should have these aggregated.
- How much new for-sale + rental construction is in the pipeline within 1–3 miles? Heavy new supply typically softens prices + rents 12–24 months out; constrained supply supports both.
Investment metrics
- 1% rule
- 0.92% ✗
- Cap rate
- 6.17%
- Cash-on-cash
- -0.43%
- DSCR
- 0.98
- GRM
- 9.0
CMA / ARV
- ARV (on-the-fly)
- $281,673
- Comps found
- 9
Show comp detail 9 sales within ~0.75 mi
| Address | Dist | Beds/Ba | Sqft | Sold | Price | $/sf | Match |
|---|---|---|---|---|---|---|---|
| 4008 Governors Sq #6 | 0.05mi | 2/2.0 | 1,071 (0%) | 22mo | $115,000 | $107 | 79 |
| 4005 Governors Sq #10 | 0.06mi | 3/2.0 (+1) | 1,071 (0%) | 19mo | $195,000 | $182 | 76 |
| 126 Watford Ln | 0.74mi | 3/2.0 (+1) | 1,067 (-0%) | 13mo | $281,000 | $263 | 49 |
| 126 Watford Ln | 0.74mi | 3/2.0 (+1) | 1,067 (-0%) | 13mo | $281,000 | $263 | 49 |
| 107 Indigo Dam Rd | 0.68mi | 2/1.0 | 1,023 (-4%) | 10mo | $65,000 | $64 | 48 |
| 5202 Foundation St | 0.51mi | 2/2.0 | 1,167 (+9%) | 19mo | $316,000 | $271 | 45 |
| 4309 Creekside Loop | 0.47mi | 2/1.5 | 973 (-9%) | 22mo | $310,000 | $319 | 42 |
| 5215 Foundation St | 0.50mi | 2/2.0 | 1,172 (+9%) | 23mo | $330,000 | $282 | 42 |
| 5215 Center St #210 | 0.51mi | 1/1.0 (-1) | 950 (-11%) | 24mo | $274,500 | $289 | 29 |
Match score weights: distance 35% · size 25% · config 20% · recency 20%. Top-matched comps best support the ARV.
Projected returns pro-forma
-3.0% appreciation · 2.53% rent growth · sell at horizon
- IRR
- -17.5%
- Equity multiple
- 0.38×
- Total profit
- $-36,205
- Equity at exit
- $31,312
- IRR
- -10.5%
- Equity multiple
- 0.38×
- Total profit
- $-36,609
- Equity at exit
- $18,157
Cash invested: $58,800 (down + closing). Projections, not guarantees.
Landlord ↔ Tenant lean methodology
- Overall (STATE)
- 55 Moderately Landlord-Leaning
- State Virginia
- 55 Moderately Landlord-Leaning · D+2
- County
- — inherits STATE
- City
- — inherits STATE
ZIP-level market 23188
- Rents YoY
- 2.5%
- Active inventory
- 422
- Price-to-rent
- 9.0×
Monthly cashflow live
- Estimated rent
- $1,936 high interval (Pro) →
- Mortgage (P&I)
- −$1,101
- Tax from tax record
- −$103 /mo · $1,233/yr
- Insurance
- −$88
- HOA
- −$259
- Vacancy / Maint / Mgmt
- −$407
- Net cashflow
- $-21
Break-even live
UW: 25.0% down · 7.5% · 30yr · 1.5% tax · 5.0% vac · 8.0% maint · 8.0% mgmt
Financing live
Cash to close
- Down payment
- $52,500
- Closing costs
- $6,300
- Reserves months
- —
- Total cash needed
- —
Loan-product check · same deal, 3 products live
Conventional
25% down · 7.5% · 30yr
- Down + closing
- —
- Monthly P&I
- —
- Monthly cashflow
- —
- DSCR
- —
- Eligible?
- —
Personal DTI + credit; lowest rate.
DSCR
20% down · 8.5% · 30yr
- Down + closing
- —
- Monthly P&I
- —
- Monthly cashflow
- —
- DSCR
- —
- Eligible?
- —
No personal income docs; deal must DSCR.
Hard money
10% down · 12.0% · 12mo
- Down + closing
- —
- Monthly P&I
- —
- Monthly cashflow
- —
- DSCR
- —
- Eligible?
- —
Short-term bridge; refi at stabilization.
Rent comps 13 comps
| Address | Beds | Baths | Sqft | Rent | $/sqft | DOM | Units | Dist |
|---|---|---|---|---|---|---|---|---|
| 3873 Strawberry Plains Rd Unit B Williamsburg, VA | 1.0 | 1.0 | 714 | $1,500 | $2.10 | 12d | 1 | 0.26mi |
| 4049 Midlands Rd Williamsburg, VA | 2.0 | 1.5 | 1020 | $1,650 | $1.62 | 2d | 1 | 0.35mi |
| 3813 Staffordshire Ln Williamsburg, VA | 3.0 | 1.5 | 1150 | $1,700 | $1.48 | 2d | 1 | 0.41mi |
| 4375 New Town Ave Williamsburg, VA | 1.0–2.0 | 1.0–2.5 | 1141 | $2,765 | $2.42 | 2d | 15 | 0.70mi |
| 2800 Ben Franklin Cir Williamsburg, VA | 1.0–2.0 | 1.0–2.5 | 968 | $2,196 | $2.27 | 2d | 15 | 0.90mi |
| 2901 Queens Path Williamsburg, VA | 2.0 | 2.0 | 1357 | $2,300 | $1.69 | 11d | 1 | 1.20mi |
| 150 Kings Manor Dr Williamsburg, VA | 1.0–3.0 | 1.0–3.0 | 1295 | $2,846 | $2.20 | 2d | 23 | 1.20mi |
| 132 Jesters Ln Unit B Williamsburg, VA | 2.0 | 1.0 | 720 | $1,500 | $2.08 | 2d | 1 | 1.21mi |
| 203 Bristol Cmn Williamsburg, VA | 2.0 | 2.0 | 1159 | $2,100 | $1.81 | 2d | 1 | 1.22mi |
| 1400 Middle St Williamsburg, VA | 1.0–2.0 | 1.0 | 686 | $1,565 | $2.28 | 2d | 1 | 1.28mi |
| 155 Sterling Manor Dr Williamsburg, VA | 1.0–3.0 | 1.0–3.5 | 1588 | $2,404 | $1.51 | 2d | 13 | 1.32mi |
| 1203 Jamestown Rd Unit A1 Williamsburg, VA | 2.0 | 1.0 | 848 | $1,275 | $1.50 | 16d | 1 | 1.32mi |
| 3500 Carriage House Way Williamsburg, VA | 1.0–3.0 | 1.0–2.5 | 1300 | $2,534 | $1.95 | 2d | 24 | 1.34mi |
HOA detail
- Monthly dues
- $259 · $3,108/yr
Listing history 15 events
-
2026-06-18days on market $210,000 Active 61 DOM
-
2026-06-17days on market $210,000 Active 60 DOM
-
2026-06-16days on market $210,000 Active 59 DOM
-
2026-06-15days on market $210,000 Active 58 DOM
-
2026-06-13days on market $210,000 Active 56 DOM
-
2026-06-09days on market $210,000 Active 52 DOM
-
2026-06-08days on market $210,000 Active 51 DOM
-
2026-06-07days on market $210,000 Active 50 DOM
-
2026-06-05days on market $210,000 Active 47 DOM
-
2026-06-03days on market $210,000 Active 46 DOM
-
2026-06-02days on market $210,000 Active 45 DOM
-
2026-06-01days on market $210,000 Active 44 DOM
-
2026-05-31days on market $210,000 Active 43 DOM
-
2026-04-18$210,000 Active
-
2015-01-19$105,000
ⓘ Source: listings_history table (triggers on properties + properties_extension) + one-shot
backfill from property_details.listing_events for pre-trigger history.
Tax reassessment forecast VA · Resets to sale price
- Current annual tax
- $1,233 · $103/mo
- Projected year-2 tax
- $1,722 · $144/mo
- Expected delta
- +$489/yr (+$41/mo · 39.6%)
ⓘ Screening estimate from a state-policy table — verify with the county assessor before closing.
Climate risk First Street
- Flood 1/10 Low FEMA zone X (unshaded) · 0% chance over 30 yrs
- Wildfire 2/10 Low
- Heat 8/10 Severe 7 d/yr ≥108°F today · 16 d/yr by 30 yrs out
- Wind 6/10 Major 66% chance of damaging wind over 30 yrs
- Air quality 2/10 Low 1 unhealthy d/yr today · 1 by 30 yrs out
Nearby sold comps map
Loading sold comps map…
Walkable amenities ~0.75 mi
Loading nearby amenities…
Taxation est. · year 1
- Rental income
- $23,229
- − Mortgage interest
- −$11,763
- − Property taxes
- −$1,233
- − Insurance
- −$1,050
- − Repairs & maintenance
- −$1,858
- − Management
- −$1,858
- − HOA
- −$3,108
- − Depreciation
- −$6,109
- Taxable loss
- −$3,751
- Est. tax savings @ 24.0%
- +$900
- After-tax cash flow
- $645/yr
For passive investors: Depreciation is non-cash, so a rental often shows a tax loss while cash-flowing — sheltering income. Rental losses are passive: they offset passive income freely, and up to $25,000/yr can offset ordinary (W-2) income if you actively participate and your MAGI is under $100k (phasing out to $0 by $150k); unused losses carry forward. On sale, claimed depreciation is recaptured at up to 25%, and gains may owe capital-gains tax (a 1031 exchange can defer both). Figures are a year-1 estimate at your 24.0% rate — not tax advice; consult a CPA.
Schools (NCES district)
No district data.
Livability — Williamsburg
- Score
- 84/100
- State rank
- #31
- US rank
- #734
Category grades
Schools grade is shown separately in the Schools card above.
Census & demographics
- County
- James City County · 45,803 people
- City population
- 101,073
- Metro
- Virginia Beach-Norfolk-Newport News, VA-NC
- Population (ZIP)
- 45,803
- Household income
- $103,160
- Rent vs Own
- Severe rent burden
- 1353.0
Population outlook (James City County) Hauer SSP2
- Today (2025)
- 84,286 people
- By 2030
- 89,687 · +6.4%
- By 2040
- 99,580 · +18.1%
- By 2050
- 108,487 · +28.7%
- By 2075
- 128,950 · +53.0%
- By 2100
- 138,702 · +64.6%
Race, ethnicity, and origin ACS 2023
- Neighborhood character
- Predominantly White (72%)
- Race & ethnicity
- White 72% Black 13% Two or more races 7% Hispanic / Latino 6% Asian 3%
- Hispanic origin (detail)
- Mexican 2% Puerto Rican 2%
- Common ancestry
- Lithuanian 3% Slovak 3% Romanian 2%
- Foreign-born
- 7% · Canada, China
- Languages at home
- 93% English-only · Spanish 3% Chinese 1%
Political lean MEDSL · James City
- 2024 margin
- Lean D (+6.2) · D 52.5% · R 46.3% · Other 1.1%
- 2008→2024 swing
- +15.5pp toward D · 2008: -9.2pp · 2024: 6.2pp
- All cycles
- 2024: D+6.2 2020: D+4.8 2016: R+5.1 2012: R+12.1 2008: R+9.2
Not yet ingested
- Civics
- —
Market trends
- HPI YoY
- ▼ -213.65%
- Current HPI
- 226.2192
- Rent YoY
- ▲ 2.53%
- Metro
- Virginia Beach-Norfolk-Newport News, VA-NC
- State GDP YoY
- ▲ 2.40%
- F500 in state
- 50
Industry mix (Fortune 500 HQ in VA)
| Industry | F500 HQs | Revenue |
|---|---|---|
| Aerospace / Defense | 4 | $236B |
|
||
| Technology / Defense | 3 | $32B |
|
||
| Financial Services | 2 | $176B |
|
||
| Utilities | 2 | $27B |
|
||
| Insurance | 2 | $25B |
|
||
| Technology | 2 | $15B |
|
||
Price history
+100.0% since first listed2 events — show timeline
- 2026-04-18 Listed $210,000 WMLS
- 2015-01-19 Listed $105,000 WMLS
Property tax history
+2.4%/yrLatest (2025): $1,233 · +112.8% YoY. Source: county tax records.
Cash-flow waterfall
monthlySold comps — $/sqft
last 12 mo · ≤1 miLoading sold comps…