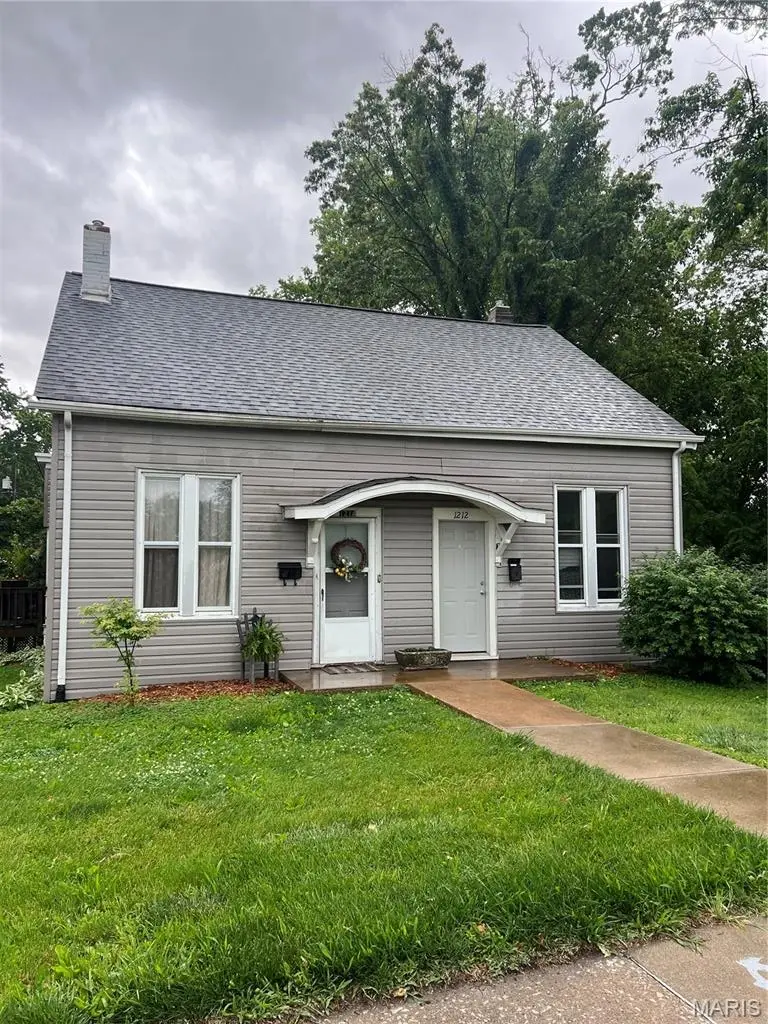
1214 Lebanon Ave · Belleville, IL
Flood risk 1/10 · Minimal
- FEMA flood zone
- X
- Chance of flooding over 30 yrs
- 0.0%
- Est. flood insurance / yr
- $473 – $860
Fire risk 1/10 · Minimal
- Est. fire insurance / yr
- $804 – $1,492
Heat risk 5/10 · Moderate
- Hot days now (above 107°F)
- 7 days/yr
- Hot days in 30 yrs
- 21 days/yr
Wind risk 2/10 · Minimal
- Chance of severe wind over 30 yrs
- 1.0%
Air-quality risk 4/10 · Minor
- Unhealthy air days now
- 3 days/yr
- Unhealthy air days in 30 yrs
- 6 days/yr
Risk factors via First Street. Map © Google.
Why this score? — see what drove the B grade
The composite is a weighted blend of 9 inputs, each scored 0–100. Each bar is that input's sub-score; the figure is the points it added to the 100-point composite (weight × sub-score).
- Cash flow +30.0/30.0
- 1% rule +10.0/10.0
- DSCR +10.0/10.0
- ARV discount +7.5/15.0
- Rent growth +4.3/5.0
- Livability +3.9/5.0
- Condition / age +2.5/5.0
- Schools +2.2/10.0
- Appreciation +0.0/10.0
$80,000
🖨 Deal sheet 📄 Offer letter ✓ Due diligence
Key facts
- 0.41 acre lot
- Built 1890
- Listed 30 days
Property features AI
Finance
- Other: Property listed as residential income with two units; Above-grade finished area recorded as 1,672 (source: Other)
- Financial info: Net operating income reported at $8,400
- HOA & community: No HOA information provided
Exterior
- Parking: No parking details provided
- Security: No security features provided
- Utilities: No water, sewer, or power details provided
- Home design: Residential income building (2–4 units)
- Construction: Vinyl siding; Built prior to or listed in public records (year built not provided)
- Exterior features: Lot is approximately 0.41 acre
Interior
- Kitchen: No kitchen appliance details provided
- Bedrooms: Two 1-bedroom units
- Flooring: No flooring details provided
- Bathrooms: Each unit has 1 bathroom
- Heating & cooling: Wall/window air conditioning units
- Interior features: Cellar (basement)
- Laundry & utility: No laundry or utility appliance details provided
Neighborhood map
What this means for you Summary
Snapshot
- This is a 2-bed/4.0-bath single-family listed at $80k.
Deal economics
- At list price, monthly cash flow is $404 ($5k/yr) — positive.
- The deal already cash-flows at list — no discount required.
- Meets the 1% rule at list price ($1k rent vs $80k).
- Recommended offer: $79k (1.5% below list) — sets the bar for market timing.
- Cap rate 12.4% vs local median 5.6% in Belleville — top-decile yield for the area; either an underpriced asset or a hidden risk that comps aren't pricing in. Stress-test before assuming the spread holds.
Location & tenants
- Location reads 78/100 on livability (#142 in IL, #2,604 nationally) — a middle-class / working-renter tenant base. Strengths: commute A+, cost of living A+, housing A+; Watch: crime F, amenities D-.
- Belleville Twp Hsd 201 (suburban): math 21% / reading 28% proficiency, ranked #308 of 620 in IL (top 50%) — low school quality limits family demand, transient renter base, plan for 1-2y turnover.
- Zoned schools: Belleville High School-East (math 23% / reading 30%, grade F, #241 of 693 statewide, top 35%, 2,568 students, 0% FRL).
- Market conditions: Rents rising fast (+7.0%/yr); 157 active listings in the ZIP; 9 comparable units currently listed for rent nearby; rentals at typical pace (median 24d on market — plan ~3-4 weeks tenant-placement turnaround); solid renter incomes; 783 units permitted in St. Clair County in 2024 (378 in 5+ unit buildings).
Forward outlook
- Local home prices are declining (-3.0%/yr); year-one equity from $553 of loan paydown is wiped out by about $2k of value loss. Plan a longer hold.
- St. Clair County population projected at -23% by 2050 — secular population decline; favor cash flow + early exit over multi-decade hold.
- At projected returns (-3.0% appreciation + 7.0% rent growth), your $22k cash investment doubles in ~5 years — after that, you're playing with house money.
Negotiation context
- It's been on market 30 days — a 2% lower offer ($79k) is reasonable based on typical stale-listing flexibility.
- 2 sale attempts since 3y ago with the ask held roughly flat each time — persistent listings suggest the price (not the market) is what's stuck; bring a comps-based counter.
- Current owner paid $55k; 45% above their basis — modest negotiation headroom, anchor on the comps not their cost.
Risks & watch-outs
- Watch-outs: property tax is 3.5% of price; built in 1890 — expect roof / HVAC / electrical / plumbing capex.
- Climate carrying-cost: extreme-heat days projected 7→21/yr by 2055 (HVAC capex compounding) — expect insurance premiums to compound above CPI over the hold.
Questions for the listing agent
- Built in 1890 — when were the roof, HVAC, electrical panel, plumbing, and water heater last replaced?
- Property tax is high relative to price — has the assessment been appealed recently, and will the sale trigger a re-assessment?
- Is there a deadline driving the sale (1031 exchange, divorce, estate, relocation)? That informs how much negotiation room exists.
- Crime grade is F in this area — have there been break-ins, vandalism, or insurance claims at this property in the last 3 years? What carrier currently insures it and at what premium?
- What's the average days-on-market for RENTAL listings here right now (not sales)? A rising rental-DOM trend means longer vacancies and softer asking-rent achievability than the comps imply.
- What's the recent tenant-quality profile in this submarket — average credit score on applications, eviction rate, late-payment / NSF rate, and stable-employment percentage? A property-management company in the area should have these aggregated.
- How much new for-sale + rental construction is in the pipeline within 1–3 miles? Heavy new supply typically softens prices + rents 12–24 months out; constrained supply supports both.
Investment metrics
- 1% rule
- 1.72% ✓
- Cap rate
- 12.35%
- Cash-on-cash
- 21.65%
- DSCR
- 1.96
- GRM
- 4.8
CMA / ARV
- ARV (on-the-fly)
- $190,608
- Comps found
- 12
Show comp detail 12 sales within ~0.75 mi
| Address | Dist | Beds/Ba | Sqft | Sold | Price | $/sf | Match |
|---|---|---|---|---|---|---|---|
| 1411 N Church St | 0.20mi | 3/2.5 (+1) | 1,674 (+0%) | 4mo | $215,000 | $128 | 76 |
| 1631 N Church St | 0.06mi | 3/2.0 (+1) | 1,588 (-5%) | 2mo | $149,900 | $94 | 74 |
| 1705 N Charles St | 0.19mi | 3/2.0 (+1) | 1,730 (+4%) | 1mo | $198,000 | $114 | 72 |
| 1414 Lebanon Ave | 0.28mi | 3/1.0 (+1) | 1,604 (-4%) | 2mo | $135,900 | $85 | 62 |
| 1715 Scheel St | 0.22mi | 3/2.5 (+1) | 1,509 (-10%) | 2mo | $230,000 | $152 | 60 |
| 1922 Muren Blvd | 0.49mi | 3/1.5 (+1) | 1,676 (+0%) | 3mo | $239,900 | $143 | 59 |
| 1615 E Belle Ave | 0.35mi | 3/1.0 (+1) | 1,600 (-4%) | 6mo | $132,000 | $83 | 55 |
| 1316 N Church St | 0.25mi | 3/1.0 (+1) | 1,500 (-10%) | 2mo | $150,000 | $100 | 52 |
| 130 N Indiana Ave | 0.64mi | 3/2.5 (+1) | 1,760 (+5%) | 2mo | $200,000 | $114 | 48 |
| 1805 Page Ave | 0.28mi | 2/1.0 | 1,436 (-14%) | 4mo | $39,900 | $28 | 48 |
| 300 Derbyshire Dr | 0.69mi | 3/2.0 (+1) | 1,750 (+5%) | 4mo | $279,000 | $159 | 44 |
| 117 Timber Dr | 0.62mi | 3/2.0 (+1) | 1,560 (-7%) | 4mo | $230,000 | $147 | 44 |
Match score weights: distance 35% · size 25% · config 20% · recency 20%. Top-matched comps best support the ARV.
Projected returns pro-forma
-3.0% appreciation · 7.04% rent growth · sell at horizon
- IRR
- 19.4%
- Equity multiple
- 1.84×
- Total profit
- $18,709
- Equity at exit
- $11,928
- IRR
- 30.7%
- Equity multiple
- 4.39×
- Total profit
- $75,877
- Equity at exit
- $6,917
Cash invested: $22,400 (down + closing). Projections, not guarantees.
Landlord ↔ Tenant lean methodology
- Overall (STATE)
- 43 Moderately Tenant-Leaning
- State Illinois
- 43 Moderately Tenant-Leaning · D+7
- County
- — inherits STATE
- City
- — inherits STATE
ZIP-level market 62221
- Home prices YoY
- -24.2%
- Rents YoY
- 7.0%
- Active inventory
- 157
- Price-to-rent
- 4.8×
Monthly cashflow live
- Estimated rent
- $1,380 high interval (Pro) →
- Mortgage (P&I)
- −$420
- Tax from tax record
- −$233 /mo · $2,798/yr
- Insurance
- −$33
- HOA
- −$0
- Vacancy / Maint / Mgmt
- −$290
- Net cashflow
- $404
Break-even live
UW: 25.0% down · 7.5% · 30yr · 1.5% tax · 5.0% vac · 8.0% maint · 8.0% mgmt
Financing live
Cash to close
- Down payment
- $20,000
- Closing costs
- $2,400
- Reserves months
- —
- Total cash needed
- —
Loan-product check · same deal, 3 products live
Conventional
25% down · 7.5% · 30yr
- Down + closing
- —
- Monthly P&I
- —
- Monthly cashflow
- —
- DSCR
- —
- Eligible?
- —
Personal DTI + credit; lowest rate.
DSCR
20% down · 8.5% · 30yr
- Down + closing
- —
- Monthly P&I
- —
- Monthly cashflow
- —
- DSCR
- —
- Eligible?
- —
No personal income docs; deal must DSCR.
Hard money
10% down · 12.0% · 12mo
- Down + closing
- —
- Monthly P&I
- —
- Monthly cashflow
- —
- DSCR
- —
- Eligible?
- —
Short-term bridge; refi at stabilization.
Rent comps 9 comps
| Address | Beds | Baths | Sqft | Rent | $/sqft | DOM | Units | Dist |
|---|---|---|---|---|---|---|---|---|
| 1717 La Salle St Belleville, IL | 3.0 | 1.0 | 1104 | $1,350 | $1.22 | 24d | 1 | 0.27mi |
| 1671 Shadow Ridge Ct Belleville, IL | 1.0–2.0 | 1.0 | 815 | $1,325 | $1.62 | 2d | 12 | 0.31mi |
| 1 Rosehaven Dr Belleville, IL | 3.0 | 2.0 | 1512 | $1,325 | $0.88 | 24d | 1 | 0.35mi |
| 1107 Bristow St Belleville, IL | 3.0 | 1.0 | 1238 | $1,500 | $1.21 | 12d | 1 | 0.50mi |
| 308 Bobbie Dr Swansea, IL | 2.0 | 2.0 | 1130 | $1,500 | $1.33 | 24d | 1 | 0.52mi |
| 25 Glencoe Dr Belleville, IL | 3.0 | 1.0 | 1200 | $1,275 | $1.06 | 24d | 1 | 0.67mi |
| 134 Clinton Hill Dr Belleville, IL | 3.0 | 3.0 | 1890 | $1,850 | $0.98 | 2d | 1 | 1.31mi |
| 134 Clinton Hill Dr Belleville, IL | 3.0 | 3.0 | 1890 | $1,850 | $0.98 | 24d | 1 | 1.31mi |
| 134 Clinton Hill Dr Belleville, IL | 3.0 | 3.0 | 1890 | $1,850 | $0.98 | 15d | 1 | 1.31mi |
Listing history 17 events
-
2026-06-18days on market $80,000 Active 30 DOM
-
2026-06-17days on market $80,000 Active 29 DOM
-
2026-06-16days on market $80,000 Active 28 DOM
-
2026-06-15days on market $80,000 Active 27 DOM
-
2026-06-13days on market $80,000 Active 25 DOM
-
2026-06-09days on market $80,000 Active 21 DOM
-
2026-06-08days on market $80,000 Active 20 DOM
-
2026-06-07days on market $80,000 Active 19 DOM
-
2026-06-03days on market $80,000 Active 15 DOM
-
2026-06-02days on market $80,000 Active 14 DOM
-
2026-06-01days on market $80,000 Active 13 DOM
-
2026-05-31days on market $80,000 Active 12 DOM
-
2026-05-19$80,000 Active
-
2023-05-09historical
-
2023-04-21price $70,000
-
2023-04-11$80,000 Active
-
2010-03-05soldstatus $55,000
ⓘ Source: listings_history table (triggers on properties + properties_extension) + one-shot
backfill from property_details.listing_events for pre-trigger history.
Tax reassessment forecast IL · Partial reset (capped growth)
- Current annual tax
- $2,798 · $233/mo
- Projected year-2 tax
- $2,798 · $233/mo
- Expected delta
- $0/yr ($0/mo · 0.0%)
ⓘ Screening estimate from a state-policy table — verify with the county assessor before closing.
Climate risk First Street
- Flood 1/10 Low FEMA zone X · 0% chance over 30 yrs
- Wildfire 1/10 Low
- Heat 5/10 Major 7 d/yr ≥107°F today · 21 d/yr by 30 yrs out
- Wind 2/10 Low 100% chance of damaging wind over 30 yrs
- Air quality 4/10 Moderate 3 unhealthy d/yr today · 6 by 30 yrs out
Nearby sold comps map
Loading sold comps map…
Walkable amenities ~0.75 mi
Loading nearby amenities…
Taxation est. · year 1
- Rental income
- $16,558
- − Mortgage interest
- −$4,481
- − Property taxes
- −$2,798
- − Insurance
- −$400
- − Repairs & maintenance
- −$1,325
- − Management
- −$1,325
- − Depreciation
- −$2,327
- Taxable income
- $3,902
- Est. tax owed @ 24.0%
- −$937
- After-tax cash flow
- $3,912/yr
For passive investors: Depreciation is non-cash, so a rental often shows a tax loss while cash-flowing — sheltering income. Rental losses are passive: they offset passive income freely, and up to $25,000/yr can offset ordinary (W-2) income if you actively participate and your MAGI is under $100k (phasing out to $0 by $150k); unused losses carry forward. On sale, claimed depreciation is recaptured at up to 25%, and gains may owe capital-gains tax (a 1031 exchange can defer both). Figures are a year-1 estimate at your 24.0% rate — not tax advice; consult a CPA.
Schools (NCES district)
- District
- Belleville Twp Hsd 201
- NCES district ID
- 1705640
- Math proficiency
- 21% ▼ -8.00%
- Reading proficiency
- 28% ▼ -3.00%
- Median HH income
- $58,064
- Composite
- 22.39/100
- National rank
- #8115
- State rank
- #308 of 620 in IL
Livability — Belleville
- Score
- 78/100
- State rank
- #142
- US rank
- #2604
Category grades
Schools grade is shown separately in the Schools card above.
Census & demographics
- Census place
- Belleville, IL
- County
- Saint Clair County · 169,691 people
- City population
- 47,407
- Metro
- St. Louis, MO-IL
- Population (ZIP)
- 29,875
- Household income
- $82,271
- Rent vs Own
- Severe rent burden
- 658.0
Population outlook (St. Clair County) Hauer SSP2
- Today (2025)
- 250,366 people
- By 2030
- 240,511 · -3.9%
- By 2040
- 217,391 · -13.2%
- By 2050
- 192,699 · -23.0%
- By 2075
- 140,637 · -43.8%
- By 2100
- 100,499 · -59.9%
Race, ethnicity, and origin ACS 2023
- Neighborhood character
- Diverse neighborhood (Simpson 0.58)
- Race & ethnicity
- White 56% Black 31% Two or more races 6% Hispanic / Latino 3% Asian 2%
- Common ancestry
- Lithuanian 4% Romanian 2% Slovak 2%
- Foreign-born
- 3% · Canada, South Korea
- Languages at home
- 94% English-only · Spanish 2% German/W. Germanic 1% French/Haitian/Cajun 1%
Political lean MEDSL · St. Clair
- 2024 margin
- Lean D (+7.9) · D 53.0% · R 45.1% · Other 1.8%
- 2008→2024 swing
- -14.6pp toward R · 2008: 22.4pp · 2024: 7.9pp
- All cycles
- 2024: D+7.9 2020: D+8.7 2016: D+5.6 2012: D+14.5 2008: D+22.4
Not yet ingested
- Civics
- —
Market trends
- HPI YoY
- ▼ -53.50%
- Current HPI
- 167.8124
- Rent YoY
- ▲ 7.04%
- Metro
- St. Louis, MO-IL
- State GDP YoY
- ▲ 1.59%
- F500 in state
- 60
Industry mix (Fortune 500 HQ in IL)
| Industry | F500 HQs | Revenue |
|---|---|---|
| Insurance | 4 | $201B |
|
||
| Consumer Goods | 4 | $87B |
|
||
| Industrial Machinery | 3 | $64B |
|
||
| Healthcare | 2 | $55B |
|
||
| Retail / Pharmacy | 1 | $148B |
|
||
| Agriculture / Food | 1 | $86B |
|
||
Price history
+45.5% since first listed5 events — show timeline
- 2026-05-19 Listed $80,000 MARIS as Distributed by MLS Grid
- 2023-05-09 Delisted — MARIS as Distributed by MLS Grid
- 2023-04-21 Price Changed $70,000 MARIS as Distributed by MLS Grid
- 2023-04-11 Listed $80,000 MARIS as Distributed by MLS Grid
- 2010-03-05 Sold (Public Records) $55,000 Public Records
Property tax history
+5.2%/yrLatest (2024): $2,798 · -4.4% YoY. Source: county tax records.
Cash-flow waterfall
monthlySold comps — $/sqft
last 12 mo · ≤1 miLoading sold comps…