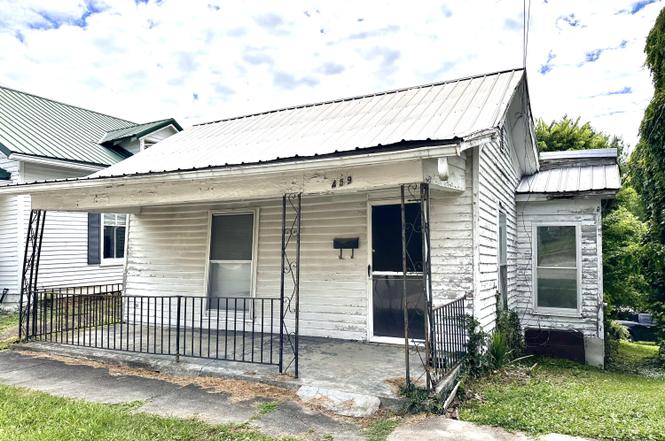
459 N Broadway · Carlisle, KY
Flood risk 1/10 · Minimal
- FEMA flood zone
- X (unshaded)
- Chance of flooding over 30 yrs
- 0.0%
- Est. flood insurance / yr
- $473 – $860
Fire risk 3/10 · Minor
- Est. fire insurance / yr
- $839 – $1,559
Heat risk 4/10 · Minor
- Hot days now (above 102°F)
- 7 days/yr
- Hot days in 30 yrs
- 20 days/yr
Wind risk 2/10 · Minimal
- Chance of severe wind over 30 yrs
- 3.0%
Air-quality risk 2/10 · Minimal
- Unhealthy air days now
- 0 days/yr
- Unhealthy air days in 30 yrs
- 1 days/yr
Risk factors via First Street. Map © Google.
Why this score? — see what drove the B+ grade
The composite is a weighted blend of 9 inputs, each scored 0–100. Each bar is that input's sub-score; the figure is the points it added to the 100-point composite (weight × sub-score).
- Cash flow +30.0/30.0
- 1% rule +10.0/10.0
- DSCR +10.0/10.0
- Appreciation +10.0/10.0
- ARV discount +7.5/15.0
- Livability +3.1/5.0
- Rent growth +2.5/5.0
- Condition / age +2.5/5.0
- Schools +2.3/10.0
$25,000
🖨 Deal sheet 📄 Offer letter ✓ Due diligence
Listing remarks
Unlock the potential of this 2 bedroom, 1 bath home located in the heart of downtown historic Carlisle. Whether you're looking to expand your investment portfolio, create a rental property, or renovate and resell, this one is for you! SOLD AS-IS
Key facts
- 8,000 sq ft lot
- Listed 3 days
Property features AI
Exterior
- Utilities: Public sewer; Cable available; Electricity connected; Natural gas connected; Sewer connected; Water connected
- Home design: House; One level
- Construction: Metal roof; Wood siding; Pillar/post/pier foundation; Built area approximately 1,058
- Exterior features: Public water; Not on waterfront
Interior
- Kitchen: Eat-in kitchen
- Bedrooms: 5 total rooms
- Flooring: Carpet; Hardwood
- Bathrooms: 1 full bathroom
- Heating & cooling: Natural gas heating; Has heating
- Interior features: Eat-in kitchen; No fireplace
- Laundry & utility: Main level laundry
Neighborhood map
What this means for you Summary
Snapshot
- This is a 2-bed/1.0-bath single-family listed at $25k.
Deal economics
- At list price, monthly cash flow is $628 ($8k/yr) — positive.
- The deal already cash-flows at list — no discount required.
- Meets the 1% rule at list price ($981 rent vs $25k).
- Cap rate 36.4% vs local median 3.7% in Carlisle — top-decile yield for the area; either an underpriced asset or a hidden risk that comps aren't pricing in. Stress-test before assuming the spread holds.
Location & tenants
- Location reads 62/100 on livability (#349 in KY) — a middle-class / working-renter tenant base. Strengths: crime A+, cost of living A+, housing A+; Watch: amenities F, commute F, employment F.
- Nicholas County (rural): math 22% / reading 32% proficiency, ranked #132 of 165 in KY (top 80%) — low school quality limits family demand, transient renter base, plan for 1-2y turnover.
- Zoned schools: Nicholas County Elementary School (math 22% / reading 29%, grade F, #477 of 676 statewide, top 71%, 664 students, 71% FRL); Nicholas County High School (math 22% / reading 37%, grade F, #127 of 254 statewide, top 58%, 455 students, 63% FRL) — zoned schools average 67% FRL vs 50% district-wide (17 pts higher); higher-poverty schools than district average — tighter screening recommended.
- Market conditions: 51 active listings in the ZIP; 2 units permitted in Nicholas County in 2024 (0 in 5+ unit buildings).
Forward outlook
- In year one you build about $3k of equity ($173 loan paydown + $2k appreciation (10.0% local appreciation)).
- Nicholas County population projected at -12% by 2050 — secular population decline; favor cash flow + early exit over multi-decade hold.
- At projected returns (10.0% appreciation + 3.0% rent growth), your $7k cash investment doubles in ~1 year — after that, you're playing with house money.
- By year 10, paydown + projected appreciation supports a ~$32k cash-out refi (75% LTV) — recoverable capital for the next deal without selling this one.
Negotiation context
- Only 3 days on market — expect competitive offers; lowballing is unlikely to land.
- Current owner paid $10k; list at $25k implies a 163% gain — meaningful room to come down on a strong offer.
Questions for the listing agent
- Is there a deadline driving the sale (1031 exchange, divorce, estate, relocation)? That informs how much negotiation room exists.
- Schools are D-rated, which usually means shorter tenancies and higher turnover. Who's the typical renter profile here, and what's been the actual vacancy rate?
- What's the average days-on-market for RENTAL listings here right now (not sales)? A rising rental-DOM trend means longer vacancies and softer asking-rent achievability than the comps imply.
- What's the recent tenant-quality profile in this submarket — average credit score on applications, eviction rate, late-payment / NSF rate, and stable-employment percentage? A property-management company in the area should have these aggregated.
- How much new for-sale + rental construction is in the pipeline within 1–3 miles? Heavy new supply typically softens prices + rents 12–24 months out; constrained supply supports both.
Investment metrics
- 1% rule
- 3.92% ✓
- Cap rate
- 36.42%
- Cash-on-cash
- 107.59%
- DSCR
- 5.79
- GRM
- 2.1
CMA / ARV
- ARV (on-the-fly)
- $150,236
- Comps found
- 4
Show comp detail 4 sales within ~0.75 mi
| Address | Dist | Beds/Ba | Sqft | Sold | Price | $/sf | Match |
|---|---|---|---|---|---|---|---|
| 309 W 2nd St | 0.39mi | 3/1.0 (+1) | 960 (-9%) | 8mo | $160,000 | $167 | 54 |
| 139 Oriole St | 0.25mi | 3/1.0 (+1) | 1,215 (+15%) | 20mo | $160,000 | $132 | 42 |
| 506 North Locust St | 0.12mi | 3/2.0 (+1) | 1,216 (+15%) | 23mo | $132,000 | $109 | 41 |
| 101 Emmert Dr | 0.49mi | 2/1.5 | 912 (-14%) | 14mo | $129,900 | $142 | 40 |
Match score weights: distance 35% · size 25% · config 20% · recency 20%. Top-matched comps best support the ARV.
Projected returns pro-forma
10.0% appreciation · 3.0% rent growth · sell at horizon
- IRR
- —
- Equity multiple
- 8.66×
- Total profit
- $53,587
- Equity at exit
- $22,522
- IRR
- —
- Equity multiple
- 19.05×
- Total profit
- $126,370
- Equity at exit
- $48,570
Cash invested: $7,000 (down + closing). Projections, not guarantees.
Landlord ↔ Tenant lean methodology
- Overall (STATE)
- 83 Strongly Landlord-Friendly
- State Kentucky
- 83 Strongly Landlord-Friendly · R+16
- County
- — inherits STATE
- City
- — inherits STATE
ZIP-level market 40311
- Home prices YoY
- 6.3%
- Active inventory
- 51
- Price-to-rent
- 2.1×
Monthly cashflow live
- Estimated rent
- $981 medium interval (Pro) →
- Mortgage (P&I)
- −$131
- Tax from tax record
- −$6 /mo · $71/yr
- Insurance
- −$10
- HOA
- −$0
- Vacancy / Maint / Mgmt
- −$206
- Net cashflow
- $628
Break-even live
UW: 25.0% down · 7.5% · 30yr · 1.5% tax · 5.0% vac · 8.0% maint · 8.0% mgmt
Financing live
Cash to close
- Down payment
- $6,250
- Closing costs
- $750
- Reserves months
- —
- Total cash needed
- —
Loan-product check · same deal, 3 products live
Conventional
25% down · 7.5% · 30yr
- Down + closing
- —
- Monthly P&I
- —
- Monthly cashflow
- —
- DSCR
- —
- Eligible?
- —
Personal DTI + credit; lowest rate.
DSCR
20% down · 8.5% · 30yr
- Down + closing
- —
- Monthly P&I
- —
- Monthly cashflow
- —
- DSCR
- —
- Eligible?
- —
No personal income docs; deal must DSCR.
Hard money
10% down · 12.0% · 12mo
- Down + closing
- —
- Monthly P&I
- —
- Monthly cashflow
- —
- DSCR
- —
- Eligible?
- —
Short-term bridge; refi at stabilization.
Listing history 4 events
-
2026-06-18days on market $25,000 Active 3 DOM
-
2026-06-17days on market $25,000 Active 2 DOM
-
2026-06-15remarks 245-char remark
-
2026-06-15$25,000 Active 1 DOM
ⓘ Source: listings_history table (triggers on properties + properties_extension) + one-shot
backfill from property_details.listing_events for pre-trigger history.
Tax reassessment forecast KY · Resets to sale price
- Current annual tax
- $71 · $6/mo
- Projected year-2 tax
- $215 · $18/mo
- Expected delta
- +$144/yr (+$12/mo · 202.3%)
ⓘ Screening estimate from a state-policy table — verify with the county assessor before closing.
Climate risk First Street
- Flood 1/10 Low FEMA zone X (unshaded) · 0% chance over 30 yrs
- Wildfire 3/10 Moderate
- Heat 4/10 Moderate 7 d/yr ≥102°F today · 20 d/yr by 30 yrs out
- Wind 2/10 Low 3% chance of damaging wind over 30 yrs
- Air quality 2/10 Low 0 unhealthy d/yr today · 1 by 30 yrs out
Nearby sold comps map
Loading sold comps map…
Walkable amenities ~0.75 mi
Loading nearby amenities…
Taxation est. · year 1
- Rental income
- $11,773
- − Mortgage interest
- −$1,400
- − Property taxes
- −$71
- − Insurance
- −$125
- − Repairs & maintenance
- −$942
- − Management
- −$942
- − Depreciation
- −$727
- Taxable income
- $7,565
- Est. tax owed @ 24.0%
- −$1,816
- After-tax cash flow
- $5,715/yr
For passive investors: Depreciation is non-cash, so a rental often shows a tax loss while cash-flowing — sheltering income. Rental losses are passive: they offset passive income freely, and up to $25,000/yr can offset ordinary (W-2) income if you actively participate and your MAGI is under $100k (phasing out to $0 by $150k); unused losses carry forward. On sale, claimed depreciation is recaptured at up to 25%, and gains may owe capital-gains tax (a 1031 exchange can defer both). Figures are a year-1 estimate at your 24.0% rate — not tax advice; consult a CPA.
Schools (NCES district)
- District
- Nicholas County
- NCES district ID
- 2104470
- Math proficiency
- 22% ▼ -22.00%
- Reading proficiency
- 32% ▼ -17.00%
- Median HH income
- $39,178
- Composite
- 22.65/100
- National rank
- #8056
- State rank
- #132 of 165 in KY
Livability — Carlisle
- Score
- 62/100
- State rank
- #349
- US rank
- #16526
Category grades
Schools grade is shown separately in the Schools card above.
Census & demographics
- Census place
- Carlisle, KY
- Population (ZIP)
- 7,676
Population outlook (Nicholas County) Hauer SSP2
- Today (2025)
- 6,953 people
- By 2030
- 6,815 · -2.0%
- By 2040
- 6,489 · -6.7%
- By 2050
- 6,119 · -12.0%
- By 2075
- 5,449 · -21.6%
- By 2100
- 4,901 · -29.5%
Race, ethnicity, and origin ACS 2023
- Neighborhood character
- Predominantly White (96%)
- Race & ethnicity
- White 96% Two or more races 2% Hispanic / Latino 1%
- Common ancestry
- Iranian 2% Lithuanian 2% Slovak 1%
- Foreign-born
- 0% · Canada
- Languages at home
- 99% English-only · Spanish 1% German/W. Germanic 1%
Political lean MEDSL · Nicholas
- 2024 margin
- Solid R (+49.0) · D 24.8% · R 73.8% · Other 1.3%
- 2008→2024 swing
- -36.8pp toward R · 2008: -12.2pp · 2024: -49.0pp
- All cycles
- 2024: R+49.0 2020: R+42.8 2016: R+41.2 2012: R+24.6 2008: R+12.2
Not yet ingested
- Civics
- —
Market trends
- HPI YoY
- ▲ 16.72%
- Current HPI
- 282.0093
- Rent YoY
- —
- Metro
- —
- State GDP YoY
- ▲ 1.81%
- F500 in state
- 4
Industry mix (Fortune 500 HQ in KY)
| Industry | F500 HQs | Revenue |
|---|---|---|
| Healthcare | 1 | $118B |
|
||
| Food / Beverage | 1 | $7B |
|
||
Price history
+163.2% since first listed2 events — show timeline
- 2026-06-15 Listed $25,000 ImagineMLS
- 2001-09-01 Sold (Public Records) $9,500 Public Records
Property tax history
-0.1%/yrLatest (2025): $71 · -1.0% YoY. Source: county tax records.
Cash-flow waterfall
monthlySold comps — $/sqft
last 12 mo · ≤1 miLoading sold comps…