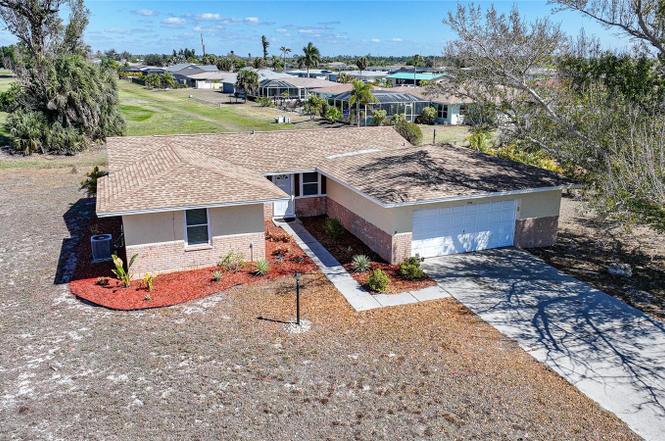
60 Rotonda Cir · Rotonda, FL
Flood risk No data
- FEMA flood zone
- —
- Chance of flooding over 30 yrs
- —
- Est. flood insurance / yr
- —
Fire risk No data
- Est. fire insurance / yr
- —
Heat risk No data
- Hot days now (above threshold)
- —
- Hot days in 30 yrs
- —
Wind risk No data
- Chance of severe wind over 30 yrs
- —
Air-quality risk No data
- Unhealthy air days now
- —
- Unhealthy air days in 30 yrs
- —
Risk factors via First Street. Map © Google.
Why this score? — see what drove the C- grade
The composite is a weighted blend of 9 inputs, each scored 0–100. Each bar is that input's sub-score; the figure is the points it added to the 100-point composite (weight × sub-score).
- Cash flow +16.3/30.0
- ARV discount +6.1/15.0
- Appreciation +5.6/10.0
- DSCR +5.1/10.0
- Schools +4.6/10.0
- 1% rule +4.4/10.0
- Livability +3.4/5.0
- Condition / age +2.5/5.0
- Rent growth +2.4/5.0
$246,500
🖨 Deal sheet 📄 Offer letter ✓ Due diligence
Listing remarks
One or more photo(s) has been virtually staged. Welcome to your next chapter in Rotonda West's PREMIER GOLFING COMMUNITY! This 3-bedroom, 2-bathroom home with a two-car garage sits on over a QUARTER ACRE with direct golf course views, offering an unbeatable combination of location, lifestyle, and value. Step inside to discover recently updated luxury vinyl plank in the living/dining areas and tile flooring throughout the rest of the home, complemented by modern recessed lighting. The bright, open kitchen features generous cabinet space and flows seamlessly into the dining area—perfect for daily living and entertaining. The spacious living room opens to an expansive backyard with room
Key facts
- Luxury vinyl plank
- Newer roof
- Expansive backyard
Tags
Property features AI
Finance
- Other: Unfurnished; Pets allowed
- HOA & community: Has HOA (annual fee $190; approx. $15.83/month); Association amenities include clubhouse, golf, tennis courts, pickleball courts, playground, trails, park, deed restrictions, and golf cart-friendly community
Exterior
- Parking: Attached garage with 2 parking spaces
- Utilities: Public water; Public sewer; Broadband/high-speed internet available; Cable available; Electricity connected; Water connected; Sewer connected
- Home design: Single family residence; One-story; Faces west
- Construction: Block construction; Shingle roof; Block and slab foundation; Built on a 0.33-acre lot (approx. 1/4 to less than 1/2 acre)
- Exterior features: Hurricane shutters; Private mailbox; Greenbelt; Landscaped yard; Near golf course; Paved lot/driveway; Mature landscaping
Interior
- Kitchen: Dishwasher; Disposal; Microwave; Range; Refrigerator; Electric water heater
- Bedrooms: 3 bedrooms
- Flooring: Ceramic tile
- Bathrooms: 2 full bathrooms
- Heating & cooling: Central heating (electric); Central air conditioning
- Interior features: Dishwasher; Disposal; Electric water heater; Microwave; Range; Refrigerator; Ceramic tile flooring
- Laundry & utility: Washer hookup; Electric dryer hookup; Laundry area in garage
Neighborhood map
What this means for you Summary
Snapshot
- This is a 3-bed/2.0-bath single-family listed at $246k.
Deal economics
- At list price, monthly cash flow is $137 ($2k/yr) — positive.
- The deal already cash-flows at list — no discount required.
- To meet the 1% rule (rent ≥ 1% of price), the offer needs to be $232k (5.7% below list).
- Recommended offer: $217k (12.0% below list) — sets the bar for market timing.
- Cap rate 7.0% vs local median 3.1% in Rotonda — top-decile yield for the area; either an underpriced asset or a hidden risk that comps aren't pricing in. Stress-test before assuming the spread holds.
Location & tenants
- Location reads 67/100 on livability (#548 in FL) — a middle-class / working-renter tenant base. Strengths: crime A+, housing A-, cost of living B+; Watch: amenities F, commute F, health & safety D-.
- Charlotte (suburban): math 54% / reading 54% proficiency, ranked #22 of 73 in FL (top 30%) — acceptable for families but not a draw, mixed tenant base, ~2y average lease.
- Zoned schools: Vineland Elementary School (math 74% / reading 67%, grade A-, #333 of 2,144 statewide, top 16%, 579 students, 45% FRL); Lemon Bay High School (math 50% / reading 56%, grade C-, #148 of 667 statewide, top 23%, 1,360 students, 28% FRL) — zoned schools average 37% FRL vs 54% district-wide (17 pts lower); this property's tenant base skews higher-income than the district average.
- Market conditions: Rents soft (-0.2%/yr); 863 active listings in the ZIP; 21 comparable units currently listed for rent nearby; rentals at typical pace (median 22d on market — plan ~3-4 weeks tenant-placement turnaround); solid renter incomes; 4,585 units permitted in Charlotte County in 2024 (703 in 5+ unit buildings).
- This rent runs 35% of the median local income ($80k/yr) — at the standard rent-burdened threshold; future hikes will face affordability resistance.
Forward outlook
- In year one you build about $5k of equity ($2k loan paydown + $3k appreciation (1.2% local appreciation)).
- Charlotte County population projected at +24% by 2050 — long-run rental-demand tailwind backs the buy-and-hold thesis.
- By year 7, paydown + projected appreciation supports a ~$32k cash-out refi (75% LTV) — recoverable capital for the next deal without selling this one.
Negotiation context
- It's been on market 121 days — a 12% lower offer ($217k) is reasonable based on typical stale-listing flexibility.
- 5 sale attempts since 2y ago with the ask held roughly flat each time — persistent listings suggest the price (not the market) is what's stuck; bring a comps-based counter.
- Current owner paid $50k; list at $246k implies a 394% gain — meaningful room to come down on a strong offer.
Questions for the listing agent
- It's been on market 121 days. Have you received any prior offers? Is the seller open to a 12% concession, seller financing, or rate buy-down credit?
- What does the HOA fee cover, when was the last increase, and are there any pending special assessments or reserve-fund shortfalls?
- Why hasn't it sold? Are there any deal-killer items the seller is aware of (foundation, flood, title, zoning, code violations)?
- Is there a deadline driving the sale (1031 exchange, divorce, estate, relocation)? That informs how much negotiation room exists.
- Schools are D-rated, which usually means shorter tenancies and higher turnover. Who's the typical renter profile here, and what's been the actual vacancy rate?
- What's the average days-on-market for RENTAL listings here right now (not sales)? A rising rental-DOM trend means longer vacancies and softer asking-rent achievability than the comps imply.
- What's the recent tenant-quality profile in this submarket — average credit score on applications, eviction rate, late-payment / NSF rate, and stable-employment percentage? A property-management company in the area should have these aggregated.
- How much new for-sale + rental construction is in the pipeline within 1–3 miles? Heavy new supply typically softens prices + rents 12–24 months out; constrained supply supports both.
Investment metrics
- 1% rule
- 0.94% ✗
- Cap rate
- 6.96%
- Cash-on-cash
- 2.39%
- DSCR
- 1.11
- GRM
- 8.8
CMA / ARV
- ARV (on-the-fly)
- $238,814
- Comps found
- 5
Show comp detail 5 sales within ~0.75 mi
| Address | Dist | Beds/Ba | Sqft | Sold | Price | $/sf | Match |
|---|---|---|---|---|---|---|---|
| 183 Mariner Ln | 0.48mi | 3/2.0 | 1,271 (+3%) | 3mo | $259,500 | $204 | 70 |
| 192 Annapolis Ln | 0.49mi | 2/2.0 (-1) | 1,270 (+3%) | 1mo | $140,000 | $110 | 66 |
| 159 Annapolis Ln | 0.30mi | 2/2.0 (-1) | 1,298 (+5%) | 18mo | $175,000 | $135 | 57 |
| 149 Caddy Rd | 0.41mi | 3/2.0 | 1,284 (+4%) | 23mo | $290,000 | $226 | 54 |
| 193 Caddy Rd | 0.69mi | 3/2.0 | 1,270 (+3%) | 23mo | $247,000 | $194 | 44 |
Match score weights: distance 35% · size 25% · config 20% · recency 20%. Top-matched comps best support the ARV.
Projected returns pro-forma
1.25% appreciation · 0.0% rent growth · sell at horizon
- IRR
- 2.8%
- Equity multiple
- 1.14×
- Total profit
- $9,609
- Equity at exit
- $87,374
- IRR
- 5.3%
- Equity multiple
- 1.63×
- Total profit
- $43,499
- Equity at exit
- $118,645
Cash invested: $69,020 (down + closing). Projections, not guarantees.
Landlord ↔ Tenant lean methodology
- Overall (STATE)
- 87 Strongly Landlord-Friendly
- State Florida
- 87 Strongly Landlord-Friendly · R+3
- County
- — inherits STATE
- City
- — inherits STATE
ZIP-level market 33947
- Home prices YoY
- 0.4%
- Rents YoY
- -0.2%
- Active inventory
- 863
- Price-to-rent
- 8.8×
Monthly cashflow live
- Estimated rent
- $2,324 high interval (Pro) →
- Mortgage (P&I)
- −$1,293
- Tax from tax record
- −$288 /mo · $3,462/yr
- Insurance
- −$103
- HOA
- −$15
- Vacancy / Maint / Mgmt
- −$488
- Net cashflow
- $137
Break-even live
UW: 25.0% down · 7.5% · 30yr · 1.5% tax · 5.0% vac · 8.0% maint · 8.0% mgmt
Financing live
Cash to close
- Down payment
- $61,625
- Closing costs
- $7,395
- Reserves months
- —
- Total cash needed
- —
Loan-product check · same deal, 3 products live
Conventional
25% down · 7.5% · 30yr
- Down + closing
- —
- Monthly P&I
- —
- Monthly cashflow
- —
- DSCR
- —
- Eligible?
- —
Personal DTI + credit; lowest rate.
DSCR
20% down · 8.5% · 30yr
- Down + closing
- —
- Monthly P&I
- —
- Monthly cashflow
- —
- DSCR
- —
- Eligible?
- —
No personal income docs; deal must DSCR.
Hard money
10% down · 12.0% · 12mo
- Down + closing
- —
- Monthly P&I
- —
- Monthly cashflow
- —
- DSCR
- —
- Eligible?
- —
Short-term bridge; refi at stabilization.
Rent comps 21 comps
| Address | Beds | Baths | Sqft | Rent | $/sqft | DOM | Units | Dist |
|---|---|---|---|---|---|---|---|---|
| 181 Bunker Rd Rotonda West, FL | 2.0 | 2.0 | 1355 | $4,600 | $3.39 | 21d | 1 | 0.50mi |
| 195 Rotonda Blvd W Unit A Rotonda West, FL | 3.0 | 2.0 | 1162 | $1,850 | $1.59 | 21d | 1 | 0.53mi |
| 199 Rotonda Blvd W Unit C Rotonda West, FL | 2.0 | 2.0 | 974 | $1,475 | $1.51 | 14d | 1 | 0.55mi |
| 87 Mark Twain Ln Rotonda West, FL | 3.0 | 2.0 | 1235 | $2,500 | $2.02 | 21d | 1 | 0.57mi |
| 98 Caddy Rd Rotonda West, FL | 2.0 | 2.0 | 1167 | $4,000 | $3.43 | 21d | 1 | 0.68mi |
| 65 Oakland Hills Pl Rotonda West, FL | 2.0 | 2.0 | 1444 | $4,500 | $3.12 | 21d | 1 | 0.82mi |
| 60 Golfview Rd Rotonda West, FL | 3.0 | 2.0 | 1336 | $5,550 | $4.15 | 21d | 1 | 0.98mi |
| 37 Oakland Hills Pl Rotonda West, FL | 3.0 | 2.0 | 1321 | $4,000 | $3.03 | 21d | 1 | 1.00mi |
| 284 Rotonda Blvd W Rotonda West, FL | 2.0 | 2.0 | 897 | $1,475 | $1.64 | 21d | 1 | 1.17mi |
| 260 Rotonda Blvd W Unit 2 Rotonda West, FL | 3.0 | 2.0 | 1047 | $1,500 | $1.43 | 21d | 1 | 1.21mi |
| 278 Boundary Blvd Unit B Rotonda West, FL | 2.0 | 2.0 | 1138 | $1,625 | $1.43 | 21d | 1 | 1.26mi |
| 173 Rotonda Cir Rotonda West, FL | 3.0 | 2.0 | 1350 | $3,200 | $2.37 | 21d | 1 | 1.28mi |
| 226 Boundary Blvd Rotonda West, FL | 2.0 | 2.0 | 1200 | $1,495 | $1.25 | 14d | 1 | 1.29mi |
| 289 Boundary Blvd Unit 202 Rotonda West, FL | 3.0 | 2.0 | 1168 | $1,645 | $1.41 | 21d | 1 | 1.29mi |
| 309 Boundary Blvd Unit B Rotonda West, FL | 2.0 | 2.0 | 960 | $1,450 | $1.51 | 21d | 1 | 1.30mi |
| 146 Boundary Blvd Unit B101 Rotonda West, FL | 2.0 | 2.0 | 815 | $1,400 | $1.72 | 21d | 1 | 1.37mi |
| 260 Rotonda Blvd E Unit B Rotonda West, FL | 3.0 | 2.0 | 1047 | $1,500 | $1.43 | 21d | 1 | 1.43mi |
| 113 Boundary Blvd Unit B 1 Rotonda West, FL | 3.0 | 2.0 | 1325 | $1,695 | $1.28 | 21d | 1 | 1.45mi |
| 113 Boundary Blvd #2 Rotonda West, FL | 3.0 | 2.0 | 1323 | $1,625 | $1.23 | 14d | 1 | 1.45mi |
| 93 Boundary Blvd #303 Rotonda West, FL | 2.0 | 2.0 | 1228 | $2,800 | $2.28 | 14d | 1 | 1.48mi |
| 100 Rotonda Lakes Cir Rotonda West, FL | 1.0–3.0 | 1.0–2.0 | 1024 | $1,232 | $1.20 | 14d | 1 | 1.50mi |
HOA detail
- Monthly dues
- $15 · $180/yr
Listing history 30 events
-
2026-06-18days on market $246,500 Active 121 DOM
-
2026-06-17days on market $246,500 Active 120 DOM
-
2026-06-16days on market $246,500 Active 119 DOM
-
2026-06-15days on market $246,500 Active 118 DOM
-
2026-06-14days on market $246,500 Active 116 DOM
-
2026-06-13days on market $246,500 Active 115 DOM
-
2026-06-10days on market $246,500 Active 113 DOM
-
2026-06-09days on market $246,500 Active 112 DOM
-
2026-06-08days on market $246,500 Active 111 DOM
-
2026-06-07days on market $246,500 Active 110 DOM
-
2026-06-05days on market $246,500 Active 107 DOM
-
2026-06-03days on market $246,500 Active 106 DOM
-
2026-06-03price $246,500 Active 105 DOM
-
2026-06-02days on market $249,500 Active 105 DOM
-
2026-06-01days on market $249,500 Active 104 DOM
-
2026-05-31days on market $249,500 Active 103 DOM
-
2026-05-30days on market $249,500 Active 102 DOM
-
2026-02-17$249,500 Active
-
2024-04-06historical $1,695
-
2024-03-13$1,695
-
2024-03-13historical $1,895
-
2024-02-04$1,895
-
2024-02-04historical $1,895
-
2024-02-03$1,895
-
2024-01-12historical $1,895
-
2024-01-08$1,895
-
1998-10-28soldstatus $49,900
-
1998-02-03soldstatus $58,500
-
1980-04-01soldstatus $20,400
-
1980-04-01soldstatus $20,400
ⓘ Source: listings_history table (triggers on properties + properties_extension) + one-shot
backfill from property_details.listing_events for pre-trigger history.
Tax reassessment forecast FL · Resets to sale price
- Current annual tax
- $3,462 · $288/mo
- Projected year-2 tax
- $3,462 · $288/mo
- Expected delta
- $0/yr ($0/mo · 0.0%)
ⓘ Screening estimate from a state-policy table — verify with the county assessor before closing.
Nearby sold comps map
Loading sold comps map…
Walkable amenities ~0.75 mi
Loading nearby amenities…
Taxation est. · year 1
- Rental income
- $27,892
- − Mortgage interest
- −$13,808
- − Property taxes
- −$3,462
- − Insurance
- −$1,232
- − Repairs & maintenance
- −$2,231
- − Management
- −$2,231
- − HOA
- −$180
- − Depreciation
- −$7,171
- Taxable loss
- −$2,424
- Est. tax savings @ 24.0%
- +$582
- After-tax cash flow
- $2,230/yr
For passive investors: Depreciation is non-cash, so a rental often shows a tax loss while cash-flowing — sheltering income. Rental losses are passive: they offset passive income freely, and up to $25,000/yr can offset ordinary (W-2) income if you actively participate and your MAGI is under $100k (phasing out to $0 by $150k); unused losses carry forward. On sale, claimed depreciation is recaptured at up to 25%, and gains may owe capital-gains tax (a 1031 exchange can defer both). Figures are a year-1 estimate at your 24.0% rate — not tax advice; consult a CPA.
Schools (NCES district)
- District
- Charlotte
- NCES district ID
- 1200240
- Math proficiency
- 54% ▼ -6.00%
- Reading proficiency
- 54% ▼ -1.00%
- Median HH income
- $44,864
- Composite
- 45.62/100
- National rank
- #2586
- State rank
- #22 of 73 in FL
Livability — Rotonda
- Score
- 67/100
- State rank
- #548
- US rank
- #10359
Category grades
Schools grade is shown separately in the Schools card above.
Census & demographics
- Census place
- Rotonda, FL
- County
- Charlotte County · 196,994 people
- City population
- 10,490
- Metro
- Punta Gorda, FL
- Population (ZIP)
- 10,447
- Household income
- $80,091
- Rent vs Own
- Severe rent burden
- 91.0
Population outlook (Charlotte County) Hauer SSP2
- Today (2025)
- 198,646 people
- By 2030
- 210,507 · +6.0%
- By 2040
- 230,857 · +16.2%
- By 2050
- 247,148 · +24.4%
- By 2075
- 281,777 · +41.8%
- By 2100
- 293,609 · +47.8%
Race, ethnicity, and origin ACS 2023
- Neighborhood character
- Predominantly White (96%)
- Race & ethnicity
- White 96% Hispanic / Latino 2% Two or more races 2%
- Common ancestry
- Romanian 5% Lithuanian 4% Slovak 4%
- Foreign-born
- 8% · Canada, Vietnam
- Languages at home
- 93% English-only · Russian/Polish/Slavic 3% Spanish 2% German/W. Germanic 1%
Political lean MEDSL · Charlotte
- 2024 margin
- Solid R (+34.0) · D 32.7% · R 66.7%
- 2008→2024 swing
- -26.7pp toward R · 2008: -7.2pp · 2024: -34.0pp
- All cycles
- 2024: R+34.0 2020: R+26.6 2016: R+27.8 2012: R+14.3 2008: R+7.2
Not yet ingested
- Civics
- —
Market trends
- HPI YoY
- ▲ 1.25%
- Current HPI
- 311.3231
- Rent YoY
- ▼ -0.22%
- Metro
- Punta Gorda, FL
- State GDP YoY
- ▲ 3.28%
- F500 in state
- 36
Industry mix (Fortune 500 HQ in FL)
| Industry | F500 HQs | Revenue |
|---|---|---|
| Industrial Technology | 2 | $29B |
|
||
| Insurance | 2 | $17B |
|
||
| Retail | 1 | $60B |
|
||
| Technology Distribution | 1 | $58B |
|
||
| Homebuilding | 1 | $35B |
|
||
| Technology Manufacturing | 1 | $35B |
|
||
Price history
+1123.0% since first listed13 events — show timeline
- 2026-02-17 Listed $249,500 Stellar MLS as Distributed by MLS Grid
- 2024-04-06 Rental Removed $1,695 APPFOLIO
- 2024-03-13 Listed for Rent $1,695 APPFOLIO
- 2024-03-13 Rental Removed $1,895 APPFOLIO
- 2024-02-04 Listed for Rent $1,895 APPFOLIO
- 2024-02-04 Rental Removed $1,895 TURBOTENANT
- 2024-02-03 Listed for Rent $1,895 TURBOTENANT
- 2024-01-12 Rental Removed $1,895 TURBOTENANT
- 2024-01-08 Listed for Rent $1,895 TURBOTENANT
- 1998-10-28 Sold (Public Records) $49,900 Public Records
- 1998-02-03 Sold (Public Records) $58,500 Public Records
- 1980-04-01 Sold (Public Records) $20,400 Public Records
- 1980-04-01 Sold (Public Records) $20,400 Public Records
Property tax history
+5.7%/yrLatest (2025): $3,462 · -6.7% YoY. Source: county tax records.
Cash-flow waterfall
monthlySold comps — $/sqft
last 12 mo · ≤1 miLoading sold comps…