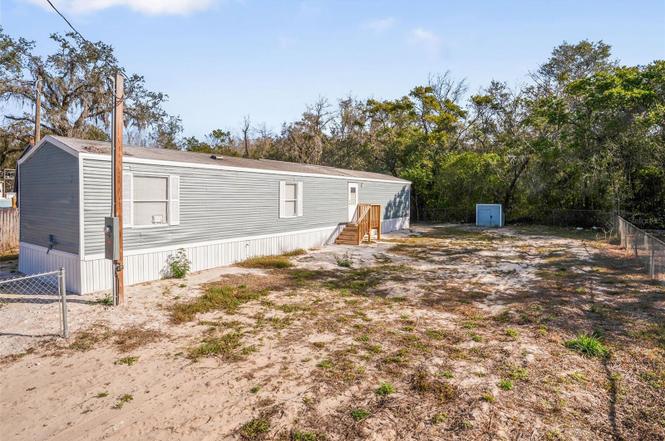
9342 Labelle St · Moon Lake, FL
Flood risk 1/10 · Minimal
- FEMA flood zone
- X (unshaded)
- Chance of flooding over 30 yrs
- 0.0%
- Est. flood insurance / yr
- $507 – $1,088
Fire risk 4/10 · Minor
- Est. fire insurance / yr
- $947 – $1,759
Heat risk 10/10 · Severe
- Hot days now (above 108°F)
- 7 days/yr
- Hot days in 30 yrs
- 27 days/yr
Wind risk 10/10 · Severe
- Chance of severe wind over 30 yrs
- 99.0%
Air-quality risk 2/10 · Minimal
- Unhealthy air days now
- 1 days/yr
- Unhealthy air days in 30 yrs
- 3 days/yr
Risk factors via First Street. Map © Google.
Why this score? — see what drove the C- grade
The composite is a weighted blend of 9 inputs, each scored 0–100. Each bar is that input's sub-score; the figure is the points it added to the 100-point composite (weight × sub-score).
- Cash flow +20.5/30.0
- ARV discount +7.5/15.0
- DSCR +6.5/10.0
- 1% rule +5.4/10.0
- Schools +4.3/10.0
- Livability +2.8/5.0
- Condition / age +2.5/5.0
- Rent growth +2.0/5.0
- Appreciation +0.0/10.0
$159,900
🖨 Deal sheet 📄 Offer letter ✓ Due diligence
Listing remarks
Escape the hustle and bustle and embrace peace and tranquility with this beautiful 2 bed 2 bath property, perfect for those seeking a serene, nature-filled lifestyle. Open concept with a split floor plan will give ample room for creativity in this blank slate making this home yours. No HOA, no CDD fees, and no flood insurance required! Situated in a prime location, you're close enough to city amenities while enjoying the peace of a countryside setting. Whether you're looking for a primary location or buying and holding, this is your opportunity to own your own slice of paradise.
Key facts
- 7,701 sq ft lot
- Built 1996
- Listed 133 days
Property features AI
Finance
- Other: Lot about 0.18 acres (0 to less than 1/4 acre)
- HOA & community: No association listed; No association approval required
Exterior
- Utilities: Well water; Septic tank; Public utilities available
- Home design: Manufactured home (single wide); One level; Faces west; Residential property
- Construction: Vinyl siding; Shingle roof; Crawlspace foundation; Built as a manufactured home
- Exterior features: Private mailbox; Dirt road access
Interior
- Kitchen: Cooktop; Refrigerator
- Bedrooms: 2 bedrooms
- Flooring: Vinyl flooring
- Bathrooms: 2 full bathrooms
- Heating & cooling: Central heating; Central air conditioning
- Interior features: Open floorplan; Living room/dining room combo
- Laundry & utility: Laundry inside
Neighborhood map
What this means for you Summary
Snapshot
- This is a 2-bed/2.0-bath land listed at $160k.
Deal economics
- At list price, monthly cash flow is $210 ($3k/yr) — positive.
- The deal already cash-flows at list — no discount required.
- Meets the 1% rule at list price ($2k rent vs $160k).
- Recommended offer: $141k (12.0% below list) — sets the bar for market timing.
- Cap rate 7.9% vs local median 4.4% in Moon Lake — top-decile yield for the area; either an underpriced asset or a hidden risk that comps aren't pricing in. Stress-test before assuming the spread holds.
Location & tenants
- Location reads 56/100 on livability (#871 in FL) — a working-class tenant base; expect higher turnover. Strengths: cost of living A+, housing A+; Watch: schools F, amenities F, commute F.
- Pasco (suburban): math 50% / reading 52% proficiency, ranked #32 of 73 in FL (top 44%) — acceptable for families but not a draw, mixed tenant base, ~2y average lease.
- Market conditions: Rents soft (-1.9%/yr); 353 active listings in the ZIP; 4 comparable units currently listed for rent nearby; rentals at typical pace (median 22d on market — plan ~3-4 weeks tenant-placement turnaround); 6,765 units permitted in Pasco County in 2024 (1,250 in 5+ unit buildings).
Forward outlook
- Local home prices are declining (-3.0%/yr); year-one equity from $1k of loan paydown is wiped out by about $5k of value loss. Plan a longer hold.
- Pasco County population projected at +29% by 2050 — long-run rental-demand tailwind backs the buy-and-hold thesis.
Negotiation context
- It's been on market 133 days — a 12% lower offer ($141k) is reasonable based on typical stale-listing flexibility.
- 2 sale attempts since 2y ago; this cycle's ask has dropped $20k (11%) from the opening price — seller is motivated, your offer sets the floor, not the list.
Risks & watch-outs
- Climate carrying-cost: severe wind risk, 99% chance of damaging wind over 30y; extreme-heat days projected 7→27/yr by 2055 (HVAC capex compounding) — expect insurance premiums to compound above CPI over the hold.
Questions for the listing agent
- It's been on market 133 days. Have you received any prior offers? Is the seller open to a 12% concession, seller financing, or rate buy-down credit?
- Why hasn't it sold? Are there any deal-killer items the seller is aware of (foundation, flood, title, zoning, code violations)?
- Is there a deadline driving the sale (1031 exchange, divorce, estate, relocation)? That informs how much negotiation room exists.
- Schools are F-rated, which usually means shorter tenancies and higher turnover. Who's the typical renter profile here, and what's been the actual vacancy rate?
- What's the average days-on-market for RENTAL listings here right now (not sales)? A rising rental-DOM trend means longer vacancies and softer asking-rent achievability than the comps imply.
- What's the recent tenant-quality profile in this submarket — average credit score on applications, eviction rate, late-payment / NSF rate, and stable-employment percentage? A property-management company in the area should have these aggregated.
- How much new for-sale + rental construction is in the pipeline within 1–3 miles? Heavy new supply typically softens prices + rents 12–24 months out; constrained supply supports both.
Investment metrics
- 1% rule
- 1.04% ✓
- Cap rate
- 7.87%
- Cash-on-cash
- 5.64%
- DSCR
- 1.25
- GRM
- 8.0
CMA / ARV
No comps found within radius.
Projected returns pro-forma
-3.0% appreciation · 0.0% rent growth · sell at horizon
- IRR
- -11.0%
- Equity multiple
- 0.61×
- Total profit
- $-17,366
- Equity at exit
- $23,842
- IRR
- -6.7%
- Equity multiple
- 0.63×
- Total profit
- $-16,623
- Equity at exit
- $13,825
Cash invested: $44,772 (down + closing). Projections, not guarantees.
Landlord ↔ Tenant lean methodology
- Overall (STATE)
- 87 Strongly Landlord-Friendly
- State Florida
- 87 Strongly Landlord-Friendly · R+3
- County
- — inherits STATE
- City
- — inherits STATE
ZIP-level market 34654
- Home prices YoY
- -12.7%
- Rents YoY
- -1.9%
- Active inventory
- 353
- Price-to-rent
- 8.0×
Monthly cashflow live
- Estimated rent
- $1,665 medium interval (Pro) →
- Mortgage (P&I)
- −$839
- Tax est. 1.5%
- −$200 /mo · $2,398/yr
- Insurance
- −$67
- HOA
- −$0
- Vacancy / Maint / Mgmt
- −$350
- Net cashflow
- $210
Break-even live
UW: 25.0% down · 7.5% · 30yr · 1.5% tax · 5.0% vac · 8.0% maint · 8.0% mgmt
Financing live
Cash to close
- Down payment
- $39,975
- Closing costs
- $4,797
- Reserves months
- —
- Total cash needed
- —
Loan-product check · same deal, 3 products live
Conventional
25% down · 7.5% · 30yr
- Down + closing
- —
- Monthly P&I
- —
- Monthly cashflow
- —
- DSCR
- —
- Eligible?
- —
Personal DTI + credit; lowest rate.
DSCR
20% down · 8.5% · 30yr
- Down + closing
- —
- Monthly P&I
- —
- Monthly cashflow
- —
- DSCR
- —
- Eligible?
- —
No personal income docs; deal must DSCR.
Hard money
10% down · 12.0% · 12mo
- Down + closing
- —
- Monthly P&I
- —
- Monthly cashflow
- —
- DSCR
- —
- Eligible?
- —
Short-term bridge; refi at stabilization.
Rent comps 4 comps
| Address | Beds | Baths | Sqft | Rent | $/sqft | DOM | Units | Dist |
|---|---|---|---|---|---|---|---|---|
| 9251 Adler St New Port Richey, FL | 2.0 | 1.0 | 1006 | $1,450 | $1.44 | 24d | 1 | 0.16mi |
| 12741 Poppy St New Port Richey, FL | 3.0 | 2.0 | 1100 | $1,800 | $1.64 | 22d | 1 | 1.03mi |
| 13015 Midvale Ave New Port Richey, FL | 2.0 | 2.0 | 900 | $1,450 | $1.61 | 5d | 1 | 1.16mi |
| 11691 Buchner Dr New Port Richey, FL | 1.0–2.0 | 1.0–2.0 | 993 | $2,085 | $2.10 | 2d | 66 | 1.25mi |
Listing history 18 events
-
2026-06-18days on market $159,900 Active 133 DOM
-
2026-06-17days on market $159,900 Active 132 DOM
-
2026-06-16days on market $159,900 Active 131 DOM
-
2026-06-15days on market $159,900 Active 130 DOM
-
2026-06-13days on market $159,900 Active 128 DOM
-
2026-06-09days on market $159,900 Active 124 DOM
-
2026-06-08days on market $159,900 Active 123 DOM
-
2026-06-07days on market $159,900 Active 122 DOM
-
2026-06-04days on market $159,900 Active 119 DOM
-
2026-06-03days on market $159,900 Active 118 DOM
-
2026-06-02days on market $159,900 Active 117 DOM
-
2026-06-01days on market $159,900 Active 116 DOM
-
2026-05-31days on market $159,900 Active 115 DOM
-
2026-04-21price $159,900
-
2026-03-25price $170,000
-
2026-02-05$179,900 Active
-
2025-08-12historical
-
2024-11-14$39,900 Active
ⓘ Source: listings_history table (triggers on properties + properties_extension) + one-shot
backfill from property_details.listing_events for pre-trigger history.
Climate risk First Street
- Flood 1/10 Low FEMA zone X (unshaded) · 0% chance over 30 yrs
- Wildfire 4/10 Moderate
- Heat 10/10 Extreme 7 d/yr ≥108°F today · 27 d/yr by 30 yrs out
- Wind 10/10 Extreme 99% chance of damaging wind over 30 yrs
- Air quality 2/10 Low 1 unhealthy d/yr today · 3 by 30 yrs out
Nearby sold comps map
Loading sold comps map…
Walkable amenities ~0.75 mi
Loading nearby amenities…
Taxation est. · year 1
- Rental income
- $19,981
- − Mortgage interest
- −$8,957
- − Property taxes
- −$2,398
- − Insurance
- −$800
- − Repairs & maintenance
- −$1,598
- − Management
- −$1,598
- − Depreciation
- −$4,652
- Taxable loss
- −$22
- Est. tax savings @ 24.0%
- +$5
- After-tax cash flow
- $2,530/yr
For passive investors: Depreciation is non-cash, so a rental often shows a tax loss while cash-flowing — sheltering income. Rental losses are passive: they offset passive income freely, and up to $25,000/yr can offset ordinary (W-2) income if you actively participate and your MAGI is under $100k (phasing out to $0 by $150k); unused losses carry forward. On sale, claimed depreciation is recaptured at up to 25%, and gains may owe capital-gains tax (a 1031 exchange can defer both). Figures are a year-1 estimate at your 24.0% rate — not tax advice; consult a CPA.
Schools (NCES district)
- District
- Pasco
- NCES district ID
- 1201530
- Math proficiency
- 50% ▼ -10.00%
- Reading proficiency
- 52% ▼ -5.00%
- Median HH income
- $45,039
- Composite
- 43.14/100
- National rank
- #3074
- State rank
- #32 of 73 in FL
Livability — Moon Lake
- Score
- 56/100
- State rank
- #871
- US rank
- #22850
Category grades
Schools grade is shown separately in the Schools card above.
Census & demographics
- Census place
- Moon Lake, FL
- County
- Pasco County · 524,098 people
- Metro
- Tampa-St. Petersburg-Clearwater, FL
- Population (ZIP)
- 24,355
- Household income
- $73,947
- Rent vs Own
- Severe rent burden
- 179.0
Population outlook (Pasco County) Hauer SSP2
- Today (2025)
- 570,045 people
- By 2030
- 605,844 · +6.3%
- By 2040
- 674,806 · +18.4%
- By 2050
- 736,022 · +29.1%
- By 2075
- 862,900 · +51.4%
- By 2100
- 906,364 · +59.0%
Race, ethnicity, and origin ACS 2023
- Neighborhood character
- Predominantly White (81%)
- Race & ethnicity
- White 81% Hispanic / Latino 10% Two or more races 7% Black 3% Asian 2%
- Hispanic origin (detail)
- Puerto Rican 6%
- Common ancestry
- Romanian 4% Slovak 2% Italian 2%
- Foreign-born
- 7% · Canada, China, Jamaica
- Languages at home
- 88% English-only · Spanish 5% Russian/Polish/Slavic 2% Other Indo-European 1%
Political lean MEDSL · Pasco
- 2024 margin
- Strong R (+25.2) · D 36.9% · R 62.1% · Other 1.0%
- 2008→2024 swing
- -21.6pp toward R · 2008: -3.6pp · 2024: -25.2pp
- All cycles
- 2024: R+25.2 2020: R+20.1 2016: R+21.6 2012: R+6.7 2008: R+3.6
Not yet ingested
- Civics
- —
Market trends
- HPI YoY
- ▼ -42.63%
- Current HPI
- 294.4358
- Rent YoY
- ▼ -1.85%
- Metro
- Tampa-St. Petersburg-Clearwater, FL
- State GDP YoY
- ▲ 3.28%
- F500 in state
- 36
Industry mix (Fortune 500 HQ in FL)
| Industry | F500 HQs | Revenue |
|---|---|---|
| Industrial Technology | 2 | $29B |
|
||
| Insurance | 2 | $17B |
|
||
| Retail | 1 | $60B |
|
||
| Technology Distribution | 1 | $58B |
|
||
| Homebuilding | 1 | $35B |
|
||
| Technology Manufacturing | 1 | $35B |
|
||
Price history
+300.8% since first listed5 events — show timeline
- 2026-04-21 Price Changed $159,900 Stellar MLS as Distributed by MLS Grid
- 2026-03-25 Price Changed $170,000 Stellar MLS as Distributed by MLS Grid
- 2026-02-05 Listed $179,900 Stellar MLS as Distributed by MLS Grid
- 2025-08-12 Listing Removed — Stellar MLS as Distributed by MLS Grid
- 2024-11-14 Listed $39,900 Stellar MLS as Distributed by MLS Grid
Property tax history
-2.0%/yrLatest (2025): $314 · +7.1% YoY. Source: county tax records.
Cash-flow waterfall
monthlySold comps — $/sqft
last 12 mo · ≤1 miLoading sold comps…