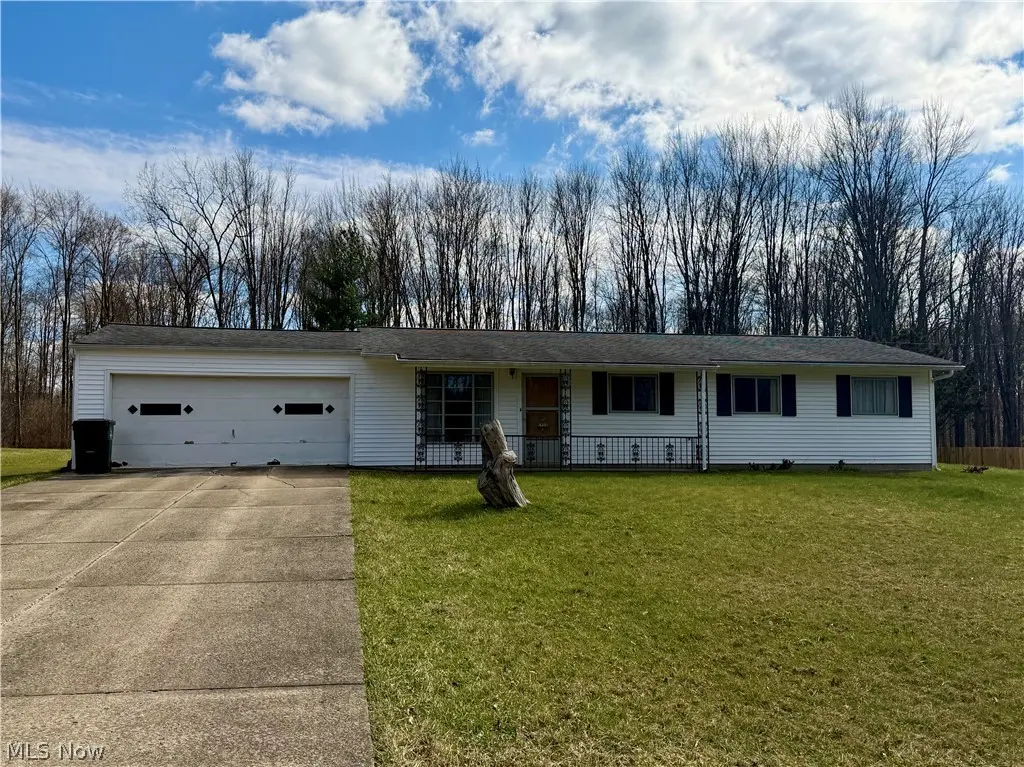
635 Sherwood Dr · Aurora, OH
Flood risk 1/10 · Minimal
- FEMA flood zone
- X (unshaded)
- Chance of flooding over 30 yrs
- 0.0%
- Est. flood insurance / yr
- $507 – $1,088
Fire risk 1/10 · Minimal
- Est. fire insurance / yr
- $713 – $1,323
Heat risk 2/10 · Minimal
- Hot days now (above 96°F)
- 7 days/yr
- Hot days in 30 yrs
- 17 days/yr
Wind risk 1/10 · Minimal
- Chance of severe wind over 30 yrs
- —
Air-quality risk 3/10 · Minor
- Unhealthy air days now
- 2 days/yr
- Unhealthy air days in 30 yrs
- 3 days/yr
Risk factors via First Street. Map © Google.
Why this score? — see what drove the B- grade
The composite is a weighted blend of 9 inputs, each scored 0–100. Each bar is that input's sub-score; the figure is the points it added to the 100-point composite (weight × sub-score).
- Cash flow +25.2/30.0
- ARV discount +10.8/15.0
- DSCR +8.3/10.0
- Schools +7.2/10.0
- 1% rule +6.1/10.0
- Livability +3.8/5.0
- Rent growth +2.5/5.0
- Condition / age +2.5/5.0
- Appreciation +0.0/10.0
$245,000
🖨 Deal sheet 📄 Offer letter ✓ Due diligence
Listing remarks MLS
One floor easy living in this 3 bedroom 2 full bath ranch on . 59 acres in Aurora School District. The spacious living room is open to the dining area. The kitchen and laundry room are located near by. The other end of the home consists of a master bedroom with master bath access from the bedroom and hallway. Plus there is another full bath with a stand up shower. No lack of storage with a walk in hallway closet and oversized bedroom closets. There is a paved double lane driveway leading to the 2 car attached garage. All appliances will stay: washer, dryer, stove, refrigerator (all maybe about 9 years old). This is an estate and will be sold AS IS. This lovely ranch home needs some updates but has been treated with respect. Possible city water at the street. There is a water hydrant in the front yard. Buyer to do their own due diligence.
Key facts
- Private backyard
- Front porch
- Wooded views
Tags
Neighborhood map
What this means for you Summary
Snapshot
- This is a 3-bed/1.5-bath single-family listed at $245k.
Deal economics
- At list price, monthly cash flow is $547 ($7k/yr) — positive.
- The deal already cash-flows at list — no discount required.
- Meets the 1% rule at list price ($3k rent vs $245k).
- Cap rate 9.0% vs local median 2.5% in Aurora — top-decile yield for the area; either an underpriced asset or a hidden risk that comps aren't pricing in. Stress-test before assuming the spread holds.
Location & tenants
- Location reads 75/100 on livability (#258 in OH, #4,104 nationally) — a middle-class / working-renter tenant base. Strengths: schools A+, crime A+, employment A+; Watch: amenities F, commute F, health & safety F.
- Aurora City (suburban): math 79% / reading 84% proficiency, ranked #35 of 656 in OH (top 5%) — strong family-tenant draw, lease renewals of 3-5y typical; only 7% free/reduced lunch — higher-income household profile.
- Market conditions: 135 active listings in the ZIP; 2 comparable units currently listed for rent nearby; high-income renter base; 196 units permitted in Portage County in 2024 (10 in 5+ unit buildings).
Forward outlook
- Local home prices are declining (-3.0%/yr); year-one equity from $2k of loan paydown is wiped out by about $7k of value loss. Plan a longer hold.
Negotiation context
- Only 5 days on market — expect competitive offers; lowballing is unlikely to land.
- 3 sale attempts since 4y ago; this cycle's ask is 9% above the opening price — seller raised mid-cycle; expect resistance to lowballs.
- Current owner paid $175k; 40% above their basis — modest negotiation headroom, anchor on the comps not their cost.
Risks & watch-outs
- Watch-outs: built in 1957 — expect roof / HVAC / electrical / plumbing capex.
Questions for the listing agent
- Built in 1957 — when were the roof, HVAC, electrical panel, plumbing, and water heater last replaced?
- Is there a deadline driving the sale (1031 exchange, divorce, estate, relocation)? That informs how much negotiation room exists.
- Schools are A-rated — typically a magnet for longer-tenancy family renters. What's the average tenant stay here, and is there a school-zone premium baked into asking?
- What's the average days-on-market for RENTAL listings here right now (not sales)? A rising rental-DOM trend means longer vacancies and softer asking-rent achievability than the comps imply.
- What's the recent tenant-quality profile in this submarket — average credit score on applications, eviction rate, late-payment / NSF rate, and stable-employment percentage? A property-management company in the area should have these aggregated.
- How much new for-sale + rental construction is in the pipeline within 1–3 miles? Heavy new supply typically softens prices + rents 12–24 months out; constrained supply supports both.
Investment metrics
- 1% rule
- 1.11% ✓
- Cap rate
- 8.97%
- Cash-on-cash
- 9.57%
- DSCR
- 1.43
- GRM
- 7.5
CMA / ARV
- ARV (on-the-fly)
- $264,420
- Comps found
- 4
Show comp detail 4 sales within ~0.75 mi
| Address | Dist | Beds/Ba | Sqft | Sold | Price | $/sf | Match |
|---|---|---|---|---|---|---|---|
| 583 Sherwood Dr | 0.09mi | 3/1.5 | 1,170 (0%) | 9mo | $265,000 | $226 | 88 |
| 499 Robinhood Dr | 0.27mi | 3/1.5 | 1,170 (0%) | 13mo | $267,000 | $228 | 76 |
| 516 Robinhood Dr | 0.27mi | 3/1.5 | 1,170 (0%) | 20mo | $255,000 | $218 | 70 |
| 473 Sherwood Dr | 0.30mi | 3/1.0 | 1,170 (0%) | 19mo | $199,000 | $170 | 68 |
Match score weights: distance 35% · size 25% · config 20% · recency 20%. Top-matched comps best support the ARV.
Projected returns pro-forma
-3.0% appreciation · 3.0% rent growth · sell at horizon
- IRR
- -1.9%
- Equity multiple
- 0.93×
- Total profit
- $-4,883
- Equity at exit
- $36,530
- IRR
- 7.8%
- Equity multiple
- 1.59×
- Total profit
- $40,541
- Equity at exit
- $21,183
Cash invested: $68,600 (down + closing). Projections, not guarantees.
Landlord ↔ Tenant lean methodology
- Overall (STATE)
- 73 Landlord-Friendly
- State Ohio
- 73 Landlord-Friendly · R+6
- County
- — inherits STATE
- City
- — inherits STATE
ZIP-level market 44202
- Active inventory
- 135
- Price-to-rent
- 7.5×
Monthly cashflow live
- Estimated rent
- $2,722 medium interval (Pro) →
- Mortgage (P&I)
- −$1,285
- Tax from tax record
- −$216 /mo · $2,597/yr
- Insurance
- −$102
- HOA
- −$0
- Vacancy / Maint / Mgmt
- −$572
- Net cashflow
- $547
Break-even live
UW: 25.0% down · 7.5% · 30yr · 1.5% tax · 5.0% vac · 8.0% maint · 8.0% mgmt
Financing live
Cash to close
- Down payment
- $61,250
- Closing costs
- $7,350
- Reserves months
- —
- Total cash needed
- —
Loan-product check · same deal, 3 products live
Conventional
25% down · 7.5% · 30yr
- Down + closing
- —
- Monthly P&I
- —
- Monthly cashflow
- —
- DSCR
- —
- Eligible?
- —
Personal DTI + credit; lowest rate.
DSCR
20% down · 8.5% · 30yr
- Down + closing
- —
- Monthly P&I
- —
- Monthly cashflow
- —
- DSCR
- —
- Eligible?
- —
No personal income docs; deal must DSCR.
Hard money
10% down · 12.0% · 12mo
- Down + closing
- —
- Monthly P&I
- —
- Monthly cashflow
- —
- DSCR
- —
- Eligible?
- —
Short-term bridge; refi at stabilization.
Rent comps 2 comps
| Address | Beds | Baths | Sqft | Rent | $/sqft | DOM | Units | Dist |
|---|---|---|---|---|---|---|---|---|
| 630 Countrywood Trl Aurora, OH | 2.0–3.0 | 2.0 | 1595 | $2,740 | $1.72 | 2d | 16 | 0.76mi |
| 226 Barrington Pl E Aurora, OH | 1.0–3.0 | 1.0–2.5 | 1169 | $2,704 | $2.31 | 2d | 16 | 1.00mi |
Listing history 4 events
-
2026-06-07statusdays on market $245,000 Pending 5 DOM
-
2026-06-03days on market $245,000 Active 4 DOM
-
2026-06-03remarks 693-char remark
-
2026-06-03$245,000 Active 3 DOM
ⓘ Source: listings_history table (triggers on properties + properties_extension) + one-shot
backfill from property_details.listing_events for pre-trigger history.
Tax reassessment forecast OH · Partial reset (capped growth)
- Current annual tax
- $2,597 · $216/mo
- Projected year-2 tax
- $3,209 · $267/mo
- Expected delta
- +$613/yr (+$51/mo · 23.6%)
ⓘ Screening estimate from a state-policy table — verify with the county assessor before closing.
Climate risk First Street
- Flood 1/10 Low FEMA zone X (unshaded) · 0% chance over 30 yrs
- Wildfire 1/10 Low
- Heat 2/10 Low 7 d/yr ≥96°F today · 17 d/yr by 30 yrs out
- Wind 1/10 Low
- Air quality 3/10 Moderate 2 unhealthy d/yr today · 3 by 30 yrs out
Nearby sold comps map
Loading sold comps map…
Walkable amenities ~0.75 mi
Loading nearby amenities…
Taxation est. · year 1
- Rental income
- $32,661
- − Mortgage interest
- −$13,724
- − Property taxes
- −$2,597
- − Insurance
- −$1,225
- − Repairs & maintenance
- −$2,613
- − Management
- −$2,613
- − Depreciation
- −$7,127
- Taxable income
- $2,762
- Est. tax owed @ 24.0%
- −$663
- After-tax cash flow
- $5,900/yr
For passive investors: Depreciation is non-cash, so a rental often shows a tax loss while cash-flowing — sheltering income. Rental losses are passive: they offset passive income freely, and up to $25,000/yr can offset ordinary (W-2) income if you actively participate and your MAGI is under $100k (phasing out to $0 by $150k); unused losses carry forward. On sale, claimed depreciation is recaptured at up to 25%, and gains may owe capital-gains tax (a 1031 exchange can defer both). Figures are a year-1 estimate at your 24.0% rate — not tax advice; consult a CPA.
Schools (NCES district)
- District
- Aurora City
- NCES district ID
- 3904917
- Math proficiency
- 79% ▼ -7.00%
- Reading proficiency
- 84% ▼ -5.00%
- Median HH income
- $81,791
- Composite
- 71.93/100
- National rank
- #213
- State rank
- #35 of 656 in OH
Livability — Aurora
- Score
- 75/100
- State rank
- #258
- US rank
- #4104
Category grades
Schools grade is shown separately in the Schools card above.
Census & demographics
- Census place
- Aurora, OH
- County
- Portage · 165,699 people
- City population
- 22,857
- Metro
- Akron, OH
- Population (ZIP)
- 22,857
- Household income
- $116,556
- Rent vs Own
- Severe rent burden
- 4.9
Population outlook (Portage County) Hauer SSP2
- Today (2025)
- 166,109 people
- By 2030
- 167,752 · +1.0%
- By 2040
- 168,640 · +1.5%
- By 2050
- 167,469 · +0.8%
- By 2075
- 170,131 · +2.4%
- By 2100
- 167,958 · +1.1%
Race, ethnicity, and origin ACS 2023
- Neighborhood character
- Predominantly White (87%)
- Race & ethnicity
- White 87% Asian 4% Two or more races 4% Black 3%
- Common ancestry
- Romanian 9% Italian 3% Lithuanian 2%
- Foreign-born
- 6% · Canada, China, South Korea
- Languages at home
- 94% English-only · Other Indo-European 2% Other Asian/Pacific 1% Russian/Polish/Slavic 1%
Political lean MEDSL · Portage
- 2024 margin
- R (+15.5) · D 41.8% · R 57.3%
- 2008→2024 swing
- -24.5pp toward R · 2008: 9.0pp · 2024: -15.5pp
- All cycles
- 2024: R+15.5 2020: R+12.5 2016: R+10.2 2012: D+4.9 2008: D+9.0
Not yet ingested
- Civics
- —
Market trends
- HPI YoY
- ▼ -270.23%
- Current HPI
- 186.4919
- Rent YoY
- —
- Metro
- —
- State GDP YoY
- ▲ 1.98%
- F500 in state
- 48
Industry mix (Fortune 500 HQ in OH)
| Industry | F500 HQs | Revenue |
|---|---|---|
| Insurance | 3 | $145B |
|
||
| Industrial Machinery | 3 | $49B |
|
||
| Financial Services | 3 | $24B |
|
||
| Consumer Goods | 2 | $93B |
|
||
| Aerospace / Defense | 2 | $47B |
|
||
| Utilities | 2 | $33B |
|
||
Price history
+40.0% since first listed9 events — show timeline
- 2026-06-04 Pending — MLSNOW
- 2026-06-02 Relisted — MLSNOW
- 2026-03-31 Pending — MLSNOW
- 2026-03-30 Price Changed $245,000 MLSNOW
- 2026-03-27 Listed $225,000 MLSNOW
- 2022-06-10 Sold (Public Records) $195,000 Public Records
- 2022-06-10 Sold (MLS) $175,000 MLSNOW
- 2022-05-16 Pending — MLSNOW
- 2022-05-10 Listed $175,000 MLSNOW
Property tax history
+3.5%/yrLatest (2025): $2,597 · +1.8% YoY. Source: county tax records.
Cash-flow waterfall
monthlySold comps — $/sqft
last 12 mo · ≤1 miLoading sold comps…