 Duplex
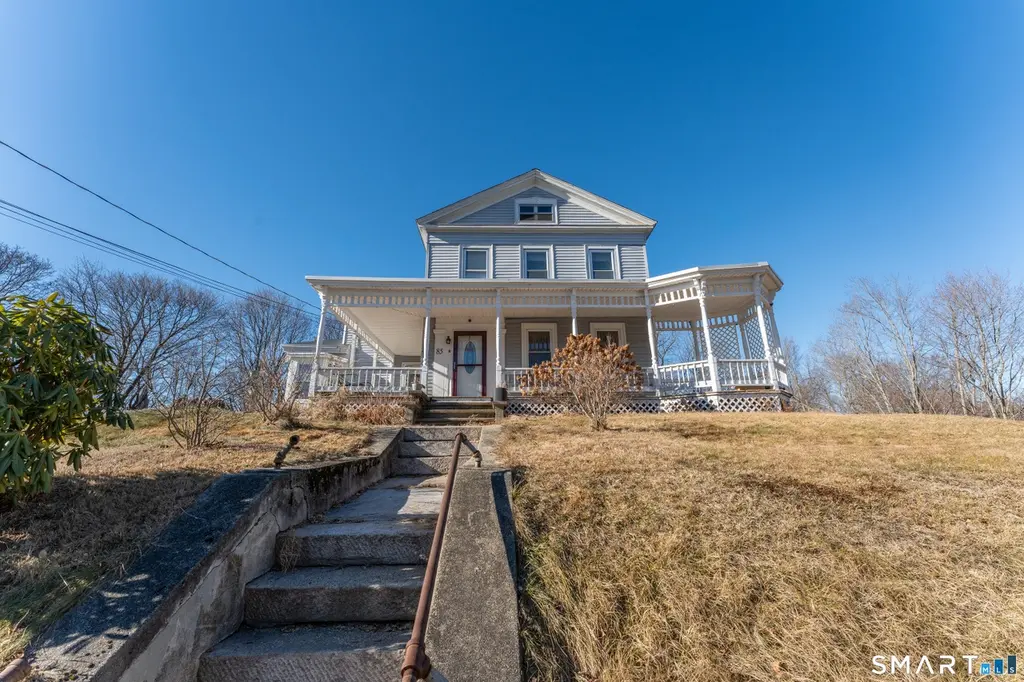
85 Furnace St · Danielson, CT
Flood risk 1/10 · Minimal
- FEMA flood zone
- X (unshaded)
- Chance of flooding over 30 yrs
- 0.0%
- Est. flood insurance / yr
- $473 – $860
Fire risk 3/10 · Minor
- Est. fire insurance / yr
- $829 – $1,539
Heat risk 4/10 · Minor
- Hot days now (above 95°F)
- 7 days/yr
- Hot days in 30 yrs
- 16 days/yr
Wind risk 6/10 · Moderate
- Chance of severe wind over 30 yrs
- 61.0%
Air-quality risk 3/10 · Minor
- Unhealthy air days now
- 2 days/yr
- Unhealthy air days in 30 yrs
- 3 days/yr
Risk factors via First Street. Map © Google.
Why this score? — see what drove the C grade
The composite is a weighted blend of 9 inputs, each scored 0–100. Each bar is that input's sub-score; the figure is the points it added to the 100-point composite (weight × sub-score).
- Cash flow +23.5/30.0
- ARV discount +8.6/15.0
- DSCR +7.6/10.0
- 1% rule +5.4/10.0
- Livability +4.2/5.0
- Schools +2.9/10.0
- Rent growth +2.5/5.0
- Condition / age +2.5/5.0
- Appreciation +0.0/10.0
$325,000
🖨 Deal sheet (PDF) 📄 Offer letter ✓ Due diligence
Multi-family units
County records classify this as Multi-Family (2-4 Unit). Listing-text estimate: 2 units. confirmed
Listing remarks MLS
2 Family in nice condition. Very nice unique interior. Spacious rooms. Large eat in kitchen in the lower level. 2 Livingrms.Realtor related
Key facts
- Nice sized yard
- Two-family property
- Conveniently located
Tags
Neighborhood map
What this means for you Summary
Snapshot
- This is a 2 × 2-bed/0.5-bath units multifamily listed at $325k.
Deal economics
- At list price, monthly cash flow is $610 ($7k/yr) — positive. Per door: $305/mo.
- The deal already cash-flows at list — no discount required.
- Meets the 1% rule at list price ($3k rent vs $325k).
Location & tenants
- Location reads 84/100 on livability (#5 in CT, #679 nationally) — a professional / high-income tenant draw. Strengths: crime A+, commute A+, housing A+; Watch: employment D, schools F.
- Killingly School District (rural): math 21% / reading 44% proficiency, ranked #119 of 153 in CT (top 78%) — families likely to look elsewhere, expect single-tenant / working-renter base with shorter leases.
- Market conditions: 61 active listings in the ZIP; 149 units permitted in Northeastern Connecticut Planning Region in 2024 (0 in 5+ unit buildings).
- At $3,385/mo this rent would consume 55% of the median local household income ($74k/yr) (locally 223% of renters already pay >50% of income on rent) — very limited rent-growth headroom before tenants either downsize or default.
Forward outlook
- Local home prices are declining (-3.0%/yr); year-one equity from $2k of loan paydown is wiped out by about $10k of value loss. Plan a longer hold.
Negotiation context
- Only 7 days on market — expect competitive offers; lowballing is unlikely to land.
- 11 sale attempts since 19y ago with the ask held roughly flat each time — persistent listings suggest the price (not the market) is what's stuck; bring a comps-based counter.
- Current owner paid $127k; list at $325k implies a 156% gain — meaningful room to come down on a strong offer.
Risks & watch-outs
- Watch-outs: built in 1910 — expect roof / HVAC / electrical / plumbing capex.
- Climate carrying-cost: major wind risk, 61% chance of damaging wind over 30y — expect insurance premiums to compound above CPI over the hold.
Questions for the listing agent
- Can we see the unit-by-unit rent roll, current vacancy, and any below-market leases? What's the average tenancy length?
- What capital expenditures (roof, boiler, parking lot, exteriors) have been made in the last 5 years, and what's planned in the next 2?
- Built in 1910 — when were the roof, HVAC, electrical panel, plumbing, and water heater last replaced?
- Is there a deadline driving the sale (1031 exchange, divorce, estate, relocation)? That informs how much negotiation room exists.
- Schools are F-rated, which usually means shorter tenancies and higher turnover. Who's the typical renter profile here, and what's been the actual vacancy rate?
- What's the average days-on-market for RENTAL listings here right now (not sales)? A rising rental-DOM trend means longer vacancies and softer asking-rent achievability than the comps imply.
- What's the recent tenant-quality profile in this submarket — average credit score on applications, eviction rate, late-payment / NSF rate, and stable-employment percentage? A property-management company in the area should have these aggregated.
- How much new apartment / multifamily construction is in the pipeline within 1–3 miles? Heavy new supply (>2% of stock underway) typically softens rents 12–24 months out; light construction supports rent growth.
Investment metrics
- 1% rule
- 1.04% ✓
- Cap rate
- 8.54%
- Cash-on-cash
- 8.04%
- DSCR
- 1.36
- GRM
- 8.0
CMA / ARV
- ARV (on-the-fly)
- $333,002
- Comps found
- 12
Show comp detail 12 sales within ~0.75 mi
| Address | Dist | Beds/Ba | Sqft | Sold | Price | $/sf | Match |
|---|---|---|---|---|---|---|---|
| 18 Broad St | 0.32mi | 5/3.0 | 2,560 (+1%) | 3mo | $332,500 | $130 | 81 |
| 12 Saint James Row | 0.08mi | 6/2.0 (+1) | 2,392 (-6%) | 8mo | $320,000 | $134 | 71 |
| 64 Maple St | 0.29mi | 6/3.5 (+1) | 2,536 (-0%) | 13mo | $195,050 | $77 | 69 |
| 87 Franklin St | 0.21mi | 6/2.0 (+1) | 2,590 (+2%) | 14mo | $285,000 | $110 | 67 |
| 72 Dyer St | 0.27mi | 4/2.0 (-1) | 2,424 (-5%) | 5mo | $325,000 | $134 | 66 |
| 14 Spring St | 0.39mi | 5/2.0 | 2,284 (-10%) | 1mo | $379,000 | $166 | 60 |
| 67 Mechanic St | 0.45mi | 6/2.0 (+1) | 2,410 (-5%) | 8mo | $339,000 | $141 | 55 |
| 73 Hawkins St | 0.44mi | 6/2.0 (+1) | 2,746 (+8%) | 3mo | $360,000 | $131 | 55 |
| 51 Maple St | 0.27mi | 4/4.0 (-1) | 2,908 (+14%) | 6mo | $350,000 | $120 | 49 |
| 24 Mechanic St | 0.34mi | 6/2.0 (+1) | 2,206 (-13%) | 7mo | $280,000 | $127 | 47 |
| 35 Franklin St | 0.13mi | 6/2.0 (+1) | 2,200 (-14%) | 21mo | $200,000 | $91 | 45 |
| 93 Maple St | 0.37mi | 4/2.0 (-1) | 2,308 (-9%) | 18mo | $385,000 | $167 | 44 |
Match score weights: distance 35% · size 25% · config 20% · recency 20%. Top-matched comps best support the ARV.
Projected returns pro-forma
-3.0% appreciation · 3.0% rent growth · sell at horizon
- IRR
- -4.1%
- Equity multiple
- 0.85×
- Total profit
- $-13,901
- Equity at exit
- $48,459
- IRR
- 5.6%
- Equity multiple
- 1.41×
- Total profit
- $37,641
- Equity at exit
- $28,100
Cash invested: $91,000 (down + closing). Projections, not guarantees.
Landlord ↔ Tenant lean methodology
- Overall (STATE)
- 27 Tenant-Leaning
- State Connecticut
- 27 Tenant-Leaning · D+7
- County
- — inherits STATE
- City
- — inherits STATE
ZIP-level market 06239
- Home prices YoY
- -4.8%
- Active inventory
- 61
- Price-to-rent
- 16.0×
Monthly cashflow live
- Estimated rent
- $3,385 medium interval (Pro) →
- Mortgage (P&I)
- −$1,704
- Tax from tax record
- −$225 /mo · $2,698/yr
- Insurance
- −$135
- HOA
- −$0
- Vacancy / Maint / Mgmt
- −$711
- Net cashflow
- $610
Break-even live
Sensitivity live
| Price | -10% $794 | -5% $702 | +0% $610 | +5% $518 | +10% $426 |
|---|---|---|---|---|---|
| Rent | -10% $342 | -5% $476 | +0% $610 | +5% $743 | +10% $877 |
| Rate | -1.0pp $773 | -0.5pp $692 | base $610 | +0.5pp $525 | +1.0pp $440 |
2-unit breakdown (identical units grouped — click to expand)
| Units | Beds | Baths | Est. rent |
|---|---|---|---|
| 2× units | 2 | 0.5 | $3,386 |
| #1 | 2 | 0.5 | $1,693 |
| #2 | 2 | 0.5 | $1,693 |
| Total (2 units) | $3,385 | ||
UW: 25.0% down · 7.5% · 30yr · 1.5% tax · 5.0% vac · 8.0% maint · 8.0% mgmt
Financing live
Cash to close
- Down payment
- $81,250
- Closing costs
- $9,750
- Reserves months
- —
- Total cash needed
- —
Loan-product check · same deal, 3 products live
Conventional
25% down · 7.5% · 30yr
- Down + closing
- —
- Monthly P&I
- —
- Monthly cashflow
- —
- DSCR
- —
- Eligible?
- —
Personal DTI + credit; lowest rate.
DSCR
20% down · 8.5% · 30yr
- Down + closing
- —
- Monthly P&I
- —
- Monthly cashflow
- —
- DSCR
- —
- Eligible?
- —
No personal income docs; deal must DSCR.
Hard money
10% down · 12.0% · 12mo
- Down + closing
- —
- Monthly P&I
- —
- Monthly cashflow
- —
- DSCR
- —
- Eligible?
- —
Short-term bridge; refi at stabilization.
Listing history 29 events
-
2026-06-13status $325,000 Under Contract 7 DOM
-
2026-06-10days on market $325,000 Active 7 DOM
-
2026-06-09days on market $325,000 Active 6 DOM
-
2026-06-08days on market $325,000 Active 5 DOM
-
2026-06-07days on market $325,000 Active 4 DOM
-
2026-06-03remarks 699-char remark
-
2026-06-03statusdays on market $325,000 Active 1 DOM
-
2026-04-01status Under Contract
-
2026-03-26status Active
-
2026-01-22status Under Contract
-
2026-01-18$325,000 Active
-
2012-07-16soldstatus $127,000 139-char remark
Show marketing remark (139 chars)
2 Family in nice condition. Very nice unique interior. Spacious rooms. Large eat in kitchen in the lower level. 2 Livingrms.Realtor related
-
2012-04-06$130,000 139-char remark
Show marketing remark (139 chars)
2 Family in nice condition. Very nice unique interior. Spacious rooms. Large eat in kitchen in the lower level. 2 Livingrms.Realtor related
-
2012-03-24historical
-
2011-09-24$129,900
-
2011-07-22soldstatus $55,000
-
2011-06-07$59,950
-
2011-05-15historical
-
2011-04-15$77,500
-
2010-11-06historical
-
2010-06-15$77,500
-
2010-04-16historical
-
2009-12-16$109,500
-
2008-12-31historical
-
2008-09-27$169,900
-
2008-09-21historical
-
2008-08-06$169,900
-
2008-04-15historical
-
2007-10-23$235,000
ⓘ Source: listings_history table (triggers on properties + properties_extension) + one-shot
backfill from property_details.listing_events for pre-trigger history.
Tax reassessment forecast CT · Partial reset (capped growth)
- Current annual tax
- $2,698 · $225/mo
- Projected year-2 tax
- $4,826 · $402/mo
- Expected delta
- +$2,128/yr (+$177/mo · 78.9%)
ⓘ Screening estimate from a state-policy table — verify with the county assessor before closing.
Climate risk First Street
- Flood 1/10 Low FEMA zone X (unshaded) · 0% chance over 30 yrs
- Wildfire 3/10 Moderate
- Heat 4/10 Moderate 7 d/yr ≥95°F today · 16 d/yr by 30 yrs out
- Wind 6/10 Major 61% chance of damaging wind over 30 yrs
- Air quality 3/10 Moderate 2 unhealthy d/yr today · 3 by 30 yrs out
Nearby sold comps map
Loading sold comps map…
Walkable amenities ~0.75 mi
Loading nearby amenities…
Taxation est. · year 1
- Rental income
- $40,620
- − Mortgage interest
- −$18,205
- − Property taxes
- −$2,698
- − Insurance
- −$1,625
- − Repairs & maintenance
- −$3,250
- − Management
- −$3,250
- − Depreciation
- −$9,455
- Taxable income
- $2,138
- Est. tax owed @ 24.0%
- −$513
- After-tax cash flow
- $6,802/yr
For passive investors: Depreciation is non-cash, so a rental often shows a tax loss while cash-flowing — sheltering income. Rental losses are passive: they offset passive income freely, and up to $25,000/yr can offset ordinary (W-2) income if you actively participate and your MAGI is under $100k (phasing out to $0 by $150k); unused losses carry forward. On sale, claimed depreciation is recaptured at up to 25%, and gains may owe capital-gains tax (a 1031 exchange can defer both). Figures are a year-1 estimate at your 24.0% rate — not tax advice; consult a CPA.
Schools (NCES district)
- District
- Killingly School District
- NCES district ID
- 0902070
- Math proficiency
- 21% ▼ -19.00%
- Reading proficiency
- 44% ▼ -14.00%
- Median HH income
- $55,485
- Composite
- 28.71/100
- National rank
- #6684
- State rank
- #119 of 153 in CT
Livability — Danielson
- Score
- 84/100
- State rank
- #5
- US rank
- #679
Category grades
Schools grade is shown separately in the Schools card above.
Census & demographics
- Census place
- Danielson, CT
- County
- Windham County · 30,529 people
- Metro
- Worcester, MA-CT
- Population (ZIP)
- 11,185
- Household income
- $74,267
- Rent vs Own
- Severe rent burden
- 223.0
Population outlook (Northeastern Connecticut County) Hauer SSP2
- By 2040
- 104,160
Race, ethnicity, and origin ACS 2023
- Neighborhood character
- Predominantly White (86%)
- Race & ethnicity
- White 86% Two or more races 6% Hispanic / Latino 5% Black 4% Asian 1%
- Common ancestry
- Lithuanian 14% Russian 4% Romanian 4%
- Foreign-born
- 5% · Canada, China, South Korea
- Languages at home
- 93% English-only · Spanish 3% Russian/Polish/Slavic 2% Other Indo-European 1%
Political lean MEDSL · Northeastern Connecticut
- 2024 margin
- R (+15.4) · D 41.5% · R 57.0% · Other 1.5%
- All cycles
- 2024: R+15.4
Not yet ingested
- Civics
- —
Market trends
- HPI YoY
- ▼ -11.75%
- Current HPI
- 233.1548
- Rent YoY
- —
- Metro
- Worcester, MA-CT
- State GDP YoY
- ▲ 1.06%
- F500 in state
- 38
Industry mix (Fortune 500 HQ in CT)
| Industry | F500 HQs | Revenue |
|---|---|---|
| Industrial Machinery | 4 | $38B |
|
||
| Insurance | 3 | $71B |
|
||
| Financial Services | 2 | $25B |
|
||
| Transportation / Logistics | 2 | $18B |
|
||
| Healthcare | 1 | $247B |
|
||
| Telecommunications | 1 | $55B |
|
||
Price history
+38.3% since first listed22 events — show timeline
- 2026-04-01 Pending — Smart MLS
- 2026-03-26 Relisted — Smart MLS
- 2026-01-22 Pending — Smart MLS
- 2026-01-18 Listed $325,000 Smart MLS
- 2012-07-16 Sold (MLS) $127,000 Smart MLS
- 2012-04-06 Listed $130,000 Smart MLS
- 2012-03-24 Listing Removed — Smart MLS
- 2011-09-24 Listed $129,900 Smart MLS
- 2011-07-22 Sold (MLS) $55,000 Smart MLS
- 2011-06-07 Listed $59,950 Smart MLS
- 2011-05-15 Listing Removed — Smart MLS
- 2011-04-15 Listed $77,500 Smart MLS
- 2010-11-06 Listing Removed — Smart MLS
- 2010-06-15 Listed $77,500 Smart MLS
- 2010-04-16 Listing Removed — Smart MLS
- 2009-12-16 Listed $109,500 Smart MLS
- 2008-12-31 Listing Removed — Smart MLS
- 2008-09-27 Listed $169,900 Smart MLS
- 2008-09-21 Listing Removed — Smart MLS
- 2008-08-06 Listed $169,900 Smart MLS
- 2008-04-15 Listing Removed — Smart MLS
- 2007-10-23 Listed $235,000 Smart MLS
Property tax history
-3.4%/yrLatest (2023): $2,698 · +6.3% YoY. Source: county tax records.
Cash-flow waterfall
monthlySold comps — $/sqft
last 12 mo · ≤1 miLoading sold comps…