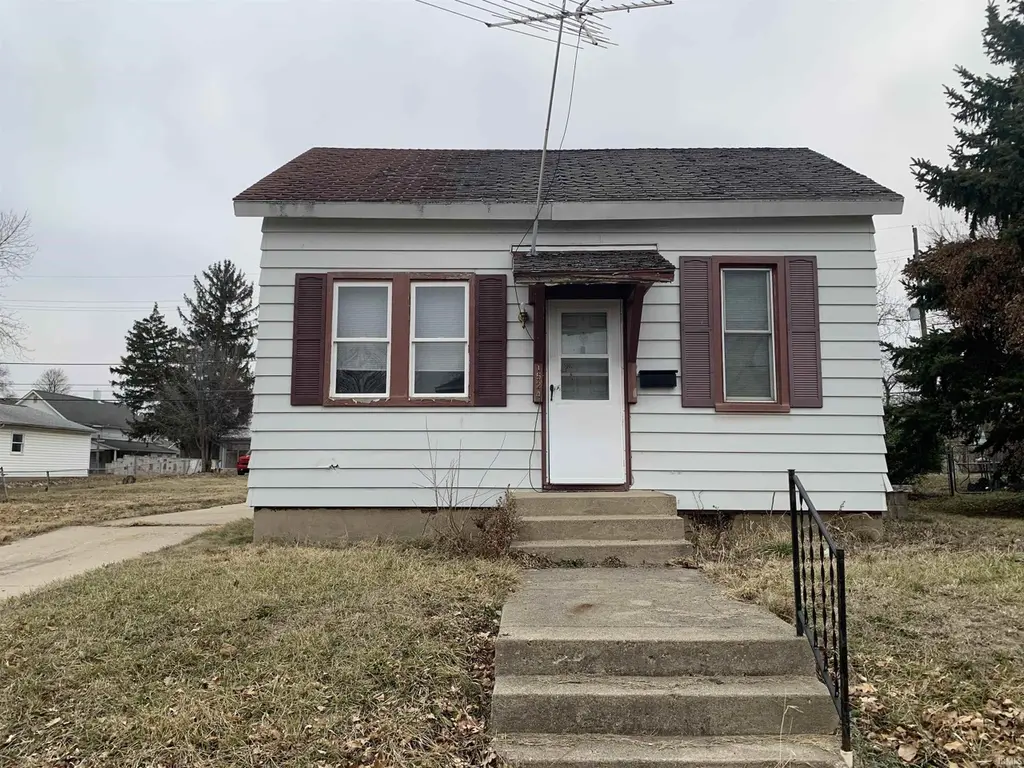
1524 Virginia St · Lafayette, IN
Flood risk 1/10 · Minimal
- FEMA flood zone
- X (unshaded)
- Chance of flooding over 30 yrs
- 0.0%
- Est. flood insurance / yr
- $473 – $860
Fire risk 1/10 · Minimal
- Est. fire insurance / yr
- $717 – $1,331
Heat risk 3/10 · Minor
- Hot days now (above 102°F)
- 7 days/yr
- Hot days in 30 yrs
- 18 days/yr
Wind risk 2/10 · Minimal
- Chance of severe wind over 30 yrs
- —
Air-quality risk 2/10 · Minimal
- Unhealthy air days now
- 1 days/yr
- Unhealthy air days in 30 yrs
- 2 days/yr
Risk factors via First Street. Map © Google.
Why this score? — see what drove the D grade
The composite is a weighted blend of 9 inputs, each scored 0–100. Each bar is that input's sub-score; the figure is the points it added to the 100-point composite (weight × sub-score).
- ARV discount +13.6/15.0
- Cash flow +10.0/30.0
- Rent growth +3.8/5.0
- Livability +3.7/5.0
- 1% rule +3.1/10.0
- DSCR +2.8/10.0
- Schools +2.6/10.0
- Condition / age +2.5/5.0
- Appreciation +0.0/10.0
$140,000
🖨 Deal sheet 📄 Offer letter ✓ Due diligence
Listing remarks MLS
* Seller financing available * Prime city investment opportunity! This property is located in a convenient in-town location with easy access to shopping, dining, schools, and public transportation. Offering strong potential for rental income or future appreciation, this home could be great for anyone looking to customize the home of their dreams! Or investors looking to add to their portfolio. The layout provides functional living space with room for updates or value-add improvements. Whether you’re looking for a long-term rental, fix-and-hold, or flip opportunity, this property offers great potential.
Key facts
- 6,970 sq ft lot
- Built 1928
- Listed 143 days
Neighborhood map
What this means for you Summary
Snapshot
- This is a 2-bed/1.0-bath single-family listed at $140k.
Deal economics
- At list price, monthly cash flow is $-84 ($-1k/yr) — negative.
- To cash-flow at today's rent, offer at most $125k (10.7% below list).
- To meet the 1% rule (rent ≥ 1% of price), the offer needs to be $114k (18.7% below list).
- Recommended offer: $114k (18.7% below list) — sets the bar for 1% rule.
- Cap rate 5.6% vs local median 4.2% in Lafayette — top-decile yield for the area; either an underpriced asset or a hidden risk that comps aren't pricing in. Stress-test before assuming the spread holds.
Location & tenants
- Location reads 74/100 on livability (#68 in IN, #4,374 nationally) — a middle-class / working-renter tenant base. Strengths: cost of living A+, housing A+, health & safety A+; Watch: schools D+, amenities D+, employment D+.
- Lafayette School Corporation (urban): math 29% / reading 34% proficiency, ranked #235 of 301 in IN (top 78%) — families likely to look elsewhere, expect single-tenant / working-renter base with shorter leases; 63% free/reduced lunch — lower-income household profile, screen leases tightly.
- Market conditions: Rents rising fast (+5.1%/yr); 219 active listings in the ZIP; 40 comparable units currently listed for rent nearby; rentals at typical pace (median 21d on market — plan ~3-4 weeks tenant-placement turnaround); 40% of comp listings sitting > 30 days — soft ceiling on asking rent; 1,341 units permitted in Tippecanoe County in 2024 (869 in 5+ unit buildings).
Forward outlook
- Local home prices are declining (-3.0%/yr); year-one equity from $968 of loan paydown is wiped out by about $4k of value loss. Plan a longer hold.
- Tippecanoe County population projected at +41% by 2050 — long-run rental-demand tailwind backs the buy-and-hold thesis.
Negotiation context
- It's been on market 144 days — a 12% lower offer ($123k) is reasonable based on typical stale-listing flexibility.
- 3 sale attempts with the ask held roughly flat each time — persistent listings suggest the price (not the market) is what's stuck; bring a comps-based counter.
Risks & watch-outs
- Watch-outs: built in 1928 — expect roof / HVAC / electrical / plumbing capex.
Questions for the listing agent
- What do current leases actually rent for vs. the listed asking? Can we see a recent rent roll and the last 12 months of T-12 income?
- It's been on market 144 days. Have you received any prior offers? Is the seller open to a 19% concession, seller financing, or rate buy-down credit?
- Built in 1928 — when were the roof, HVAC, electrical panel, plumbing, and water heater last replaced?
- Why hasn't it sold? Are there any deal-killer items the seller is aware of (foundation, flood, title, zoning, code violations)?
- Is there a deadline driving the sale (1031 exchange, divorce, estate, relocation)? That informs how much negotiation room exists.
- Schools are D-rated, which usually means shorter tenancies and higher turnover. Who's the typical renter profile here, and what's been the actual vacancy rate?
- Crime grade is F in this area — have there been break-ins, vandalism, or insurance claims at this property in the last 3 years? What carrier currently insures it and at what premium?
- The area grade is low — what's the realistic commute time and amenity access for the typical tenant pool here? Any planned neighborhood developments (good or bad) we should know about?
- What's the average days-on-market for RENTAL listings here right now (not sales)? A rising rental-DOM trend means longer vacancies and softer asking-rent achievability than the comps imply.
- What's the recent tenant-quality profile in this submarket — average credit score on applications, eviction rate, late-payment / NSF rate, and stable-employment percentage? A property-management company in the area should have these aggregated.
- How much new for-sale + rental construction is in the pipeline within 1–3 miles? Heavy new supply typically softens prices + rents 12–24 months out; constrained supply supports both.
Investment metrics
- 1% rule
- 0.81% ✗
- Cap rate
- 5.57%
- Cash-on-cash
- -2.59%
- DSCR
- 0.88
- GRM
- 10.3
CMA / ARV
- ARV (median comp)
- $161,976
- List price
- $140,000
- Delta
- -13.57%
- Verdict
- UNDERPRICED
- Comps
- 20 within 1.0 mi
Show comp detail 12 sales within ~0.75 mi
| Address | Dist | Beds/Ba | Sqft | Sold | Price | $/sf | Match |
|---|---|---|---|---|---|---|---|
| 819 S 19th St | 0.19mi | 3/1.0 (+1) | 988 (+5%) | 1mo | $110,000 | $111 | 76 |
| 1710 Congress St | 0.20mi | 3/1.0 (+1) | 864 (-8%) | 1mo | $210,000 | $243 | 72 |
| 1910 Perdue St | 0.33mi | 2/1.0 | 993 (+6%) | 8mo | $160,000 | $161 | 69 |
| 1920 Perdue St | 0.35mi | 2/1.0 | 874 (-7%) | 5mo | $165,000 | $189 | 68 |
| 826 S 18th St | 0.12mi | 3/1.0 (+1) | 1,064 (+13%) | 0mo | $150,000 | $141 | 67 |
| 1318 Sinton Ave | 0.39mi | 3/1.0 (+1) | 900 (-4%) | 7mo | $200,000 | $222 | 64 |
| 1212 Logan Ave | 0.49mi | 2/1.5 | 864 (-8%) | 0mo | $210,000 | $243 | 61 |
| 1907 Central St | 0.28mi | 2/1.0 | 825 (-12%) | 8mo | $195,000 | $236 | 60 |
| 1317 S 23rd St | 0.59mi | 1/1.0 (-1) | 845 (-10%) | 0mo | $62,000 | $73 | 50 |
| 2412 Central St | 0.57mi | 3/1.0 (+1) | 1,008 (+7%) | 8mo | $197,000 | $195 | 50 |
| 1309 S 23rd St | 0.55mi | 3/1.0 (+1) | 850 (-10%) | 6mo | $170,000 | $200 | 48 |
| 715 S 5th St | 0.66mi | 3/2.0 (+1) | 1,008 (+7%) | 4mo | $164,900 | $164 | 45 |
Match score weights: distance 35% · size 25% · config 20% · recency 20%. Top-matched comps best support the ARV.
Projected returns pro-forma
-3.0% appreciation · 5.12% rent growth · sell at horizon
- IRR
- -18.2%
- Equity multiple
- 0.35×
- Total profit
- $-25,561
- Equity at exit
- $20,874
- IRR
- -6.7%
- Equity multiple
- 0.53×
- Total profit
- $-18,453
- Equity at exit
- $12,105
Cash invested: $39,200 (down + closing). Projections, not guarantees.
Landlord ↔ Tenant lean methodology
- Overall (STATE)
- 90 Strongly Landlord-Friendly
- State Indiana
- 90 Strongly Landlord-Friendly · R+11
- County
- — inherits STATE
- City
- — inherits STATE
ZIP-level market 47905
- Home prices YoY
- -33.2%
- Rents YoY
- 5.1%
- Active inventory
- 219
- Price-to-rent
- 10.3×
Monthly cashflow live
- Estimated rent
- $1,138 high interval (Pro) →
- Mortgage (P&I)
- −$734
- Tax from tax record
- −$191 /mo · $2,294/yr
- Insurance
- −$58
- HOA
- −$0
- Vacancy / Maint / Mgmt
- −$239
- Net cashflow
- $-84
Break-even live
UW: 25.0% down · 7.5% · 30yr · 1.5% tax · 5.0% vac · 8.0% maint · 8.0% mgmt
Financing live
Cash to close
- Down payment
- $35,000
- Closing costs
- $4,200
- Reserves months
- —
- Total cash needed
- —
Loan-product check · same deal, 3 products live
Conventional
25% down · 7.5% · 30yr
- Down + closing
- —
- Monthly P&I
- —
- Monthly cashflow
- —
- DSCR
- —
- Eligible?
- —
Personal DTI + credit; lowest rate.
DSCR
20% down · 8.5% · 30yr
- Down + closing
- —
- Monthly P&I
- —
- Monthly cashflow
- —
- DSCR
- —
- Eligible?
- —
No personal income docs; deal must DSCR.
Hard money
10% down · 12.0% · 12mo
- Down + closing
- —
- Monthly P&I
- —
- Monthly cashflow
- —
- DSCR
- —
- Eligible?
- —
Short-term bridge; refi at stabilization.
Rent comps 40 comps
| Address | Beds | Baths | Sqft | Rent | $/sqft | DOM | Units | Dist |
|---|---|---|---|---|---|---|---|---|
| 409 S 15th St Lafayette, IN | 2.0 | 2.0 | 864 | $1,200 | $1.39 | 43d | 1 | 0.28mi |
| 612 S 10th St Unit 612 Lafayette, IN | 2.0 | 1.0 | 1028 | $1,035 | $1.01 | 13d | 1 | 0.37mi |
| 2107 Central St Lafayette, IN | 2.0 | 1.0 | 816 | $1,179 | $1.44 | 43d | 1 | 0.38mi |
| 1616 Center St Lafayette, IN | 1.0 | 1.0 | 616 | $920 | $1.49 | 43d | 1 | 0.40mi |
| 1739 Main St Unit 7 Lafayette, IN | 3.0 | 1.0 | 750 | $1,300 | $1.73 | 13d | 1 | 0.45mi |
| 1739 Main St Unit 5 Lafayette, IN | 3.0 | 1.0 | 850 | $1,200 | $1.41 | 43d | 1 | 0.45mi |
| 2026 Scott St Lafayette, IN | 2.0 | 2.0 | 1025 | $1,450 | $1.41 | 43d | 1 | 0.64mi |
| 1700 Columbia St Unit 7 Lafayette, IN | 1.0 | 1.0 | 575 | $925 | $1.61 | 13d | 1 | 0.65mi |
| 1422 Main St Unit 05 Lafayette, IN | 2.0 | 1.0 | 780 | $875 | $1.12 | 21d | 1 | 0.67mi |
| 2450 S Earl Ave Lafayette, IN | 1.0–2.0 | 1.0 | 755 | $1,214 | $1.61 | 13d | 3 | 0.69mi |
| 104 S 7th St Lafayette, IN | 1.0 | 1.0 | 728 | $815 | $1.12 | 43d | 1 | 0.72mi |
| 901 S 4th St Lafayette, IN | 1.0–2.0 | 1.0 | 739 | $1,033 | $1.40 | 13d | 3 | 0.73mi |
| 205 S 6th St Lafayette, IN | 2.0 | 1.0 | 1123 | $1,200 | $1.07 | 21d | 1 | 0.74mi |
| 549 S 3rd St Lafayette, IN | 2.0 | 1.0 | 1000 | $1,100 | $1.10 | 43d | 1 | 0.80mi |
| 216 S 5th St Apt 2 Lafayette, IN | 2.0 | 1.0 | 550 | $829 | $1.51 | 13d | 1 | 0.80mi |
| 475 South St Lafayette, IN | 1.0–2.0 | 1.0–2.0 | 870 | $2,100 | $2.41 | 13d | 12 | 0.89mi |
| 6 S 4th St Lafayette, IN | 1.0–3.0 | 1.0–3.0 | 1102 | $1,474 | $1.34 | 13d | 1 | 0.94mi |
| 117 N 5th St Lafayette, IN | 2.0 | 1.0–1.5 | 1123 | $1,632 | $1.45 | 21d | 4 | 0.94mi |
| 721 North St Apt 2 Lafayette, IN | 2.0 | 1.0 | 1036 | $900 | $0.87 | 43d | 1 | 0.95mi |
| 335 S 31st St Lafayette, IN | 2.0 | 1.0 | 840 | $1,250 | $1.49 | 13d | 1 | 0.97mi |
| 1033 Holloway St Lafayette, IN | 2.0 | 1.0 | 780 | $1,150 | $1.47 | 13d | 1 | 0.98mi |
| 810 Brown St Lafayette, IN | 1.0 | 1.0 | 600 | $1,095 | $1.82 | 43d | 1 | 1.00mi |
| 1018 Holloway St Unit 1020 Lafayette, IN | 1.0 | 1.0 | 625 | $850 | $1.36 | 13d | 1 | 1.01mi |
| 1102 Holloway St Apt 2 Lafayette, IN | 2.0 | 1.0 | 747 | $995 | $1.33 | 43d | 1 | 1.02mi |
| 1116 Holloway St Lafayette, IN | 1.0 | 1.0 | 625 | $850 | $1.36 | 21d | 1 | 1.03mi |
| 1302 Elizabeth St Unit 5 Lafayette, IN | 1.0 | 1.0 | 600 | $849 | $1.42 | 13d | 1 | 1.04mi |
| 706 Erie St Lafayette, IN | 1.0 | 1.0 | 675 | $979 | $1.45 | 43d | 1 | 1.06mi |
| 2411 S 18th St Unit 2415 Lafayette, IN | 3.0 | 1.0 | 1000 | $1,160 | $1.16 | 13d | 1 | 1.11mi |
| 2433 Oxford St Lafayette, IN | 2.0 | 1.0 | 672 | $1,025 | $1.53 | 43d | 1 | 1.12mi |
| 811 Union St Unit 813 Lafayette, IN | 2.0 | 1.0 | 700 | $850 | $1.21 | 21d | 1 | 1.17mi |
| 814 N 10th St Apt 4 Lafayette, IN | 1.0 | 1.0 | 600 | $800 | $1.33 | 13d | 1 | 1.17mi |
| 1902 Salem St Apt 1 Lafayette, IN | 1.0 | 1.0 | 705 | $800 | $1.13 | 21d | 1 | 1.17mi |
| 423 N 3rd St Lafayette, IN | 2.0 | 1.0 | 1100 | $1,379 | $1.25 | 43d | 1 | 1.18mi |
| 802 N 9th St Lafayette, IN | 2.0 | 1.0–2.0 | 902 | $789 | $0.87 | 13d | 1 | 1.19mi |
| 1101 Tippecanoe St Unit 1101 Lafayette, IN | 1.0 | 1.0 | 700 | $850 | $1.21 | 43d | 1 | 1.24mi |
| 512 Portledge Commons Dr Lafayette, IN | 1.0–2.0 | 1.0–2.0 | 978 | $1,325 | $1.35 | 43d | 1 | 1.26mi |
| 923 N 8th St Lafayette, IN | 1.0 | 1.0 | 700 | $964 | $1.38 | 13d | 4 | 1.27mi |
| 920 N 9th Street Rd Apt 5 Lafayette, IN | 1.0 | 1.0 | 700 | $1,495 | $2.14 | 21d | 1 | 1.28mi |
| 906 N 7th St Lafayette, IN | 1.0 | 1.0 | 572 | $775 | $1.35 | 43d | 1 | 1.31mi |
| 1031 Hartford St Unit 3 Lafayette, IN | 1.0 | 1.0 | 600 | $775 | $1.29 | 21d | 1 | 1.31mi |
Listing history 19 events
-
2026-06-19days on market $140,000 Active 144 DOM
-
2026-06-18days on market $140,000 Active 143 DOM
-
2026-06-17days on market $140,000 Active 142 DOM
-
2026-06-16days on market $140,000 Active 141 DOM
-
2026-06-15days on market $140,000 Active 140 DOM
-
2026-06-14days on market $140,000 Active 138 DOM
-
2026-06-13days on market $140,000 Active 137 DOM
-
2026-06-10days on market $140,000 Active 135 DOM
-
2026-06-09days on market $140,000 Active 134 DOM
-
2026-06-08days on market $140,000 Active 133 DOM
-
2026-06-07days on market $140,000 Active 132 DOM
-
2026-06-02days on market $140,000 Active 127 DOM
-
2026-06-01days on market $140,000 Active 126 DOM
-
2026-05-31days on market $140,000 Active 125 DOM
-
2026-05-30days on market $140,000 Active 124 DOM
-
2026-05-07status Active 616-char remark
Show marketing remark (616 chars)
* Seller financing available * Prime city investment opportunity! This property is located in a convenient in-town location with easy access to shopping, dining, schools, and public transportation. Offering strong potential for rental income or future appreciation, this home could be great for anyone looking to customize the home of their dreams! Or investors looking to add to their portfolio. The layout provides functional living space with room for updates or value-add improvements. Whether you’re looking for a long-term rental, fix-and-hold, or flip opportunity, this property offers great potential.
-
2026-05-07historical 616-char remark
Show marketing remark (616 chars)
* Seller financing available * Prime city investment opportunity! This property is located in a convenient in-town location with easy access to shopping, dining, schools, and public transportation. Offering strong potential for rental income or future appreciation, this home could be great for anyone looking to customize the home of their dreams! Or investors looking to add to their portfolio. The layout provides functional living space with room for updates or value-add improvements. Whether you’re looking for a long-term rental, fix-and-hold, or flip opportunity, this property offers great potential.
-
2026-04-27status Active 616-char remark
Show marketing remark (616 chars)
* Seller financing available * Prime city investment opportunity! This property is located in a convenient in-town location with easy access to shopping, dining, schools, and public transportation. Offering strong potential for rental income or future appreciation, this home could be great for anyone looking to customize the home of their dreams! Or investors looking to add to their portfolio. The layout provides functional living space with room for updates or value-add improvements. Whether you’re looking for a long-term rental, fix-and-hold, or flip opportunity, this property offers great potential.
-
2026-01-26$145,000 Active 616-char remark
Show marketing remark (616 chars)
* Seller financing available * Prime city investment opportunity! This property is located in a convenient in-town location with easy access to shopping, dining, schools, and public transportation. Offering strong potential for rental income or future appreciation, this home could be great for anyone looking to customize the home of their dreams! Or investors looking to add to their portfolio. The layout provides functional living space with room for updates or value-add improvements. Whether you’re looking for a long-term rental, fix-and-hold, or flip opportunity, this property offers great potential.
ⓘ Source: listings_history table (triggers on properties + properties_extension) + one-shot
backfill from property_details.listing_events for pre-trigger history.
Tax reassessment forecast IN · Partial reset (capped growth)
- Current annual tax
- $2,294 · $191/mo
- Projected year-2 tax
- $2,294 · $191/mo
- Expected delta
- $0/yr ($0/mo · 0.0%)
ⓘ Screening estimate from a state-policy table — verify with the county assessor before closing.
Climate risk First Street
- Flood 1/10 Low FEMA zone X (unshaded) · 0% chance over 30 yrs
- Wildfire 1/10 Low
- Heat 3/10 Moderate 7 d/yr ≥102°F today · 18 d/yr by 30 yrs out
- Wind 2/10 Low
- Air quality 2/10 Low 1 unhealthy d/yr today · 2 by 30 yrs out
Nearby sold comps map
Loading sold comps map…
Walkable amenities ~0.75 mi
Loading nearby amenities…
Taxation est. · year 1
- Rental income
- $13,659
- − Mortgage interest
- −$7,842
- − Property taxes
- −$2,294
- − Insurance
- −$700
- − Repairs & maintenance
- −$1,093
- − Management
- −$1,093
- − Depreciation
- −$4,073
- Taxable loss
- −$3,436
- Est. tax savings @ 24.0%
- +$825
- After-tax cash flow
- $-189/yr
For passive investors: Depreciation is non-cash, so a rental often shows a tax loss while cash-flowing — sheltering income. Rental losses are passive: they offset passive income freely, and up to $25,000/yr can offset ordinary (W-2) income if you actively participate and your MAGI is under $100k (phasing out to $0 by $150k); unused losses carry forward. On sale, claimed depreciation is recaptured at up to 25%, and gains may owe capital-gains tax (a 1031 exchange can defer both). Figures are a year-1 estimate at your 24.0% rate — not tax advice; consult a CPA.
Schools (NCES district)
- District
- Lafayette School Corporation
- NCES district ID
- 1805400
- Math proficiency
- 29% ▼ -9.00%
- Reading proficiency
- 34% ▼ -7.00%
- Median HH income
- $39,817
- Composite
- 26.46/100
- National rank
- #7217
- State rank
- #235 of 301 in IN
Livability — Lafayette
- Score
- 74/100
- State rank
- #68
- US rank
- #4374
Category grades
Schools grade is shown separately in the Schools card above.
Census & demographics
- Census place
- Lafayette, IN
- County
- Tippecanoe County · 181,820 people
- City population
- 106,622
- Metro
- Lafayette-West Lafayette, IN
- Population (ZIP)
- 42,219
- Household income
- $65,861
- Rent vs Own
- Severe rent burden
- 1475.0
Population outlook (Tippecanoe County) Hauer SSP2
- Today (2025)
- 215,327 people
- By 2030
- 232,284 · +7.9%
- By 2040
- 266,517 · +23.8%
- By 2050
- 302,826 · +40.6%
- By 2075
- 394,445 · +83.2%
- By 2100
- 463,500 · +115.3%
Race, ethnicity, and origin ACS 2023
- Neighborhood character
- Predominantly White (74%)
- Race & ethnicity
- White 74% Hispanic / Latino 12% Two or more races 8% Black 7% Asian 4%
- Hispanic origin (detail)
- Mexican 10%
- Common ancestry
- Romanian 3% Italian 2% Slovak 2%
- Foreign-born
- 10% · Canada, China, Vietnam
- Languages at home
- 91% English-only · Spanish 6% Other Asian/Pacific 1% Vietnamese 1%
Political lean MEDSL · Tippecanoe
- 2024 margin
- Toss-up / Even · D 49.0% · R 49.1% · Other 1.9%
- 2008→2024 swing
- -11.8pp toward R · 2008: 11.6pp · 2024: -0.1pp
- All cycles
- 2024: R+0.1 2020: D+0.6 2016: R+5.7 2012: R+3.6 2008: D+11.6
Not yet ingested
- Civics
- —
Market trends
- HPI YoY
- ▼ -113.05%
- Current HPI
- 227.1583
- Rent YoY
- ▲ 5.12%
- Metro
- Lafayette-West Lafayette, IN
- State GDP YoY
- ▲ 2.90%
- F500 in state
- 18
Industry mix (Fortune 500 HQ in IN)
| Industry | F500 HQs | Revenue |
|---|---|---|
| Industrial Machinery | 2 | $37B |
|
||
| Healthcare | 1 | $177B |
|
||
| Pharmaceuticals | 1 | $45B |
|
||
| Metals / Steel | 1 | $18B |
|
||
| Agriculture | 1 | $17B |
|
||
| Packaging | 1 | $12B |
|
||
Price history
4 events — show timeline
- 2026-05-07 Relisted — IRMLS
- 2026-05-07 Delisted — IRMLS
- 2026-04-27 Relisted — IRMLS
- 2026-01-26 Listed $145,000 IRMLS
Property tax history
+4.2%/yrLatest (2024): $2,294 · +40.2% YoY. Source: county tax records.
Cash-flow waterfall
monthlySold comps — $/sqft
last 12 mo · ≤1 miLoading sold comps…