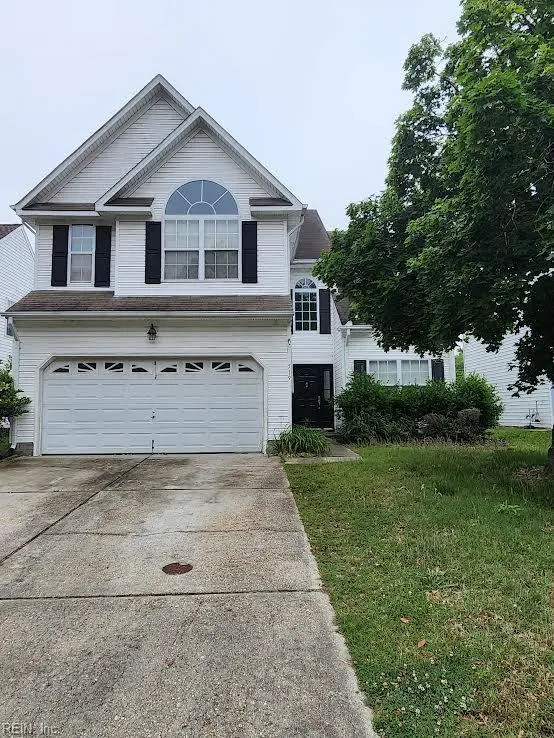
519 Windward Dr · Chesapeake, VA
Flood risk 1/10 · Minimal
- FEMA flood zone
- X (unshaded)
- Chance of flooding over 30 yrs
- 0.0%
- Est. flood insurance / yr
- $507 – $1,088
Fire risk 4/10 · Minor
- Est. fire insurance / yr
- $666 – $1,236
Heat risk 9/10 · Severe
- Hot days now (above 106°F)
- 7 days/yr
- Hot days in 30 yrs
- 16 days/yr
Wind risk 8/10 · Major
- Chance of severe wind over 30 yrs
- 80.0%
Air-quality risk 1/10 · Minimal
- Unhealthy air days now
- 0 days/yr
- Unhealthy air days in 30 yrs
- 0 days/yr
Risk factors via First Street. Map © Google.
Why this score? — see what drove the D+ grade
The composite is a weighted blend of 9 inputs, each scored 0–100. Each bar is that input's sub-score; the figure is the points it added to the 100-point composite (weight × sub-score).
- ARV discount +15.0/15.0
- Cash flow +10.9/30.0
- Schools +5.8/10.0
- Rent growth +4.4/5.0
- Livability +3.5/5.0
- DSCR +3.1/10.0
- 1% rule +2.9/10.0
- Condition / age +2.5/5.0
- Appreciation +0.0/10.0
$400,000
🖨 Deal sheet (PDF) 📄 Offer letter ✓ Due diligence
Listing remarks
Priced to Sell in Chesapeake! Don't miss this opportunity to own a spacious 4-bedroom, 3.5-bath home offering approximately 2,596 square feet of living space. Features include a 2-car garage, an eat-in kitchen, and a gas fireplace. This home needs some TLC and updating, but offers tremendous potential for buyers looking to build equity and make it their own. Located in an established neighborhood near shopping, dining, schools, and commuter routes. Property is being sold strictly as-is. Seller to make no repairs.
Key facts
- Gas fireplace
- Eat-in kitchen
- 2 garage spots
Tags
Property features AI
Finance
- HOA & community: Homeowners association (Estates of Greenbrier) with monthly fee of $28; Association provides ground maintenance
Exterior
- Parking: Attached 2-car garage; Additional off-street parking and driveway space (2 spaces)
- Utilities: City water; City sewer; Natural gas
- Home design: Detached single-family home; Traditional style; 2 stories; Main floor laundry; Slab foundation; 2 living levels
- Construction: Asphalt shingle roof
- Exterior features: Vinyl siding; Back yard fence; City view
Interior
- Kitchen: Dishwasher; Gas range; Microwave; Refrigerator
- Bedrooms: Two bedrooms with ensuite; Master bedroom
- Flooring: Laminate flooring; Vinyl flooring
- Bathrooms: 3 full bathrooms; 1 half bathroom
- Heating & cooling: Forced hot air heating (natural gas); Central air conditioning; Gas water heater
- Interior features: Cathedral ceiling; Ceiling fan; Gas fireplace; Jetted tub; Dual-entry bathroom between two bedrooms; Pull-down attic stairs; Walk-in closet; Cable hookup
- Laundry & utility: Washer hookup (main floor laundry available); Dryer hookup; Utility room
Neighborhood map
What this means for you Summary
Snapshot
- This is a 4-bed/3.0-bath single-family listed at $400k.
Deal economics
- At list price, monthly cash flow is $-179 ($-2k/yr) — negative.
- To cash-flow at today's rent, offer at most $368k (7.9% below list).
- To meet the 1% rule (rent ≥ 1% of price), the offer needs to be $316k (20.9% below list).
- Recommended offer: $316k (20.9% below list) — sets the bar for 1% rule.
- Cap rate 5.8% vs local median 3.7% in Chesapeake — top-decile yield for the area; either an underpriced asset or a hidden risk that comps aren't pricing in. Stress-test before assuming the spread holds.
Location & tenants
- Location reads 70/100 on livability (#236 in VA) — a middle-class / working-renter tenant base. Strengths: employment A+, housing A+; Watch: crime C-, cost of living C-, amenities F.
- Chesapeake City Public School District (suburban): math 58% / reading 74% proficiency, ranked #31 of 131 in VA (top 24%) — acceptable for families but not a draw, mixed tenant base, ~2y average lease.
- Zoned schools: Greenbrier Intermediate (math 67% / reading 75%, grade A-, #303 of 1,108 statewide, top 28%, 608 students, 38% FRL); Greenbrier Middle (math 48% / reading 70%, grade B, #166 of 342 statewide, top 50%, 827 students, 42% FRL); Indian River High (math 69% / reading 73%, grade B+, #146 of 319 statewide, top 47%, 1,701 students, 71% FRL) — zoned schools average 50% FRL vs 28% district-wide (23 pts higher); higher-poverty schools than district average — tighter screening recommended.
- Market conditions: Rents rising fast (+7.8%/yr); 286 active listings in the ZIP; 9 comparable units currently listed for rent nearby; rentals leasing fast (median 10d on market — plan ~1-2 weeks tenant-placement turnaround); solid renter incomes; 597 units permitted in Chesapeake city in 2024 (0 in 5+ unit buildings).
- At $3,164/mo this rent would consume 45% of the median local household income ($84k/yr) (locally 2714% of renters already pay >50% of income on rent) — very limited rent-growth headroom before tenants either downsize or default.
Forward outlook
- Local home prices are declining (-3.0%/yr); year-one equity from $3k of loan paydown is wiped out by about $12k of value loss. Plan a longer hold.
- Chesapeake County population projected at +21% by 2050 — long-run rental-demand tailwind backs the buy-and-hold thesis.
Negotiation context
- Only 5 days on market — expect competitive offers; lowballing is unlikely to land.
- Current owner paid $275k; 45% above their basis — modest negotiation headroom, anchor on the comps not their cost.
Risks & watch-outs
- Climate carrying-cost: severe wind risk, 80% chance of damaging wind over 30y; extreme-heat days projected 7→16/yr by 2055 (HVAC capex compounding) — expect insurance premiums to compound above CPI over the hold.
Questions for the listing agent
- What do current leases actually rent for vs. the listed asking? Can we see a recent rent roll and the last 12 months of T-12 income?
- What does the HOA fee cover, when was the last increase, and are there any pending special assessments or reserve-fund shortfalls?
- Is there a deadline driving the sale (1031 exchange, divorce, estate, relocation)? That informs how much negotiation room exists.
- Schools are A-rated — typically a magnet for longer-tenancy family renters. What's the average tenant stay here, and is there a school-zone premium baked into asking?
- The area grade is low — what's the realistic commute time and amenity access for the typical tenant pool here? Any planned neighborhood developments (good or bad) we should know about?
- What's the average days-on-market for RENTAL listings here right now (not sales)? A rising rental-DOM trend means longer vacancies and softer asking-rent achievability than the comps imply.
- What's the recent tenant-quality profile in this submarket — average credit score on applications, eviction rate, late-payment / NSF rate, and stable-employment percentage? A property-management company in the area should have these aggregated.
- How much new for-sale + rental construction is in the pipeline within 1–3 miles? Heavy new supply typically softens prices + rents 12–24 months out; constrained supply supports both.
Investment metrics
- 1% rule
- 0.79% ✗
- Cap rate
- 5.76%
- Cash-on-cash
- -1.92%
- DSCR
- 0.91
- GRM
- 10.5
CMA / ARV
- ARV (on-the-fly)
- $556,400
- Comps found
- 12
Show comp detail 12 sales within ~0.75 mi
| Address | Dist | Beds/Ba | Sqft | Sold | Price | $/sf | Match |
|---|---|---|---|---|---|---|---|
| 900 Lee Shore Ct | 0.12mi | 4/2.5 | 2,226 (-14%) | 2mo | $538,097 | $242 | 66 |
| 1105 Cogliandro Dr | 0.69mi | 4/2.5 | 2,513 (-3%) | 1mo | $483,000 | $192 | 60 |
| 704 Camberly Ct | 0.55mi | 4/2.5 | 2,800 (+8%) | 2mo | $625,000 | $223 | 58 |
| 904 Meadowhill Ct | 0.45mi | 5/2.5 (+1) | 2,768 (+6%) | 7mo | $650,000 | $235 | 56 |
| 1127 Norcova Ct | 0.68mi | 4/2.5 | 2,410 (-7%) | 2mo | $450,000 | $187 | 52 |
| 200 Ians Way | 0.64mi | 4/2.5 | 2,350 (-10%) | 0mo | $590,000 | $251 | 52 |
| 912 Brookcrest Arch | 0.52mi | 4/2.5 | 2,378 (-8%) | 10mo | $510,000 | $214 | 51 |
| 1103 Woodsmans Ct | 0.49mi | 4/2.5 | 2,217 (-15%) | 0mo | $446,000 | $201 | 50 |
| 426 Blue Beech Way | 0.46mi | 3/2.5 (-1) | 2,352 (-10%) | 10mo | $435,000 | $185 | 48 |
| 408 Spring Maple Ct | 0.68mi | 4/2.5 | 2,775 (+7%) | 10mo | $545,000 | $196 | 47 |
| 1146 Fairway Dr | 0.75mi | 4/3.0 | 2,300 (-12%) | 4mo | $630,000 | $274 | 42 |
| 813 Kemp Meadow Dr | 0.75mi | 4/2.5 | 2,240 (-14%) | 7mo | $460,000 | $205 | 34 |
Match score weights: distance 35% · size 25% · config 20% · recency 20%. Top-matched comps best support the ARV.
Projected returns pro-forma
-3.0% appreciation · 7.78% rent growth · sell at horizon
- IRR
- -14.4%
- Equity multiple
- 0.46×
- Total profit
- $-60,260
- Equity at exit
- $59,641
- IRR
- 0.5%
- Equity multiple
- 1.05×
- Total profit
- $5,106
- Equity at exit
- $34,585
Cash invested: $112,000 (down + closing). Projections, not guarantees.
Landlord ↔ Tenant lean methodology
- Overall (STATE)
- 55 Moderately Landlord-Leaning
- State Virginia
- 55 Moderately Landlord-Leaning · D+2
- County
- — inherits STATE
- City
- — inherits STATE
ZIP-level market 23320
- Rents YoY
- 7.8%
- Active inventory
- 286
- Price-to-rent
- 10.5×
Monthly cashflow live
- Estimated rent
- $3,164 high interval (Pro) →
- Mortgage (P&I)
- −$2,098
- Tax from tax record
- −$386 /mo · $4,635/yr
- Insurance
- −$167
- HOA
- −$28
- Vacancy / Maint / Mgmt
- −$664
- Net cashflow
- $-179
Break-even live
Sensitivity live
| Price | -10% $48 | -5% $-66 | +0% $-179 | +5% $-292 | +10% $-405 |
|---|---|---|---|---|---|
| Rent | -10% $-429 | -5% $-304 | +0% $-179 | +5% $-54 | +10% $71 |
| Rate | -1.0pp $23 | -0.5pp $-77 | base $-179 | +0.5pp $-282 | +1.0pp $-388 |
UW: 25.0% down · 7.5% · 30yr · 1.5% tax · 5.0% vac · 8.0% maint · 8.0% mgmt
Financing live
Cash to close
- Down payment
- $100,000
- Closing costs
- $12,000
- Reserves months
- —
- Total cash needed
- —
Loan-product check · same deal, 3 products live
Conventional
25% down · 7.5% · 30yr
- Down + closing
- —
- Monthly P&I
- —
- Monthly cashflow
- —
- DSCR
- —
- Eligible?
- —
Personal DTI + credit; lowest rate.
DSCR
20% down · 8.5% · 30yr
- Down + closing
- —
- Monthly P&I
- —
- Monthly cashflow
- —
- DSCR
- —
- Eligible?
- —
No personal income docs; deal must DSCR.
Hard money
10% down · 12.0% · 12mo
- Down + closing
- —
- Monthly P&I
- —
- Monthly cashflow
- —
- DSCR
- —
- Eligible?
- —
Short-term bridge; refi at stabilization.
Rent comps 9 comps
| Address | Beds | Baths | Sqft | Rent | $/sqft | DOM | Units | Dist |
|---|---|---|---|---|---|---|---|---|
| 1017 Windswept Cir Unit NA Chesapeake, VA | 4.0 | 2.5 | 2597 | $3,595 | $1.38 | 4d | 1 | 0.62mi |
| 1017 Windswept Cir Chesapeake, VA | 4.0 | 2.5 | 2597 | $3,800 | $1.46 | 25d | 1 | 0.62mi |
| 509 Bowling Green Ct Chesapeake, VA | 3.0 | 2.5 | 1829 | $2,650 | $1.45 | 9d | 1 | 0.91mi |
| 509 Bowling Green Ct Chesapeake, VA | 3.0 | 2.5 | 1829 | $2,650 | $1.45 | 19d | 1 | 0.91mi |
| 764 Clearfield Ave Chesapeake, VA | 4.0 | 2.5 | 2428 | $2,350 | $0.97 | 4d | 1 | 1.15mi |
| 1120 Pummis Ln Chesapeake, VA | 4.0 | 2.5 | 2968 | $3,800 | $1.28 | 14d | 1 | 1.21mi |
| 629 Calista Dr Chesapeake, VA | 4.0 | 3.0 | 3000 | $3,600 | $1.20 | 16d | 1 | 1.31mi |
| 1533 Rollesby Way Chesapeake, VA | 3.0 | 2.5 | 1870 | $2,395 | $1.28 | 9d | 1 | 1.36mi |
| 1537 Tallwood Cir Chesapeake, VA | 3.0 | 2.5 | 1774 | $2,495 | $1.41 | 6d | 1 | 1.43mi |
HOA detail
- Monthly dues
- $28 · $336/yr
- Likely covers
- gas
Listing history 6 events
-
2026-06-02status $400,000 Under Contract 5 DOM
-
2026-06-01days on market $400,000 Active 5 DOM
-
2026-05-31days on market $400,000 Active 4 DOM
-
2026-05-27$400,000 Active
-
2011-03-02soldstatus $275,000
-
2001-05-22soldstatus $161,500
ⓘ Source: listings_history table (triggers on properties + properties_extension) + one-shot
backfill from property_details.listing_events for pre-trigger history.
Tax reassessment forecast VA · Resets to sale price
- Current annual tax
- $4,635 · $386/mo
- Projected year-2 tax
- $4,635 · $386/mo
- Expected delta
- $0/yr ($0/mo · 0.0%)
ⓘ Screening estimate from a state-policy table — verify with the county assessor before closing.
Climate risk First Street
- Flood 1/10 Low FEMA zone X (unshaded) · 0% chance over 30 yrs
- Wildfire 4/10 Moderate
- Heat 9/10 Extreme 7 d/yr ≥106°F today · 16 d/yr by 30 yrs out
- Wind 8/10 Severe 80% chance of damaging wind over 30 yrs
- Air quality 1/10 Low 0 unhealthy d/yr today · 0 by 30 yrs out
Nearby sold comps map
Loading sold comps map…
Walkable amenities ~0.75 mi
Loading nearby amenities…
Taxation est. · year 1
- Rental income
- $37,970
- − Mortgage interest
- −$22,406
- − Property taxes
- −$4,635
- − Insurance
- −$2,000
- − Repairs & maintenance
- −$3,038
- − Management
- −$3,038
- − HOA
- −$336
- − Depreciation
- −$11,636
- Taxable loss
- −$9,118
- Est. tax savings @ 24.0%
- +$2,188
- After-tax cash flow
- $42/yr
For passive investors: Depreciation is non-cash, so a rental often shows a tax loss while cash-flowing — sheltering income. Rental losses are passive: they offset passive income freely, and up to $25,000/yr can offset ordinary (W-2) income if you actively participate and your MAGI is under $100k (phasing out to $0 by $150k); unused losses carry forward. On sale, claimed depreciation is recaptured at up to 25%, and gains may owe capital-gains tax (a 1031 exchange can defer both). Figures are a year-1 estimate at your 24.0% rate — not tax advice; consult a CPA.
Schools (NCES district)
- District
- Chesapeake City Public School District
- NCES district ID
- 5100810
- Math proficiency
- 58% ▼ -29.00%
- Reading proficiency
- 74% ▼ -7.00%
- Median HH income
- $69,356
- Composite
- 57.84/100
- National rank
- #1047
- State rank
- #31 of 131 in VA
Livability — Chesapeake
- Score
- 70/100
- State rank
- #236
- US rank
- #7942
Category grades
Schools grade is shown separately in the Schools card above.
Census & demographics
- Census place
- Chesapeake, VA
- County
- Chesapeake City · 253,091 people
- City population
- 253,091
- Metro
- Virginia Beach-Norfolk-Newport News, VA-NC
- Population (ZIP)
- 59,108
- Household income
- $84,305
- Rent vs Own
- Severe rent burden
- 2714.0
Population outlook (Chesapeake County) Hauer SSP2
- Today (2025)
- 263,804 people
- By 2030
- 276,798 · +4.9%
- By 2040
- 299,906 · +13.7%
- By 2050
- 318,284 · +20.7%
- By 2075
- 362,137 · +37.3%
- By 2100
- 372,225 · +41.1%
Race, ethnicity, and origin ACS 2023
- Neighborhood character
- Diverse neighborhood (Simpson 0.66)
- Race & ethnicity
- White 49% Black 29% Hispanic / Latino 10% Two or more races 8% Asian 5%
- Hispanic origin (detail)
- Mexican 3% Puerto Rican 1%
- Common ancestry
- Lithuanian 2% Romanian 2% Italian 2%
- Foreign-born
- 9% · Canada
- Languages at home
- 89% English-only · Spanish 6% Tagalog/Filipino 2% French/Haitian/Cajun 1%
Political lean MEDSL · Chesapeake
- 2024 margin
- Toss-up / Even · D 51.3% · R 47.5% · Other 1.2%
- 2008→2024 swing
- +2.5pp toward D · 2008: 1.3pp · 2024: 3.8pp
- All cycles
- 2024: D+3.8 2020: D+6.5 2016: R+1.3 2012: D+1.1 2008: D+1.3
Not yet ingested
- Civics
- —
Market trends
- HPI YoY
- ▼ -241.43%
- Current HPI
- 285.5792
- Rent YoY
- ▲ 7.78%
- Metro
- Virginia Beach-Norfolk-Newport News, VA-NC
- State GDP YoY
- ▲ 2.40%
- F500 in state
- 50
Industry mix (Fortune 500 HQ in VA)
| Industry | F500 HQs | Revenue |
|---|---|---|
| Aerospace / Defense | 4 | $236B |
|
||
| Technology / Defense | 3 | $32B |
|
||
| Financial Services | 2 | $176B |
|
||
| Utilities | 2 | $27B |
|
||
| Insurance | 2 | $25B |
|
||
| Technology | 2 | $15B |
|
||
Price history
+147.7% since first listed3 events — show timeline
- 2026-05-27 Listed $400,000 REINMLS
- 2011-03-02 Sold (Public Records) $275,000 Public Records
- 2001-05-22 Sold (Public Records) $161,500 Public Records
Property tax history
+3.8%/yrLatest (2025): $4,635 · +57.8% YoY. Source: county tax records.
Cash-flow waterfall
monthlySold comps — $/sqft
last 12 mo · ≤1 miLoading sold comps…