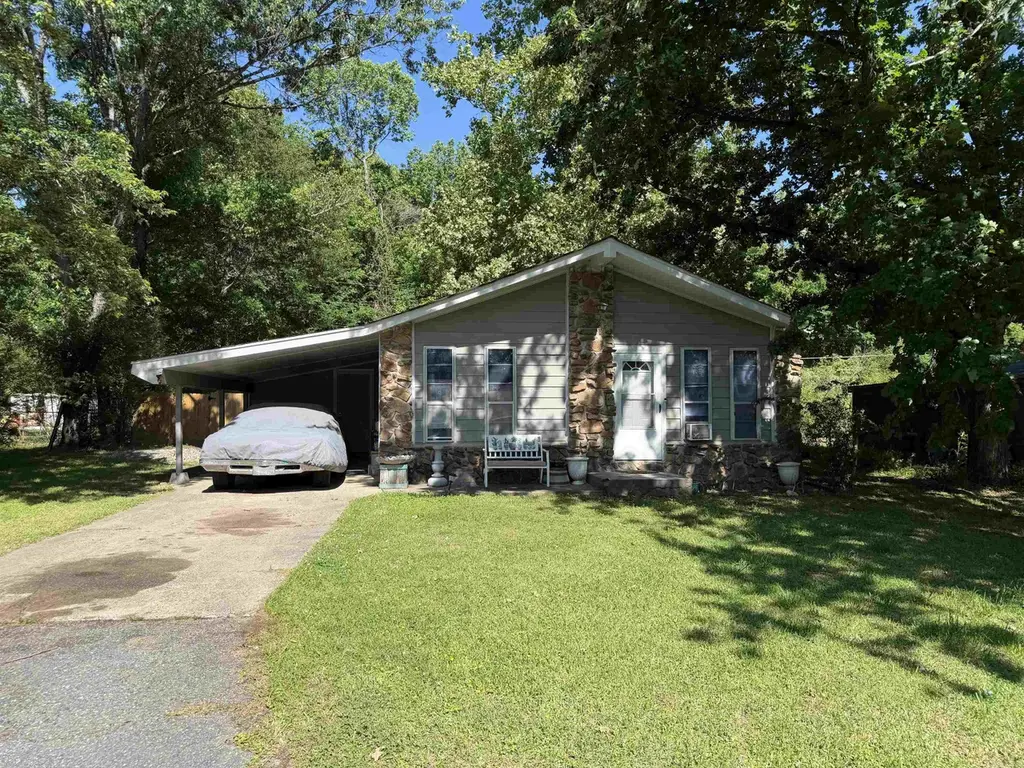
14 Compass Point St · Gibson, AR
Flood risk 1/10 · Minimal
- FEMA flood zone
- X (unshaded)
- Chance of flooding over 30 yrs
- 0.0%
- Est. flood insurance / yr
- $507 – $1,088
Fire risk 4/10 · Minor
- Est. fire insurance / yr
- $1,499 – $2,785
Heat risk 6/10 · Moderate
- Hot days now (above 111°F)
- 7 days/yr
- Hot days in 30 yrs
- 18 days/yr
Wind risk 4/10 · Minor
- Chance of severe wind over 30 yrs
- 9.0%
Air-quality risk 2/10 · Minimal
- Unhealthy air days now
- 2 days/yr
- Unhealthy air days in 30 yrs
- 2 days/yr
Risk factors via First Street. Map © Google.
Why this score? — see what drove the C grade
The composite is a weighted blend of 9 inputs, each scored 0–100. Each bar is that input's sub-score; the figure is the points it added to the 100-point composite (weight × sub-score).
- Cash flow +30.0/30.0
- DSCR +10.0/10.0
- 1% rule +8.0/10.0
- Rent growth +3.7/5.0
- Livability +3.2/5.0
- Schools +2.6/10.0
- Condition / age +2.5/5.0
- ARV discount +0.0/15.0
- Appreciation +0.0/10.0
$95,000
🖨 Deal sheet 📄 Offer letter ✓ Due diligence
Listing remarks
Rental property being sold individually or as package with 3 other addresses. 3BD/1BA Unit currently rented at $895.00 per month. Additional properties in package:201 Natalie MLS#26016422, 41 Compass Pt. #26018965, 200 Wright #26018966. See Documents for Rental Information. Agents see remarks.
Key facts
- 9,147 sq ft lot
- Built 1972
- Listed 38 days
Property features AI
Finance
- Other: Lot size approximately 9,148 sq. ft. (0.21 acre) per tax records
- Financial info: Taxes are listed as included in expenses; Tenant pays all utilities; Current listed rental for the 3-bedroom unit: $895
Exterior
- Parking: Carport
- Utilities: Municipal electric; Natural gas; Public sewer; Public water
- Home design: Single-unit property; Zoned R-1
- Construction: Composition roof; Crawl space foundation
- Exterior features: Frame exterior; Level lot; Paved road access
Interior
- Kitchen: Free-standing stove; Electric range; Dishwasher
- Bedrooms: One 3-bedroom unit
- Flooring: Laminate flooring; Partial carpet
- Heating & cooling: Central electric cooling; Central gas heat
- Interior features: Laminate and partial carpet flooring; Free-standing stove; Electric range; Dishwasher
Neighborhood map
What this means for you Summary
Snapshot
- This is a 3-bed/1.0-bath single-family listed at $95k.
Deal economics
- At list price, monthly cash flow is $371 ($4k/yr) — positive.
- The deal already cash-flows at list — no discount required.
- Meets the 1% rule at list price ($1k rent vs $95k).
- Recommended offer: $92k (3.0% below list) — sets the bar for market timing.
- Cap rate 11.0% vs local median 6.0% in Gibson — top-decile yield for the area; either an underpriced asset or a hidden risk that comps aren't pricing in. Stress-test before assuming the spread holds.
Location & tenants
- Location reads 64/100 on livability (#165 in AR) — a middle-class / working-renter tenant base. Strengths: cost of living A+, housing A+, employment B; Watch: schools F, amenities F, commute F.
- Pulaski County Spec. School District (rural): math 27% / reading 31% proficiency, ranked #150 of 238 in AR (top 63%) — low school quality limits family demand, transient renter base, plan for 1-2y turnover.
- Market conditions: Rents rising fast (+4.8%/yr); 243 active listings in the ZIP; 10 comparable units currently listed for rent nearby; rentals at typical pace (median 24d on market — plan ~3-4 weeks tenant-placement turnaround); solid renter incomes; 1,006 units permitted in Pulaski County in 2024 (0 in 5+ unit buildings).
Forward outlook
- Local home prices are declining (-3.0%/yr); year-one equity from $657 of loan paydown is wiped out by about $3k of value loss. Plan a longer hold.
- Pulaski County population projected at +6% by 2050 — modest demand growth; plan on rents tracking national, not racing it.
- At projected returns (-3.0% appreciation + 4.8% rent growth), your $27k cash investment doubles in ~7 years — after that, you're playing with house money.
Negotiation context
- It's been on market 38 days — a 3% lower offer ($92k) is reasonable based on typical stale-listing flexibility.
- Current owner paid $57k; list at $95k implies a 66% gain — meaningful room to come down on a strong offer.
Risks & watch-outs
- Climate carrying-cost: extreme-heat days projected 7→18/yr by 2055 (HVAC capex compounding) — expect insurance premiums to compound above CPI over the hold.
Questions for the listing agent
- It's been on market 38 days. Have you received any prior offers? Is the seller open to a 3% concession, seller financing, or rate buy-down credit?
- Built in 1972 — when were the roof, HVAC, electrical panel, plumbing, and water heater last replaced?
- Is there a deadline driving the sale (1031 exchange, divorce, estate, relocation)? That informs how much negotiation room exists.
- Schools are F-rated, which usually means shorter tenancies and higher turnover. Who's the typical renter profile here, and what's been the actual vacancy rate?
- What's the average days-on-market for RENTAL listings here right now (not sales)? A rising rental-DOM trend means longer vacancies and softer asking-rent achievability than the comps imply.
- What's the recent tenant-quality profile in this submarket — average credit score on applications, eviction rate, late-payment / NSF rate, and stable-employment percentage? A property-management company in the area should have these aggregated.
- How much new for-sale + rental construction is in the pipeline within 1–3 miles? Heavy new supply typically softens prices + rents 12–24 months out; constrained supply supports both.
Investment metrics
- 1% rule
- 1.30% ✓
- Cap rate
- 10.98%
- Cash-on-cash
- 16.74%
- DSCR
- 1.74
- GRM
- 6.4
CMA / ARV
- ARV (median comp)
- $74,431
- List price
- $95,000
- Delta
- 27.63%
- Verdict
- OVERPRICED
- Comps
- 1 within 2.0 mi
Show comp detail 12 sales within ~0.75 mi
| Address | Dist | Beds/Ba | Sqft | Sold | Price | $/sf | Match |
|---|---|---|---|---|---|---|---|
| 35 Compass Pt | 0.14mi | 3/1.0 | 1,000 (-4%) | 1mo | $41,000 | $41 | 87 |
| 12 Waterfront Dr | 0.06mi | 3/1.0 | 1,012 (-3%) | 17mo | $120,500 | $119 | 79 |
| 55 Aloha Cir | 0.27mi | 3/1.0 | 998 (-4%) | 6mo | $130,000 | $130 | 75 |
| 47 Aloha Cir | 0.25mi | 3/1.0 | 988 (-5%) | 9mo | $120,000 | $121 | 73 |
| 22 Aloha | 0.20mi | 3/1.5 | 1,080 (+4%) | 14mo | $117,500 | $109 | 71 |
| 33 Compass Point St | 0.13mi | 3/1.0 | 943 (-9%) | 9mo | $65,000 | $69 | 70 |
| 10015 Jacksonville Cato Rd | 0.36mi | 3/1.5 | 1,025 (-1%) | 12mo | $70,000 | $68 | 69 |
| 2116 Koko Dr | 0.39mi | 3/1.0 | 1,012 (-3%) | 13mo | $132,500 | $131 | 67 |
| 38 Compass Point St | 0.15mi | 3/2.0 | 1,167 (+12%) | 4mo | $110,000 | $94 | 65 |
| 37 Aloha Cir | 0.23mi | 3/1.0 | 1,098 (+6%) | 18mo | $105,800 | $96 | 65 |
| 2720 Koko Dr | 0.54mi | 3/2.0 | 1,136 (+9%) | 10mo | $162,000 | $143 | 47 |
| 1 Fairfield Dr | 0.48mi | 3/2.0 | 1,137 (+9%) | 20mo | $169,999 | $150 | 41 |
Match score weights: distance 35% · size 25% · config 20% · recency 20%. Top-matched comps best support the ARV.
Projected returns pro-forma
-3.0% appreciation · 4.81% rent growth · sell at horizon
- IRR
- 9.8%
- Equity multiple
- 1.40×
- Total profit
- $10,512
- Equity at exit
- $14,165
- IRR
- 20.3%
- Equity multiple
- 2.85×
- Total profit
- $49,276
- Equity at exit
- $8,214
Cash invested: $26,600 (down + closing). Projections, not guarantees.
Landlord ↔ Tenant lean methodology
- Overall (STATE)
- 92 Strongly Landlord-Friendly
- State Arkansas
- 92 Strongly Landlord-Friendly · R+14
- County
- — inherits STATE
- City
- — inherits STATE
ZIP-level market 72120
- Rents YoY
- 4.8%
- Active inventory
- 243
- Price-to-rent
- 6.4×
Monthly cashflow live
- Estimated rent
- $1,235 high interval (Pro) →
- Mortgage (P&I)
- −$498
- Tax from tax record
- −$67 /mo · $802/yr
- Insurance
- −$40
- HOA
- −$0
- Vacancy / Maint / Mgmt
- −$259
- Net cashflow
- $371
Break-even live
UW: 25.0% down · 7.5% · 30yr · 1.5% tax · 5.0% vac · 8.0% maint · 8.0% mgmt
Financing live
Cash to close
- Down payment
- $23,750
- Closing costs
- $2,850
- Reserves months
- —
- Total cash needed
- —
Loan-product check · same deal, 3 products live
Conventional
25% down · 7.5% · 30yr
- Down + closing
- —
- Monthly P&I
- —
- Monthly cashflow
- —
- DSCR
- —
- Eligible?
- —
Personal DTI + credit; lowest rate.
DSCR
20% down · 8.5% · 30yr
- Down + closing
- —
- Monthly P&I
- —
- Monthly cashflow
- —
- DSCR
- —
- Eligible?
- —
No personal income docs; deal must DSCR.
Hard money
10% down · 12.0% · 12mo
- Down + closing
- —
- Monthly P&I
- —
- Monthly cashflow
- —
- DSCR
- —
- Eligible?
- —
Short-term bridge; refi at stabilization.
Rent comps 10 comps
| Address | Beds | Baths | Sqft | Rent | $/sqft | DOM | Units | Dist |
|---|---|---|---|---|---|---|---|---|
| 38 Compass Point St Sherwood, AR | 3.0 | 2.0 | 1167 | $1,050 | $0.90 | 23d | 1 | 0.14mi |
| 67 Aloha Cir Unit A Sherwood, AR | 2.0 | 1.0 | 900 | $995 | $1.11 | 23d | 1 | 0.22mi |
| 59 Aloha Cir Sherwood, AR | 4.0 | 2.0 | 1200 | $1,195 | $1.00 | 19d | 1 | 0.25mi |
| 10204 Bamboo Ln Lot 7 Sherwood, AR | 2.0 | 2.0 | 810 | $1,100 | $1.36 | 14d | 1 | 0.31mi |
| 10204 Bamboo Ln Unit 4 Sherwood, AR | 2.0 | 2.0 | 810 | $995 | $1.23 | 14d | 1 | 0.31mi |
| 21 Brookway Ln Sherwood, AR | 3.0 | 1.5 | 1024 | $1,195 | $1.17 | 43d | 1 | 1.15mi |
| 16 Brookway Ln Sherwood, AR | 3.0 | 2.0 | 1206 | $1,295 | $1.07 | 23d | 1 | 1.20mi |
| 8 Brookway Ln Sherwood, AR | 3.0 | 2.0 | 1170 | $1,300 | $1.11 | 43d | 1 | 1.23mi |
| 1717 Hatcher Rd Unit 16 Sherwood, AR | 3.0 | 2.0 | 1280 | $800 | $0.62 | 14d | 1 | 1.29mi |
| 1717 Hatcher Rd Unit 23 Sherwood, AR | 3.0 | 2.0 | 1280 | $750 | $0.59 | 14d | 1 | 1.39mi |
Listing history 18 events
-
2026-06-18days on market $95,000 Active 38 DOM
-
2026-06-17days on market $95,000 Active 37 DOM
-
2026-06-16days on market $95,000 Active 36 DOM
-
2026-06-15days on market $95,000 Active 35 DOM
-
2026-06-14days on market $95,000 Active 33 DOM
-
2026-06-13days on market $95,000 Active 32 DOM
-
2026-06-10days on market $95,000 Active 30 DOM
-
2026-06-09days on market $95,000 Active 29 DOM
-
2026-06-08days on market $95,000 Active 28 DOM
-
2026-06-07days on market $95,000 Active 27 DOM
-
2026-06-05days on market $95,000 Active 24 DOM
-
2026-06-03days on market $95,000 Active 23 DOM
-
2026-06-02days on market $95,000 Active 22 DOM
-
2026-06-01days on market $95,000 Active 21 DOM
-
2026-05-31days on market $95,000 Active 20 DOM
-
2026-05-31days on market $95,000 Active 19 DOM
-
2026-05-11$95,000 New Listing 295-char remark
-
2000-03-21soldstatus $57,336
ⓘ Source: listings_history table (triggers on properties + properties_extension) + one-shot
backfill from property_details.listing_events for pre-trigger history.
Tax reassessment forecast AR · Resets to sale price
- Current annual tax
- $802 · $67/mo
- Projected year-2 tax
- $802 · $67/mo
- Expected delta
- $0/yr ($0/mo · -0.0%)
ⓘ Screening estimate from a state-policy table — verify with the county assessor before closing.
Climate risk First Street
- Flood 1/10 Low FEMA zone X (unshaded) · 0% chance over 30 yrs
- Wildfire 4/10 Moderate
- Heat 6/10 Major 7 d/yr ≥111°F today · 18 d/yr by 30 yrs out
- Wind 4/10 Moderate 9% chance of damaging wind over 30 yrs
- Air quality 2/10 Low 2 unhealthy d/yr today · 2 by 30 yrs out
Nearby sold comps map
Loading sold comps map…
Walkable amenities ~0.75 mi
Loading nearby amenities…
Taxation est. · year 1
- Rental income
- $14,819
- − Mortgage interest
- −$5,321
- − Property taxes
- −$802
- − Insurance
- −$475
- − Repairs & maintenance
- −$1,186
- − Management
- −$1,186
- − Depreciation
- −$2,764
- Taxable income
- $3,086
- Est. tax owed @ 24.0%
- −$741
- After-tax cash flow
- $3,711/yr
For passive investors: Depreciation is non-cash, so a rental often shows a tax loss while cash-flowing — sheltering income. Rental losses are passive: they offset passive income freely, and up to $25,000/yr can offset ordinary (W-2) income if you actively participate and your MAGI is under $100k (phasing out to $0 by $150k); unused losses carry forward. On sale, claimed depreciation is recaptured at up to 25%, and gains may owe capital-gains tax (a 1031 exchange can defer both). Figures are a year-1 estimate at your 24.0% rate — not tax advice; consult a CPA.
Schools (NCES district)
- District
- Pulaski County Spec. School District
- NCES district ID
- 0511850
- Math proficiency
- 27% ▼ -13.00%
- Reading proficiency
- 31% ▼ -10.00%
- Median HH income
- $53,218
- Composite
- 25.67/100
- National rank
- #7394
- State rank
- #150 of 238 in AR
Livability — Gibson
- Score
- 64/100
- State rank
- #165
- US rank
- #13982
Category grades
Schools grade is shown separately in the Schools card above.
Census & demographics
- Census place
- Gibson, AR
- County
- Pulaski County · 372,764 people
- City population
- 33,393
- Metro
- Little Rock-North Little Rock-Conway, AR
- Population (ZIP)
- 34,365
- Household income
- $76,598
- Rent vs Own
- Severe rent burden
- 774.0
Population outlook (Pulaski County) Hauer SSP2
- Today (2025)
- 415,378 people
- By 2030
- 423,720 · +2.0%
- By 2040
- 435,182 · +4.8%
- By 2050
- 440,904 · +6.1%
- By 2075
- 445,521 · +7.3%
- By 2100
- 419,173 · +0.9%
Race, ethnicity, and origin ACS 2023
- Neighborhood character
- Predominantly White (65%)
- Race & ethnicity
- White 65% Black 26% Two or more races 5% Hispanic / Latino 4% Asian 1%
- Common ancestry
- Lithuanian 2% Slovak 1% Italian 1%
- Foreign-born
- 2% · Canada, South Korea
- Languages at home
- 96% English-only · Spanish 2% Korean 1%
Political lean MEDSL · Pulaski
- 2024 margin
- Strong D (+22.1) · D 59.8% · R 37.7% · Other 2.5%
- 2008→2024 swing
- +10.6pp toward D · 2008: 11.6pp · 2024: 22.1pp
- All cycles
- 2024: D+22.1 2020: D+22.5 2016: D+17.9 2012: D+11.4 2008: D+11.6
Not yet ingested
- Civics
- —
Market trends
- HPI YoY
- ▼ -134.93%
- Current HPI
- 198.9456
- Rent YoY
- ▲ 4.81%
- Metro
- Little Rock-North Little Rock-Conway, AR
- State GDP YoY
- ▲ 3.80%
- F500 in state
- 10
Industry mix (Fortune 500 HQ in AR)
| Industry | F500 HQs | Revenue |
|---|---|---|
| Retail | 1 | $681B |
|
||
| Food / Agriculture | 1 | $53B |
|
||
| Retail / Energy | 1 | $22B |
|
||
| Transportation / Logistics | 1 | $12B |
|
||
| Energy | 1 | $4B |
|
||
Price history
+65.7% since first listed2 events — show timeline
- 2026-05-11 Listed $95,000 CARMLS
- 2000-03-21 Sold (Public Records) $57,336 Public Records
Property tax history
+3.7%/yrLatest (2025): $802 · +5.3% YoY. Source: county tax records.
Cash-flow waterfall
monthlySold comps — $/sqft
last 12 mo · ≤1 miLoading sold comps…