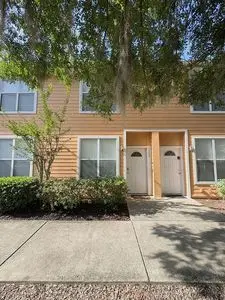
3920 SW 20th Ave · Gainesville, FL
Flood risk No data
- FEMA flood zone
- —
- Chance of flooding over 30 yrs
- —
- Est. flood insurance / yr
- —
Fire risk No data
- Est. fire insurance / yr
- —
Heat risk No data
- Hot days now (above threshold)
- —
- Hot days in 30 yrs
- —
Wind risk No data
- Chance of severe wind over 30 yrs
- —
Air-quality risk No data
- Unhealthy air days now
- —
- Unhealthy air days in 30 yrs
- —
Risk factors via First Street. Map © Google.
Why this score? — see what drove the D+ grade
The composite is a weighted blend of 9 inputs, each scored 0–100. Each bar is that input's sub-score; the figure is the points it added to the 100-point composite (weight × sub-score).
- Cash flow +17.7/30.0
- ARV discount +7.5/15.0
- DSCR +5.5/10.0
- 1% rule +4.8/10.0
- Schools +4.3/10.0
- Livability +4.0/5.0
- Rent growth +2.7/5.0
- Condition / age +2.5/5.0
- Appreciation +0.0/10.0
$178,999
🖨 Deal sheet 📄 Offer letter ✓ Due diligence
Listing remarks MLS
Light and Bright Townhome (2 BR/2.5 BA, built 2002) in Kensington North, close to UF and Shands. Separate living room and dining room. Two master bedrooms. 3 paddle fans. Ceramic tile foyer. Inside laundry. Close to community mailboxes and pool. View of pond in back. On bus route. 5+ Units.
Key facts
- Built 2002
- Listed 5 days
Tags
Neighborhood map
What this means for you Summary
Snapshot
- This is a 2-bed/2.0-bath condo listed at $179k.
Deal economics
- At list price, monthly cash flow is $144 ($2k/yr) — positive.
- The deal already cash-flows at list — no discount required.
- To meet the 1% rule (rent ≥ 1% of price), the offer needs to be $175k (2.3% below list).
- Recommended offer: $175k (2.3% below list) — sets the bar for 1% rule.
Location & tenants
- Location reads 81/100 on livability (#97 in FL, #1,480 nationally) — a professional / high-income tenant draw. Strengths: amenities A+, commute A+, cost of living A+; Watch: employment D+, crime F.
- Alachua (urban): math 49% / reading 54% proficiency, ranked #30 of 73 in FL (top 41%) — acceptable for families but not a draw, mixed tenant base, ~2y average lease.
- Market conditions: Rents flat; 245 active listings in the ZIP; 1 comparable units currently listed for rent nearby; 1,774 units permitted in Alachua County in 2024 (984 in 5+ unit buildings).
- At $1,748/mo this rent would consume 46% of the median local household income ($46k/yr) (locally 3418% of renters already pay >50% of income on rent) — very limited rent-growth headroom before tenants either downsize or default.
Forward outlook
- Local home prices are declining (-3.0%/yr); year-one equity from $1k of loan paydown is wiped out by about $5k of value loss. Plan a longer hold.
- Alachua County population projected at +26% by 2050 — long-run rental-demand tailwind backs the buy-and-hold thesis.
Negotiation context
- Only 5 days on market — expect competitive offers; lowballing is unlikely to land.
- 8 sale attempts since 22y ago with the ask held roughly flat each time — persistent listings suggest the price (not the market) is what's stuck; bring a comps-based counter.
- Current owner paid $150k; 20% above their basis — modest negotiation headroom, anchor on the comps not their cost.
Questions for the listing agent
- Any open or pending special assessments — roof, HVAC, plumbing, elevator, façade? What's the per-unit balance and payoff schedule, and is the seller paying it off at close or rolling it to the buyer?
- Is there a deadline driving the sale (1031 exchange, divorce, estate, relocation)? That informs how much negotiation room exists.
- Schools are B-rated — typically a magnet for longer-tenancy family renters. What's the average tenant stay here, and is there a school-zone premium baked into asking?
- Crime grade is F in this area — have there been break-ins, vandalism, or insurance claims at this property in the last 3 years? What carrier currently insures it and at what premium?
- The area grade is low — what's the realistic commute time and amenity access for the typical tenant pool here? Any planned neighborhood developments (good or bad) we should know about?
- What's the average days-on-market for RENTAL listings here right now (not sales)? A rising rental-DOM trend means longer vacancies and softer asking-rent achievability than the comps imply.
- What's the recent tenant-quality profile in this submarket — average credit score on applications, eviction rate, late-payment / NSF rate, and stable-employment percentage? A property-management company in the area should have these aggregated.
- How much new apartment / multifamily construction is in the pipeline within 1–3 miles? Heavy new supply (>2% of stock underway) typically softens rents 12–24 months out; light construction supports rent growth.
Investment metrics
- 1% rule
- 0.98% ✗
- Cap rate
- 7.26%
- Cash-on-cash
- 3.45%
- DSCR
- 1.15
- GRM
- 8.5
CMA / ARV
No comps found within radius.
Projected returns pro-forma
-3.0% appreciation · 0.6% rent growth · sell at horizon
- IRR
- -13.6%
- Equity multiple
- 0.52×
- Total profit
- $-23,918
- Equity at exit
- $26,689
- IRR
- -9.0%
- Equity multiple
- 0.50×
- Total profit
- $-25,019
- Equity at exit
- $15,477
Cash invested: $50,120 (down + closing). Projections, not guarantees.
Landlord ↔ Tenant lean methodology
- Overall (STATE)
- 87 Strongly Landlord-Friendly
- State Florida
- 87 Strongly Landlord-Friendly · R+3
- County
- — inherits STATE
- City
- — inherits STATE
ZIP-level market 32607
- Rents YoY
- 0.6%
- Active inventory
- 245
- Price-to-rent
- 8.5×
Monthly cashflow live
- Estimated rent
- $1,748 medium interval (Pro) →
- Mortgage (P&I)
- −$939
- Tax est. 1.5%
- −$224 /mo · $2,685/yr
- Insurance
- −$75
- HOA
- −$0
- Vacancy / Maint / Mgmt
- −$367
- Net cashflow
- $144
Break-even live
UW: 25.0% down · 7.5% · 30yr · 1.5% tax · 5.0% vac · 8.0% maint · 8.0% mgmt
Financing live
Cash to close
- Down payment
- $44,750
- Closing costs
- $5,370
- Reserves months
- —
- Total cash needed
- —
Loan-product check · same deal, 3 products live
Conventional
25% down · 7.5% · 30yr
- Down + closing
- —
- Monthly P&I
- —
- Monthly cashflow
- —
- DSCR
- —
- Eligible?
- —
Personal DTI + credit; lowest rate.
DSCR
20% down · 8.5% · 30yr
- Down + closing
- —
- Monthly P&I
- —
- Monthly cashflow
- —
- DSCR
- —
- Eligible?
- —
No personal income docs; deal must DSCR.
Hard money
10% down · 12.0% · 12mo
- Down + closing
- —
- Monthly P&I
- —
- Monthly cashflow
- —
- DSCR
- —
- Eligible?
- —
Short-term bridge; refi at stabilization.
Rent comps 1 comps
| Address | Beds | Baths | Sqft | Rent | $/sqft | DOM | Units | Dist |
|---|---|---|---|---|---|---|---|---|
| 4781 SW 36th Rd Gainesville, FL | 1.0–3.0 | 1.0–2.0 | 1137 | $2,340 | $2.06 | 13d | 61 | 1.30mi |
HOA detail condo
- Monthly dues
- $0 · $0/yr
- Likely covers
- pool
- Assessments
- None detected in remarks — confirm with the listing agent.
Listing history 6 events
-
2026-06-18days on market $178,999 Active 5 DOM
-
2026-06-17days on market $178,999 Active 4 DOM
-
2026-06-16days on market $178,999 Active 3 DOM
-
2026-06-15days on market $178,999 Active 2 DOM
-
2026-06-14remarks 659-char remark
-
2026-06-14$178,999 Active 1 DOM
ⓘ Source: listings_history table (triggers on properties + properties_extension) + one-shot
backfill from property_details.listing_events for pre-trigger history.
Nearby sold comps map
Loading sold comps map…
Walkable amenities ~0.75 mi
Loading nearby amenities…
Taxation est. · year 1
- Rental income
- $20,981
- − Mortgage interest
- −$10,027
- − Property taxes
- −$2,685
- − Insurance
- −$895
- − Repairs & maintenance
- −$1,678
- − Management
- −$1,678
- − Depreciation
- −$5,207
- Taxable loss
- −$1,190
- Est. tax savings @ 24.0%
- +$286
- After-tax cash flow
- $2,016/yr
For passive investors: Depreciation is non-cash, so a rental often shows a tax loss while cash-flowing — sheltering income. Rental losses are passive: they offset passive income freely, and up to $25,000/yr can offset ordinary (W-2) income if you actively participate and your MAGI is under $100k (phasing out to $0 by $150k); unused losses carry forward. On sale, claimed depreciation is recaptured at up to 25%, and gains may owe capital-gains tax (a 1031 exchange can defer both). Figures are a year-1 estimate at your 24.0% rate — not tax advice; consult a CPA.
Schools (NCES district)
- District
- Alachua
- NCES district ID
- 1200030
- Math proficiency
- 49% ▼ -9.00%
- Reading proficiency
- 54% ▼ -3.00%
- Median HH income
- $42,683
- Composite
- 43.31/100
- National rank
- #3038
- State rank
- #30 of 73 in FL
Livability — Gainesville
- Score
- 81/100
- State rank
- #97
- US rank
- #1480
Category grades
Schools grade is shown separately in the Schools card above.
Census & demographics
- Census place
- Gainesville, FL
- County
- Alachua County · 218,005 people
- City population
- 188,348
- Metro
- Gainesville, FL
- Population (ZIP)
- 35,720
- Household income
- $45,987
- Rent vs Own
- Severe rent burden
- 3418.0
Population outlook (Alachua County) Hauer SSP2
- Today (2025)
- 289,834 people
- By 2030
- 305,873 · +5.5%
- By 2040
- 335,246 · +15.7%
- By 2050
- 364,719 · +25.8%
- By 2075
- 436,665 · +50.7%
- By 2100
- 482,920 · +66.6%
Race, ethnicity, and origin ACS 2023
- Neighborhood character
- Diverse neighborhood (Simpson 0.65)
- Race & ethnicity
- White 52% Black 22% Hispanic / Latino 17% Two or more races 11% Asian 4%
- Hispanic origin (detail)
- Mexican 2% Puerto Rican 5% Cuban 2%
- Common ancestry
- Italian 2% Romanian 2% Slovak 2%
- Foreign-born
- 14% · Canada, Jamaica, China
- Languages at home
- 80% English-only · Spanish 12% Other Indo-European 3% French/Haitian/Cajun 1%
Political lean MEDSL · Alachua
- 2024 margin
- Strong D (+21.0) · D 59.7% · R 38.8% · Other 1.5%
- 2008→2024 swing
- -0.6pp no change · 2008: 21.6pp · 2024: 21.0pp
- All cycles
- 2024: D+21.0 2020: D+27.2 2016: D+22.5 2012: D+17.3 2008: D+21.6
Not yet ingested
- Civics
- —
Market trends
- HPI YoY
- ▼ -177.86%
- Current HPI
- 270.183
- Rent YoY
- ▲ 0.60%
- Metro
- Gainesville, FL
- State GDP YoY
- ▲ 3.28%
- F500 in state
- 36
Industry mix (Fortune 500 HQ in FL)
| Industry | F500 HQs | Revenue |
|---|---|---|
| Industrial Technology | 2 | $29B |
|
||
| Insurance | 2 | $17B |
|
||
| Retail | 1 | $60B |
|
||
| Technology Distribution | 1 | $58B |
|
||
| Homebuilding | 1 | $35B |
|
||
| Technology Manufacturing | 1 | $35B |
|
||
Price history
+50.5% since first listed15 events — show timeline
- 2026-06-14 Listed $178,999 FSBO.com
- 2025-07-04 Rental Removed $1,200 SHOWMOJO
- 2025-05-28 Listed for Rent $1,200 SHOWMOJO
- 2005-11-29 Sold (MLS) $149,500 Stellar MLS as Distributed by MLS Grid
- 2005-10-24 Listed $149,000 Stellar MLS as Distributed by MLS Grid
- 2004-11-01 Sold (MLS) $122,900 Stellar MLS as Distributed by MLS Grid
- 2004-09-24 Sold (MLS) $118,900 Stellar MLS as Distributed by MLS Grid
- 2004-09-23 Sold (MLS) $119,900 Stellar MLS as Distributed by MLS Grid
- 2004-08-26 Sold (MLS) $110,400 Stellar MLS as Distributed by MLS Grid
- 2004-08-05 Sold (MLS) $109,400 Stellar MLS as Distributed by MLS Grid
- 2004-05-21 Listed $110,400 Stellar MLS as Distributed by MLS Grid
- 2004-05-21 Listed $122,900 Stellar MLS as Distributed by MLS Grid
- 2004-04-19 Listed $109,900 Stellar MLS as Distributed by MLS Grid
- 2004-04-19 Listed $109,900 Stellar MLS as Distributed by MLS Grid
- 2004-04-19 Listed $118,900 Stellar MLS as Distributed by MLS Grid
Cash-flow waterfall
monthlySold comps — $/sqft
last 12 mo · ≤1 miLoading sold comps…