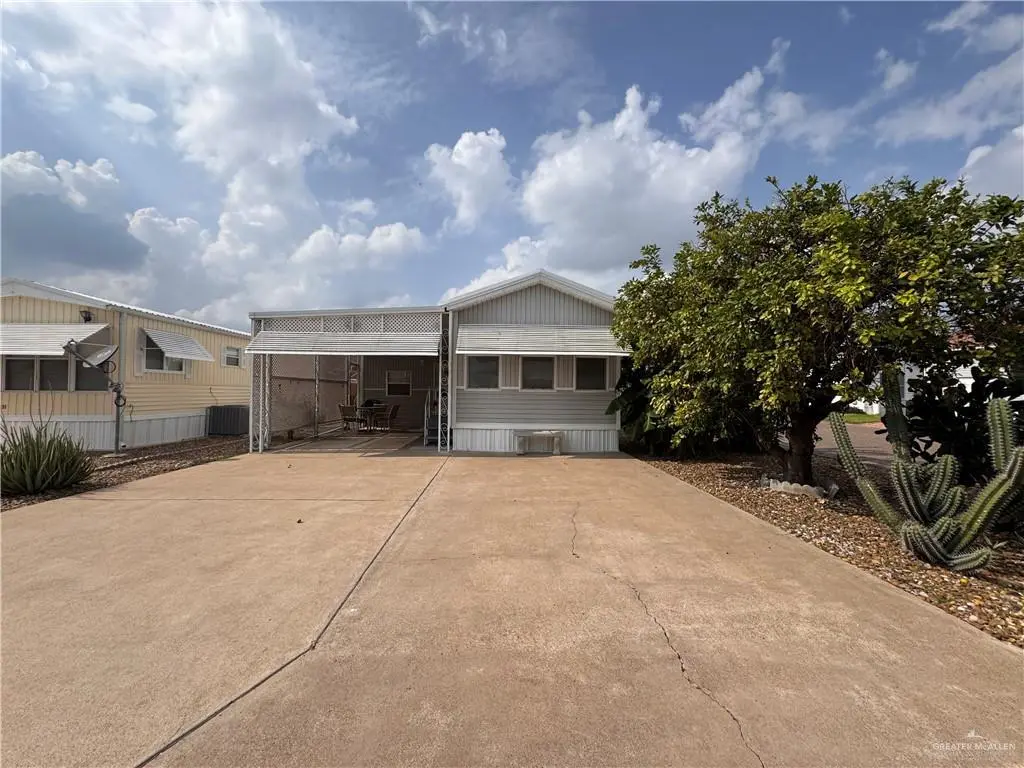
1433 E Daytona Dr · Mission, TX
Flood risk 1/10 · Minimal
- FEMA flood zone
- X
- Chance of flooding over 30 yrs
- 0.0%
- Est. flood insurance / yr
- $507 – $1,088
Fire risk 2/10 · Minimal
- Est. fire insurance / yr
- $1,222 – $2,270
Heat risk 9/10 · Severe
- Hot days now (above 111°F)
- 7 days/yr
- Hot days in 30 yrs
- 21 days/yr
Wind risk 8/10 · Major
- Chance of severe wind over 30 yrs
- 94.0%
Air-quality risk 2/10 · Minimal
- Unhealthy air days now
- 1 days/yr
- Unhealthy air days in 30 yrs
- 2 days/yr
Risk factors via First Street. Map © Google.
Why this score? — see what drove the B- grade
The composite is a weighted blend of 9 inputs, each scored 0–100. Each bar is that input's sub-score; the figure is the points it added to the 100-point composite (weight × sub-score).
- Cash flow +30.0/30.0
- DSCR +10.0/10.0
- 1% rule +9.3/10.0
- ARV discount +7.5/15.0
- Livability +3.8/5.0
- Rent growth +2.7/5.0
- Condition / age +2.5/5.0
- Schools +1.7/10.0
- Appreciation +0.0/10.0
$79,000
🖨 Deal sheet 📄 Offer letter ✓ Due diligence
Listing remarks
Welcome to one of the most desirable 55+ communities in the area. Located in the Wintergreen Estates community in North Mission, just north of the Expressway, this well maintained and spacious 2 bedroom, 1.5 bath mobile home offers comfort, convenience, and an active lifestyle on a corner lot. The home comes fully equipped with all appliances. Enjoy generous room sizes, abundant natural light, and plenty of storage. Residents of this welcoming community enjoy access to great amenities and a friendly neighborhood atmosphere. Conveniently located near shopping, dining, medical facilities, and major roadways, this home is an excellent opportunity for year round living or a winter retreat. Sche
Key facts
- 1,924 sq ft lot
- Parking
- Built 1998
Tags
Property features AI
Finance
- HOA & community: No homeowners association; Community pool; Senior community
Exterior
- Parking: Covered parking (1 space); Carport (1 space); Total of 1 parking space
- Security: Smoke detectors
- Utilities: City sewer
- Home design: Frame/wood construction; Slab foundation
- Construction: Frame/wood construction; Slab foundation; Other roof type
- Exterior features: Covered patio; Fenced yard (other type); Sidewalks; Paved road access
Interior
- Kitchen: Electric cooktop; Refrigerator; Electric water heater
- Flooring: Carpet; Tile
- Bathrooms: One full bathroom; One half bathroom
- Heating & cooling: Central heating; Central air conditioning
- Interior features: Laminate countertops; Washer present; Window coverings; Carpet and tile flooring
- Laundry & utility: Laundry area
Neighborhood map
What this means for you Summary
Snapshot
- This is a 2-bed/1.0-bath manufactured listed at $79k.
Deal economics
- At list price, monthly cash flow is $366 ($4k/yr) — positive.
- The deal already cash-flows at list — no discount required.
- Meets the 1% rule at list price ($1k rent vs $79k).
- Recommended offer: $78k (1.5% below list) — sets the bar for market timing.
- Cap rate 11.9% vs local median 3.5% in Mission — top-decile yield for the area; either an underpriced asset or a hidden risk that comps aren't pricing in. Stress-test before assuming the spread holds.
Location & tenants
- Location reads 75/100 on livability (#148 in TX, #4,155 nationally) — a middle-class / working-renter tenant base. Strengths: cost of living A+, housing A+, health & safety A+; Watch: amenities F, commute F, employment D-.
- Mission CISD (urban): math 15% / reading 28% proficiency, ranked #775 of 826 in TX (top 94%) — low school quality limits family demand, transient renter base, plan for 1-2y turnover; 78% free/reduced lunch — lower-income household profile, screen leases tightly.
- Zoned schools: Bryan El (math 17% / reading 32%, grade F, #3,052 of 4,322 statewide, top 74%, 651 students, 71% FRL); Mission J H (math 13% / reading 26%, grade F, #1,445 of 1,662 statewide, top 88%, 680 students, 78% FRL); Veterans Memorial H S (math 19% / reading 44%, grade F, #1,073 of 1,632 statewide, top 66%, 1,932 students, 81% FRL) — zoned schools at 77% FRL track the district average.
- Market conditions: Rents flat; 852 active listings in the ZIP; 40 comparable units currently listed for rent nearby; rentals lingering (median 44d on market — plan ~5-8 weeks vacancy on turnover, expect pricing pressure); 58% of comp listings sitting > 30 days — soft ceiling on asking rent; 7,378 units permitted in Hidalgo County in 2024 (641 in 5+ unit buildings).
Forward outlook
- Local home prices are declining (-3.0%/yr); year-one equity from $546 of loan paydown is wiped out by about $2k of value loss. Plan a longer hold.
- Hidalgo County population projected at +28% by 2050 — long-run rental-demand tailwind backs the buy-and-hold thesis.
- At projected returns (-3.0% appreciation + 0.9% rent growth), your $22k cash investment doubles in ~8 years — after that, you're playing with house money.
Negotiation context
- It's been on market 17 days — a 2% lower offer ($78k) is reasonable based on typical stale-listing flexibility.
Risks & watch-outs
- Climate carrying-cost: severe wind risk, 94% chance of damaging wind over 30y; extreme-heat days projected 7→21/yr by 2055 (HVAC capex compounding) — expect insurance premiums to compound above CPI over the hold.
Questions for the listing agent
- Is there a deadline driving the sale (1031 exchange, divorce, estate, relocation)? That informs how much negotiation room exists.
- What's the average days-on-market for RENTAL listings here right now (not sales)? A rising rental-DOM trend means longer vacancies and softer asking-rent achievability than the comps imply.
- What's the recent tenant-quality profile in this submarket — average credit score on applications, eviction rate, late-payment / NSF rate, and stable-employment percentage? A property-management company in the area should have these aggregated.
- How much new for-sale + rental construction is in the pipeline within 1–3 miles? Heavy new supply typically softens prices + rents 12–24 months out; constrained supply supports both.
Investment metrics
- 1% rule
- 1.43% ✓
- Cap rate
- 11.85%
- Cash-on-cash
- 19.86%
- DSCR
- 1.88
- GRM
- 5.8
CMA / ARV
No comps found within radius.
Projected returns pro-forma
-3.0% appreciation · 0.93% rent growth · sell at horizon
- IRR
- 9.7%
- Equity multiple
- 1.37×
- Total profit
- $8,213
- Equity at exit
- $11,779
- IRR
- 17.0%
- Equity multiple
- 2.27×
- Total profit
- $28,112
- Equity at exit
- $6,830
Cash invested: $22,120 (down + closing). Projections, not guarantees.
Landlord ↔ Tenant lean methodology
- Overall (STATE)
- 87 Strongly Landlord-Friendly
- State Texas
- 87 Strongly Landlord-Friendly · R+5
- County
- — inherits STATE
- City
- — inherits STATE
ZIP-level market 78572
- Home prices YoY
- -22.9%
- Rents YoY
- 0.9%
- Active inventory
- 852
- Price-to-rent
- 5.8×
Monthly cashflow live
- Estimated rent
- $1,131 high interval (Pro) →
- Mortgage (P&I)
- −$414
- Tax from tax record
- −$80 /mo · $964/yr
- Insurance
- −$33
- HOA
- −$0
- Vacancy / Maint / Mgmt
- −$238
- Net cashflow
- $366
Break-even live
UW: 25.0% down · 7.5% · 30yr · 1.5% tax · 5.0% vac · 8.0% maint · 8.0% mgmt
Financing live
Cash to close
- Down payment
- $19,750
- Closing costs
- $2,370
- Reserves months
- —
- Total cash needed
- —
Loan-product check · same deal, 3 products live
Conventional
25% down · 7.5% · 30yr
- Down + closing
- —
- Monthly P&I
- —
- Monthly cashflow
- —
- DSCR
- —
- Eligible?
- —
Personal DTI + credit; lowest rate.
DSCR
20% down · 8.5% · 30yr
- Down + closing
- —
- Monthly P&I
- —
- Monthly cashflow
- —
- DSCR
- —
- Eligible?
- —
No personal income docs; deal must DSCR.
Hard money
10% down · 12.0% · 12mo
- Down + closing
- —
- Monthly P&I
- —
- Monthly cashflow
- —
- DSCR
- —
- Eligible?
- —
Short-term bridge; refi at stabilization.
Rent comps 40 comps
| Address | Beds | Baths | Sqft | Rent | $/sqft | DOM | Units | Dist |
|---|---|---|---|---|---|---|---|---|
| 1511 Evergreen Ave Mission, TX | 3.0 | 2.0 | 1286 | $1,300 | $1.01 | 43d | 1 | 0.20mi |
| 100 Yosemite Dr Unit 1 Mission, TX | 3.0 | 2.0 | 1195 | $1,375 | $1.15 | 43d | 1 | 0.21mi |
| 101 San Jose Dr Apt 4 Mission, TX | 3.0 | 2.0 | 1195 | $1,375 | $1.15 | 23d | 1 | 0.21mi |
| 101 San Jose Dr Apt 3 Mission, TX | 3.0 | 2.0 | 1195 | $1,350 | $1.13 | 43d | 1 | 0.21mi |
| 101 San Jose Dr Apt 4 Mission, TX | 3.0 | 2.0 | 1195 | $1,375 | $1.15 | 43d | 1 | 0.21mi |
| 105 San Jose Dr Unit 1 Mission, TX | 3.0 | 2.0 | 1195 | $1,345 | $1.13 | 14d | 1 | 0.22mi |
| 105 San Jose Dr Unit 1 Mission, TX | 3.0 | 2.0 | 1195 | $1,345 | $1.13 | 18d | 1 | 0.22mi |
| 105 San Jose Dr Unit 4 Mission, TX | 3.0 | 2.0 | 1195 | $1,350 | $1.13 | 43d | 1 | 0.22mi |
| 103 Yosemite Dr Unit 2 Mission, TX | 3.0 | 2.0 | 1116 | $1,375 | $1.23 | 43d | 1 | 0.23mi |
| 106 S Bryan Rd Unit 13 Mission, TX | 2.0 | 1.0 | 720 | $725 | $1.01 | 43d | 1 | 0.32mi |
| 106 S Bryan Rd Mission, TX | 2.0 | 1.0 | — | $750 | — | 43d | 1 | 0.32mi |
| 1024 Matamoros St Mission, TX | 2.0 | 2.0 | — | $1,200 | — | 43d | 1 | 0.44mi |
| 405 Cory Dr Mission, TX | 2.0 | 1.0 | 832 | $750 | $0.90 | 21d | 1 | 0.55mi |
| 402 Cory Dr Unit B-10 Mission, TX | 2.0 | 1.0 | 714 | $750 | $1.05 | 43d | 1 | 0.55mi |
| 1004 N Stewart Rd Unit 1012-07 Mission, TX | 1.0 | 1.0 | 250 | $475 | $1.90 | 43d | 1 | 0.61mi |
| 513 San Antonio Ave Apt 8 Mission, TX | 1.0 | 1.5 | 971 | $975 | $1.00 | 43d | 1 | 0.66mi |
| 600 San Antonio Ave Unit 7 Mission, TX | 2.0 | 2.0 | 900 | $880 | $0.98 | 43d | 1 | 0.70mi |
| 606 San Antonio Ave Unit 1 Mission, TX | 2.0 | 2.0 | 900 | $850 | $0.94 | 23d | 1 | 0.71mi |
| 606 San Antonio Ave Unit 4 Mission, TX | 2.0 | 2.0 | 900 | $895 | $0.99 | 21d | 1 | 0.71mi |
| 606 San Antonio Ave Unit 606-4 Mission, TX | 2.0 | 1.0 | 900 | $850 | $0.94 | 43d | 1 | 0.71mi |
| 707 N Keralum Ave #2 Mission, TX | 2.0 | 1.0 | — | $700 | — | 43d | 1 | 0.74mi |
| 816 Travis St Mission, TX | 1.0–2.0 | 1.0–2.0 | 952 | $1,215 | $1.28 | 43d | 12 | 0.75mi |
| 813 Travis St #207 Mission, TX | 3.0 | 2.0 | 1320 | $1,600 | $1.21 | 23d | 1 | 0.79mi |
| 813 Travis St #408 Mission, TX | 3.0 | 2.0 | 1230 | $1,800 | $1.46 | 23d | 1 | 0.79mi |
| 1822 Sunset Dr Mission, TX | 3.0 | 2.5 | 1631 | $1,850 | $1.13 | 14d | 1 | 0.82mi |
| 900 Travis St Mission, TX | 1.0–2.0 | 1.0–2.0 | 1053 | $1,250 | $1.19 | 14d | 1 | 0.85mi |
| 2105 Selena St Mission, TX | 3.0 | 2.0 | 1100 | $1,500 | $1.36 | 14d | 1 | 0.85mi |
| 2009 Selena St Mission, TX | 3.0 | 2.0 | 4400 | $1,350 | $0.31 | 43d | 1 | 0.85mi |
| 1923 Sunset Dr Mission, TX | 3.0 | 2.5 | 1499 | $1,850 | $1.23 | 21d | 1 | 0.91mi |
| 1927 Sunset Dr Mission, TX | 3.0 | 2.0 | 1827 | $1,900 | $1.04 | 44d | 1 | 0.92mi |
| 1918 Angus St Unit 3 Mission, TX | 2.0 | 2.0 | — | $950 | — | 43d | 1 | 0.93mi |
| 2007 Cassandra St Mission, TX | 3.0 | 2.5 | 1422 | $2,500 | $1.76 | 14d | 1 | 0.94mi |
| 2002 E 1st St Mission, TX | 3.0 | 2.0 | 1017 | $1,300 | $1.28 | 43d | 1 | 0.94mi |
| 2000 Angus St S Unit 2 Mission, TX | 3.0 | 2.0 | 4140 | $1,350 | $0.33 | 43d | 1 | 0.96mi |
| 2004 Angus St Mission, TX | 3.0 | 2.0 | 1150 | $975 | $0.85 | 43d | 1 | 0.98mi |
| 1006 Fairway Dr Mission, TX | 2.0 | 2.0 | 1072 | $1,100 | $1.03 | 43d | 1 | 1.01mi |
| 104 Sunflower St Unit 5 Mission, TX | 3.0 | 2.0 | 950 | $1,550 | $1.63 | 14d | 1 | 1.02mi |
| 1002 N Glasscock Rd Unit 3 Mission, TX | 3.0 | 2.0 | — | $1,300 | — | 14d | 1 | 1.02mi |
| 2009 Selena St Unit 1 Mission, TX | 3.0 | 2.0 | — | $1,350 | — | 23d | 1 | 1.02mi |
| 1707 Highland Park Ave Unit 4-B Mission, TX | 2.0 | 2.0 | 1336 | $1,200 | $0.90 | 14d | 1 | 1.02mi |
Listing history 12 events
-
2026-06-18days on market $79,000 Active 17 DOM
-
2026-06-17days on market $79,000 Active 16 DOM
-
2026-06-16days on market $79,000 Active 15 DOM
-
2026-06-15days on market $79,000 Active 14 DOM
-
2026-06-14days on market $79,000 Active 12 DOM
-
2026-06-10days on market $79,000 Active 9 DOM
-
2026-06-09days on market $79,000 Active 8 DOM
-
2026-06-08days on market $79,000 Active 7 DOM
-
2026-06-07days on market $79,000 Active 6 DOM
-
2026-06-03days on market $79,000 Active 2 DOM
-
2026-06-02remarks 699-char remark
-
2026-06-02$79,000 Active 1 DOM
ⓘ Source: listings_history table (triggers on properties + properties_extension) + one-shot
backfill from property_details.listing_events for pre-trigger history.
Tax reassessment forecast TX · Resets to sale price
- Current annual tax
- $964 · $80/mo
- Projected year-2 tax
- $1,446 · $120/mo
- Expected delta
- +$482/yr (+$40/mo · 50.0%)
ⓘ Screening estimate from a state-policy table — verify with the county assessor before closing.
Climate risk First Street
- Flood 1/10 Low FEMA zone X · 0% chance over 30 yrs
- Wildfire 2/10 Low
- Heat 9/10 Extreme 7 d/yr ≥111°F today · 21 d/yr by 30 yrs out
- Wind 8/10 Severe 94% chance of damaging wind over 30 yrs
- Air quality 2/10 Low 1 unhealthy d/yr today · 2 by 30 yrs out
Nearby sold comps map
Loading sold comps map…
Walkable amenities ~0.75 mi
Loading nearby amenities…
Taxation est. · year 1
- Rental income
- $13,574
- − Mortgage interest
- −$4,425
- − Property taxes
- −$964
- − Insurance
- −$395
- − Repairs & maintenance
- −$1,086
- − Management
- −$1,086
- − Depreciation
- −$2,298
- Taxable income
- $3,320
- Est. tax owed @ 24.0%
- −$797
- After-tax cash flow
- $3,596/yr
For passive investors: Depreciation is non-cash, so a rental often shows a tax loss while cash-flowing — sheltering income. Rental losses are passive: they offset passive income freely, and up to $25,000/yr can offset ordinary (W-2) income if you actively participate and your MAGI is under $100k (phasing out to $0 by $150k); unused losses carry forward. On sale, claimed depreciation is recaptured at up to 25%, and gains may owe capital-gains tax (a 1031 exchange can defer both). Figures are a year-1 estimate at your 24.0% rate — not tax advice; consult a CPA.
Schools (NCES district)
- District
- Mission CISD
- NCES district ID
- 4831040
- Math proficiency
- 15% ▼ -35.00%
- Reading proficiency
- 28% ▼ -15.00%
- Median HH income
- $32,855
- Composite
- 17.47/100
- National rank
- #9061
- State rank
- #775 of 826 in TX
Livability — Mission
- Score
- 75/100
- State rank
- #148
- US rank
- #4155
Category grades
Schools grade is shown separately in the Schools card above.
Census & demographics
- Census place
- Mission, TX
- County
- Hidalgo County · 623,128 people
- City population
- 78,024
- Metro
- McAllen-Edinburg-Mission, TX
- Population (ZIP)
- 78,024
- Household income
- $54,298
- Rent vs Own
- Severe rent burden
- 1714.0
Population outlook (Hidalgo County) Hauer SSP2
- Today (2025)
- 955,232 people
- By 2030
- 1,009,774 · +5.7%
- By 2040
- 1,120,332 · +17.3%
- By 2050
- 1,225,036 · +28.2%
- By 2075
- 1,439,189 · +50.7%
- By 2100
- 1,533,429 · +60.5%
Race, ethnicity, and origin ACS 2023
- Neighborhood character
- Predominantly Hispanic (85%)
- Race & ethnicity
- Hispanic / Latino 85% Two or more races 47% White 12% Asian 2%
- Hispanic origin (detail)
- Mexican 80%
- Common ancestry
- Slovak 1% Portuguese 0%
- Foreign-born
- 28% · Canada, South Korea
- Languages at home
- 22% English-only · Spanish 76%
Political lean MEDSL · Hidalgo
- 2024 margin
- Toss-up / Even · D 48.1% · R 51.0%
- 2008→2024 swing
- -41.6pp toward R · 2008: 38.7pp · 2024: -2.9pp
- All cycles
- 2024: R+2.9 2020: D+17.1 2016: D+40.5 2012: D+41.8 2008: D+38.7
Not yet ingested
- Civics
- —
Market trends
- HPI YoY
- ▼ -62.35%
- Current HPI
- 209.3573
- Rent YoY
- ▲ 0.93%
- Metro
- McAllen-Edinburg-Mission, TX
- State GDP YoY
- ▲ 3.95%
- F500 in state
- 110
Industry mix (Fortune 500 HQ in TX)
| Industry | F500 HQs | Revenue |
|---|---|---|
| Energy | 16 | $1,198B |
|
||
| Technology | 5 | $198B |
|
||
| Engineering / Construction | 4 | $72B |
|
||
| Energy Services | 3 | $60B |
|
||
| Utilities | 3 | $41B |
|
||
| Healthcare | 2 | $330B |
|
||
Price history
3 events — show timeline
- 2026-06-01 Listed $79,000 MCALLENMLS
- 2026-02-27 Sold (Public Records) — Public Records
- 2020-12-28 Sold (Public Records) — Public Records
Property tax history
+2.8%/yrLatest (2025): $964 · +20.0% YoY. Source: county tax records.
Cash-flow waterfall
monthlySold comps — $/sqft
last 12 mo · ≤1 miLoading sold comps…