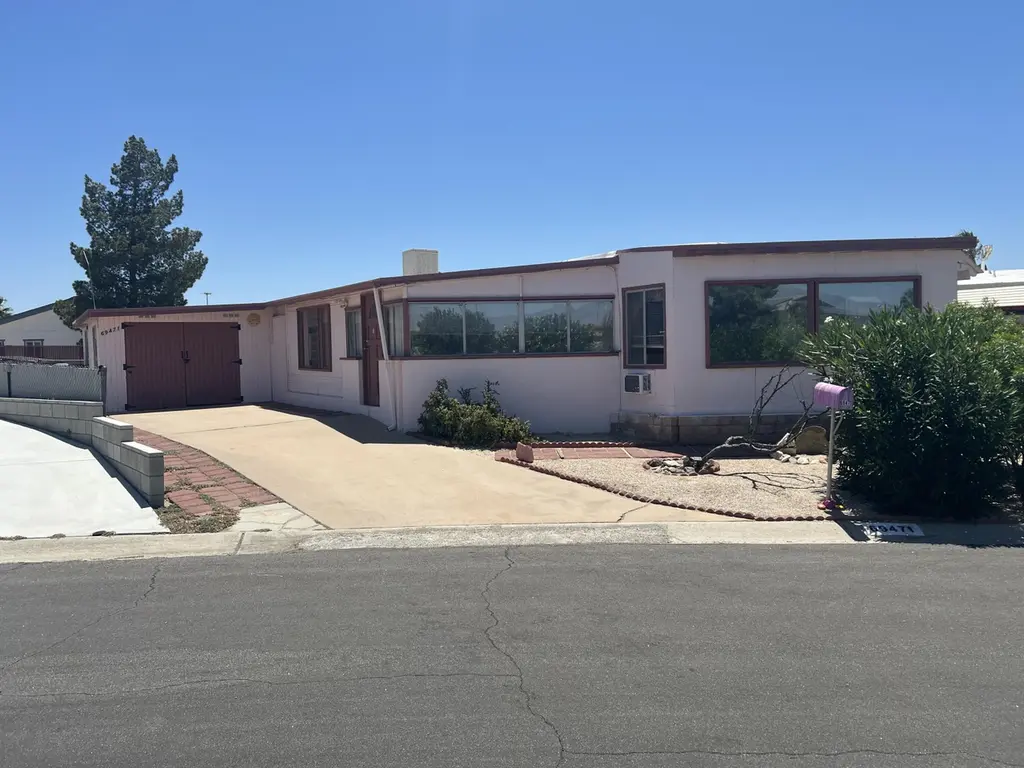
69471 Country Club Dr · Desert Edge, CA
Flood risk 1/10 · Minimal
- FEMA flood zone
- X (unshaded)
- Chance of flooding over 30 yrs
- 0.0%
- Est. flood insurance / yr
- $507 – $1,088
Fire risk 5/10 · Moderate
- Est. fire insurance / yr
- $659 – $1,223
Heat risk 8/10 · Major
- Hot days now (above 109°F)
- 7 days/yr
- Hot days in 30 yrs
- 20 days/yr
Wind risk 1/10 · Minimal
- Chance of severe wind over 30 yrs
- —
Air-quality risk 5/10 · Moderate
- Unhealthy air days now
- 8 days/yr
- Unhealthy air days in 30 yrs
- 11 days/yr
Risk factors via First Street. Map © Google.
Why this score? — see what drove the C grade
The composite is a weighted blend of 9 inputs, each scored 0–100. Each bar is that input's sub-score; the figure is the points it added to the 100-point composite (weight × sub-score).
- Cash flow +22.1/30.0
- ARV discount +11.4/15.0
- DSCR +7.1/10.0
- 1% rule +5.8/10.0
- Livability +3.4/5.0
- Schools +2.7/10.0
- Rent growth +2.5/5.0
- Condition / age +2.5/5.0
- Appreciation +0.0/10.0
$145,000
🖨 Deal sheet 📄 Offer letter ✓ Due diligence
Listing remarks
Comfortable and well-maintained 2-bedroom, 1-bath and a half, home featuring unobstructed views of the Desert Hills and San Jacinto Mountains. Conveniently situated directly across from the community clubhouse, this home is offered furnished and includes all appliances, providing a move-in ready opportunity for seasonal or full-time residents. The property offers ample parking with a one-car garage and extended driveway. An infrared sauna in the garage adds a unique bonus feature for relaxation and wellness. Located in the desirable Desert Crest Country Club, a 55+ senior community where you OWN THE LAND (no space rent!) Low HOA fee of just $152/month, which includes access to exceptional c
Key facts
- Infrared sauna
- Community clubhouse
- Unobstructed views
Tags
Property features AI
Finance
- Other: Property sold with appliances and furniture (some personal property excluded)
- Financial info: Sale terms: Cash or private financing available; Short term rentals not allowed; Will not consider lease
- HOA & community: Monthly HOA fee; HOA fee: $152 per month; Community is a senior community; Gated: No
Exterior
- Parking: Attached garage (1 car); Covered parking (1 space); Driveway parking; Total of 4 parking spaces (2 uncovered/assigned spaces noted)
- Security: No security features
- Utilities: Sewer connected and paid; Not a PUD
- Home design: One-story (single level); Has desert and mountain views
- Construction: Year built per assessor;
- Exterior features: Detached property; Community in-ground pool; Community heated in-ground spa; Community amenities include clubhouse, fitness center, banquet facilities, card room, billiard room, golf (par 3), pet rules
Interior
- Kitchen: All appliances included
- Bedrooms:
- Flooring: Laminate flooring
- Bathrooms: 1 full bathroom; 1 half bathroom
- Heating & cooling: Central heating with forced air; Ceiling fans; Wall/window air conditioning units
- Interior features: Furnished; Living room
- Laundry & utility:
Neighborhood map
What this means for you Summary
Snapshot
- This is a 2-bed/1.0-bath manufactured listed at $145k.
Deal economics
- At list price, monthly cash flow is $234 ($3k/yr) — positive.
- The deal already cash-flows at list — no discount required.
- Meets the 1% rule at list price ($2k rent vs $145k).
- Recommended offer: $141k (3.0% below list) — sets the bar for market timing.
- Cap rate 8.2% vs local median 14.8% in Desert Edge — below-typical yield; the buyer is paying a premium for something (appreciation thesis, condition, location) that the cap rate doesn't capture.
Location & tenants
- Location reads 68/100 on livability (#297 in CA) — a middle-class / working-renter tenant base. Strengths: cost of living A+, housing A+; Watch: crime C-, schools F, commute D-.
- Palm Springs Unified (suburban): math 21% / reading 42% proficiency, ranked #328 of 517 in CA (top 63%) — families likely to look elsewhere, expect single-tenant / working-renter base with shorter leases; 73% free/reduced lunch — lower-income household profile, screen leases tightly.
- Market conditions: 216 active listings in the ZIP; 5 comparable units currently listed for rent nearby; rentals lingering (median 44d on market — plan ~5-8 weeks vacancy on turnover, expect pricing pressure); 60% of comp listings sitting > 30 days — soft ceiling on asking rent; 9,195 units permitted in Riverside County in 2024 (1,512 in 5+ unit buildings).
Forward outlook
- Local home prices are declining (-3.0%/yr); year-one equity from $1k of loan paydown is wiped out by about $4k of value loss. Plan a longer hold.
- Riverside County population projected at +22% by 2050 — long-run rental-demand tailwind backs the buy-and-hold thesis.
Negotiation context
- It's been on market 35 days — a 3% lower offer ($141k) is reasonable based on typical stale-listing flexibility.
Risks & watch-outs
- Climate carrying-cost: moderate wildfire risk; extreme-heat days projected 7→20/yr by 2055 (HVAC capex compounding) — expect insurance premiums to compound above CPI over the hold.
Questions for the listing agent
- It's been on market 35 days. Have you received any prior offers? Is the seller open to a 3% concession, seller financing, or rate buy-down credit?
- Built in 1965 — when were the roof, HVAC, electrical panel, plumbing, and water heater last replaced?
- What does the HOA fee cover, when was the last increase, and are there any pending special assessments or reserve-fund shortfalls?
- Is there a deadline driving the sale (1031 exchange, divorce, estate, relocation)? That informs how much negotiation room exists.
- Schools are F-rated, which usually means shorter tenancies and higher turnover. Who's the typical renter profile here, and what's been the actual vacancy rate?
- What's the average days-on-market for RENTAL listings here right now (not sales)? A rising rental-DOM trend means longer vacancies and softer asking-rent achievability than the comps imply.
- What's the recent tenant-quality profile in this submarket — average credit score on applications, eviction rate, late-payment / NSF rate, and stable-employment percentage? A property-management company in the area should have these aggregated.
- How much new for-sale + rental construction is in the pipeline within 1–3 miles? Heavy new supply typically softens prices + rents 12–24 months out; constrained supply supports both.
Investment metrics
- 1% rule
- 1.08% ✓
- Cap rate
- 8.23%
- Cash-on-cash
- 6.93%
- DSCR
- 1.31
- GRM
- 7.7
CMA / ARV
- ARV (median comp)
- $158,817
- List price
- $145,000
- Delta
- -8.70%
- Verdict
- FAIR
- Comps
- 20 within 1.0 mi
Show comp detail 12 sales within ~0.75 mi
| Address | Dist | Beds/Ba | Sqft | Sold | Price | $/sf | Match |
|---|---|---|---|---|---|---|---|
| 16725 Camino Mirasol Dr | 0.19mi | 2/2.0 | 1,248 (-2%) | 8mo | $165,000 | $132 | 78 |
| 69500 Poolside | 0.01mi | 2/2.0 | 1,440 (+14%) | 2mo | $140,000 | $97 | 72 |
| 69266 Midpark Dr | 0.24mi | 2/2.0 | 1,200 (-5%) | 9mo | $90,000 | $75 | 69 |
| 69303 Golden Dr W | 0.28mi | 2/2.0 | 1,344 (+6%) | 7mo | $160,000 | $119 | 67 |
| 69280 Fairway Dr | 0.36mi | 2/2.0 | 1,320 (+4%) | 8mo | $148,000 | $112 | 66 |
| 69300 Fairway Dr | 0.34mi | 2/2.0 | 1,152 (-9%) | 1mo | $109,000 | $95 | 64 |
| 16821 Lakeside Ct | 0.22mi | 3/2.0 (+1) | 1,368 (+8%) | 5mo | $170,000 | $124 | 64 |
| 69525 Dillon Rd #88 | 0.43mi | 3/2.0 (+1) | 1,248 (-2%) | 6mo | $180,000 | $144 | 63 |
| 16740 Vista Del Sol | 0.28mi | 2/2.0 | 1,152 (-9%) | 9mo | $200,000 | $174 | 60 |
| 16411 Vista Cerro | 0.21mi | 2/2.0 | 1,430 (+13%) | 6mo | $195,000 | $136 | 59 |
| 69237 Westwood Ct | 0.32mi | 3/2.0 (+1) | 1,420 (+12%) | 4mo | $160,000 | $113 | 53 |
| 16400 El Segundo Way | 0.35mi | 2/2.0 | 1,440 (+14%) | 10mo | $184,500 | $128 | 49 |
Match score weights: distance 35% · size 25% · config 20% · recency 20%. Top-matched comps best support the ARV.
Projected returns pro-forma
-3.0% appreciation · 3.0% rent growth · sell at horizon
- IRR
- -5.7%
- Equity multiple
- 0.79×
- Total profit
- $-8,542
- Equity at exit
- $21,620
- IRR
- 4.0%
- Equity multiple
- 1.29×
- Total profit
- $11,893
- Equity at exit
- $12,537
Cash invested: $40,600 (down + closing). Projections, not guarantees.
Landlord ↔ Tenant lean methodology
- Overall (STATE)
- 18 Strongly Tenant-Friendly
- State California
- 18 Strongly Tenant-Friendly · D+13
- County
- — inherits STATE
- City
- — inherits STATE
ZIP-level market 92241
- Home prices YoY
- -22.8%
- Active inventory
- 216
- Price-to-rent
- 7.7×
Monthly cashflow live
- Estimated rent
- $1,572 high interval (Pro) →
- Mortgage (P&I)
- −$760
- Tax from tax record
- −$35 /mo · $418/yr
- Insurance
- −$60
- HOA
- −$152
- Vacancy / Maint / Mgmt
- −$330
- Net cashflow
- $234
Break-even live
UW: 25.0% down · 7.5% · 30yr · 1.5% tax · 5.0% vac · 8.0% maint · 8.0% mgmt
Financing live
Cash to close
- Down payment
- $36,250
- Closing costs
- $4,350
- Reserves months
- —
- Total cash needed
- —
Loan-product check · same deal, 3 products live
Conventional
25% down · 7.5% · 30yr
- Down + closing
- —
- Monthly P&I
- —
- Monthly cashflow
- —
- DSCR
- —
- Eligible?
- —
Personal DTI + credit; lowest rate.
DSCR
20% down · 8.5% · 30yr
- Down + closing
- —
- Monthly P&I
- —
- Monthly cashflow
- —
- DSCR
- —
- Eligible?
- —
No personal income docs; deal must DSCR.
Hard money
10% down · 12.0% · 12mo
- Down + closing
- —
- Monthly P&I
- —
- Monthly cashflow
- —
- DSCR
- —
- Eligible?
- —
Short-term bridge; refi at stabilization.
Rent comps 5 comps
| Address | Beds | Baths | Sqft | Rent | $/sqft | DOM | Units | Dist |
|---|---|---|---|---|---|---|---|---|
| 69470 Midpark Dr Desert Hot Springs, CA | 1.0 | 1.0 | 1298 | $1,500 | $1.16 | 43d | 1 | 0.12mi |
| 69510 Parkside Dr Desert Hot Springs, CA | 1.0 | 1.0 | 1150 | $1,450 | $1.26 | 43d | 1 | 0.14mi |
| 13762 Starlight Way Desert Hot Springs, CA | 3.0 | 2.0 | 1601 | $3,500 | $2.19 | 24d | 1 | 1.36mi |
| 18070 Langlois Rd Dsrt Hot Spgs, CA | 2.0 | 2.0 | 950 | $1,850 | $1.95 | 24d | 1 | 1.48mi |
| 18070 Langlois Rd #257 Desert Hot Springs, CA | 2.0 | 2.0 | 1056 | $1,850 | $1.75 | 43d | 1 | 1.48mi |
HOA detail
- Monthly dues
- $152 · $1,824/yr
Listing history 15 events
-
2026-06-18days on market $145,000 Active 35 DOM
-
2026-06-17days on market $145,000 Active 34 DOM
-
2026-06-16days on market $145,000 Active 33 DOM
-
2026-06-15days on market $145,000 Active 32 DOM
-
2026-06-13days on market $145,000 Active 30 DOM
-
2026-06-13days on market $145,000 Active 29 DOM
-
2026-06-09days on market $145,000 Active 26 DOM
-
2026-06-08days on market $145,000 Active 25 DOM
-
2026-06-07days on market $145,000 Active 24 DOM
-
2026-06-04days on market $145,000 Active 21 DOM
-
2026-06-03days on market $145,000 Active 20 DOM
-
2026-06-02days on market $145,000 Active 19 DOM
-
2026-06-01days on market $145,000 Active 18 DOM
-
2026-05-31days on market $145,000 Active 17 DOM
-
2026-05-14$145,000 Active 1309-char remark
ⓘ Source: listings_history table (triggers on properties + properties_extension) + one-shot
backfill from property_details.listing_events for pre-trigger history.
Tax reassessment forecast CA · Resets to sale price
- Current annual tax
- $418 · $35/mo
- Projected year-2 tax
- $1,102 · $92/mo
- Expected delta
- +$684/yr (+$57/mo · 163.9%)
ⓘ Screening estimate from a state-policy table — verify with the county assessor before closing.
Climate risk First Street
- Flood 1/10 Low FEMA zone X (unshaded) · 0% chance over 30 yrs
- Wildfire 5/10 Major
- Heat 8/10 Severe 7 d/yr ≥109°F today · 20 d/yr by 30 yrs out
- Wind 1/10 Low
- Air quality 5/10 Major 8 unhealthy d/yr today · 11 by 30 yrs out
Nearby sold comps map
Loading sold comps map…
Walkable amenities ~0.75 mi
Loading nearby amenities…
Taxation est. · year 1
- Rental income
- $18,866
- − Mortgage interest
- −$8,122
- − Property taxes
- −$418
- − Insurance
- −$725
- − Repairs & maintenance
- −$1,509
- − Management
- −$1,509
- − HOA
- −$1,824
- − Depreciation
- −$4,218
- Taxable income
- $540
- Est. tax owed @ 24.0%
- −$130
- After-tax cash flow
- $2,683/yr
For passive investors: Depreciation is non-cash, so a rental often shows a tax loss while cash-flowing — sheltering income. Rental losses are passive: they offset passive income freely, and up to $25,000/yr can offset ordinary (W-2) income if you actively participate and your MAGI is under $100k (phasing out to $0 by $150k); unused losses carry forward. On sale, claimed depreciation is recaptured at up to 25%, and gains may owe capital-gains tax (a 1031 exchange can defer both). Figures are a year-1 estimate at your 24.0% rate — not tax advice; consult a CPA.
Schools (NCES district)
- District
- Palm Springs Unified
- NCES district ID
- 0629550
- Math proficiency
- 21% ▼ -7.00%
- Reading proficiency
- 42% ▬ 0.00%
- Median HH income
- $43,638
- Composite
- 26.76/100
- National rank
- #7131
- State rank
- #328 of 517 in CA
Livability — Desert Edge
- Score
- 68/100
- State rank
- #297
- US rank
- #9953
Category grades
Schools grade is shown separately in the Schools card above.
Census & demographics
- Census place
- Desert Edge, CA
- Population (ZIP)
- 8,624
Population outlook (Riverside County) Hauer SSP2
- Today (2025)
- 2,664,475 people
- By 2030
- 2,802,692 · +5.2%
- By 2040
- 3,050,904 · +14.5%
- By 2050
- 3,256,783 · +22.2%
- By 2075
- 3,655,058 · +37.2%
- By 2100
- 3,766,594 · +41.4%
Race, ethnicity, and origin ACS 2023
- Race & ethnicity
- White 50% Hispanic / Latino 46% Two or more races 16% Asian 2% Native American 1%
- Hispanic origin (detail)
- Mexican 36%
- Common ancestry
- Lithuanian 3% Slovak 2% Portuguese 2%
- Foreign-born
- 28% · Canada, South Korea
- Languages at home
- 57% English-only · Spanish 38% Chinese 1% Russian/Polish/Slavic 1%
Political lean MEDSL · Riverside
- 2024 margin
- Toss-up / Even · D 48.0% · R 49.3% · Other 2.6%
- 2008→2024 swing
- -3.6pp toward R · 2008: 2.3pp · 2024: -1.3pp
- All cycles
- 2024: R+1.3 2020: D+8.0 2016: D+4.3 2012: R+0.4 2008: D+2.3
Not yet ingested
- Civics
- —
Market trends
- HPI YoY
- ▼ -118.23%
- Current HPI
- 400.5663
- Rent YoY
- —
- Metro
- —
- State GDP YoY
- ▲ 3.21%
- F500 in state
- 116
Industry mix (Fortune 500 HQ in CA)
| Industry | F500 HQs | Revenue |
|---|---|---|
| Technology | 27 | $1,492B |
|
||
| Financial Services | 3 | $174B |
|
||
| Retail | 3 | $44B |
|
||
| Insurance | 3 | $26B |
|
||
| Media / Entertainment | 2 | $115B |
|
||
| Pharmaceuticals / Biotech | 2 | $62B |
|
||
Price history
1 event — show timeline
- 2026-05-14 Listed $145,000 GPSMLS
Property tax history
+1.6%/yrLatest (2025): $418 · -59.5% YoY. Source: county tax records.
Cash-flow waterfall
monthlySold comps — $/sqft
last 12 mo · ≤1 miLoading sold comps…