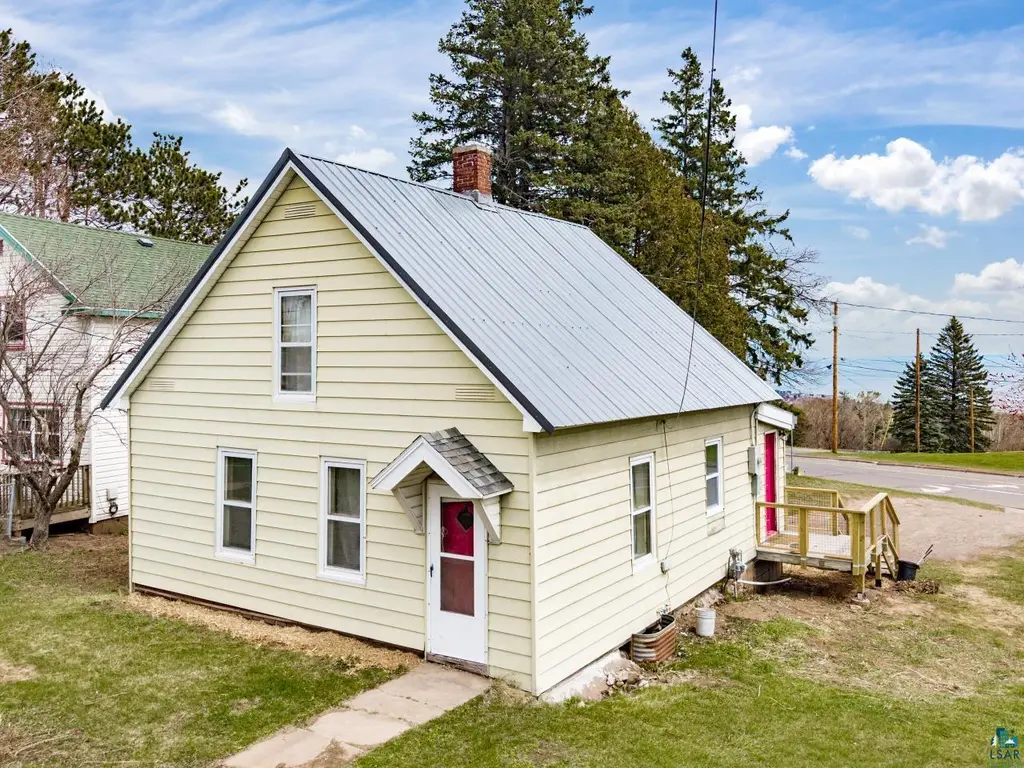
424 E 13th St · Duluth, MN
Flood risk 1/10 · Minimal
- FEMA flood zone
- X
- Chance of flooding over 30 yrs
- 0.0%
- Est. flood insurance / yr
- $473 – $860
Fire risk 1/10 · Minimal
- Est. fire insurance / yr
- $888 – $1,650
Heat risk 1/10 · Minimal
- Hot days now (above 91°F)
- 7 days/yr
- Hot days in 30 yrs
- 12 days/yr
Wind risk 1/10 · Minimal
- Chance of severe wind over 30 yrs
- —
Air-quality risk 2/10 · Minimal
- Unhealthy air days now
- 0 days/yr
- Unhealthy air days in 30 yrs
- 1 days/yr
Risk factors via First Street. Map © Google.
Why this score? — see what drove the B- grade
The composite is a weighted blend of 9 inputs, each scored 0–100. Each bar is that input's sub-score; the figure is the points it added to the 100-point composite (weight × sub-score).
- Cash flow +24.5/30.0
- ARV discount +15.0/15.0
- DSCR +7.9/10.0
- 1% rule +6.4/10.0
- Schools +4.2/10.0
- Livability +4.1/5.0
- Rent growth +3.7/5.0
- Condition / age +2.5/5.0
- Appreciation +0.0/10.0
$180,000
🖨 Deal sheet 📄 Offer letter ✓ Due diligence
Listing remarks MLS
Great views of Lake Superior and conveniently located in the middle of Duluth. This solid one-owner, 3 bedroom bungalow has a lot of potential. Come see it today for yourself!
Key facts
- Large corner lot
- Updated full bath
- Eat in kitchen
Tags
Property features AI
Exterior
- Parking: Gravel parking; no garage
- Utilities: Public water; Public sewer
- Home design: Single-family detached residence; Single-story; Entry level information not specified; Facing direction not specified
- Construction: Metal roof; Stone foundation; Built area above grade: 1,129
- Exterior features: Corner lot; Paved city street frontage; Has a view
Interior
- Kitchen: Range; Refrigerator; Dishwasher not listed
- Bedrooms: Master bedroom on the main level
- Bathrooms: 1 full bathroom; 1 half bathroom
- Heating & cooling: Forced air heating (natural gas); No cooling system
- Interior features: Master bedroom on the main level; Full unfinished basement
- Laundry & utility: Washer; Dryer; Forced air heating (natural gas)
Neighborhood map
What this means for you Summary
Snapshot
- This is a 3-bed/2.0-bath single-family listed at $180k.
Deal economics
- At list price, monthly cash flow is $370 ($4k/yr) — positive.
- The deal already cash-flows at list — no discount required.
- Meets the 1% rule at list price ($2k rent vs $180k).
- Recommended offer: $177k (1.5% below list) — sets the bar for market timing.
- Cap rate 8.8% vs local median 4.9% in Duluth — top-decile yield for the area; either an underpriced asset or a hidden risk that comps aren't pricing in. Stress-test before assuming the spread holds.
Location & tenants
- Location reads 82/100 on livability (#36 in MN, #1,060 nationally) — a professional / high-income tenant draw. Strengths: commute A+, cost of living A+, housing A+; Watch: amenities F.
- Duluth Public School District (urban): math 44% / reading 55% proficiency, ranked #132 of 301 in MN (top 44%) — families likely to look elsewhere, expect single-tenant / working-renter base with shorter leases.
- Market conditions: Rents rising fast (+4.6%/yr); 206 active listings in the ZIP; 18 comparable units currently listed for rent nearby; rentals leasing fast (median 14d on market — plan ~1-2 weeks tenant-placement turnaround); solid renter incomes; 639 units permitted in St. Louis County in 2024 (338 in 5+ unit buildings).
- This rent runs 31% of the median local income ($80k/yr) — at the standard rent-burdened threshold; future hikes will face affordability resistance.
Forward outlook
- Local home prices are declining (-3.0%/yr); year-one equity from $1k of loan paydown is wiped out by about $5k of value loss. Plan a longer hold.
- At projected returns (-3.0% appreciation + 4.6% rent growth), your $50k cash investment doubles in ~10 years — after that, you're playing with house money.
Negotiation context
- It's been on market 15 days — a 2% lower offer ($177k) is reasonable based on typical stale-listing flexibility.
- 2 sale attempts since 5y ago with the ask held roughly flat each time — persistent listings suggest the price (not the market) is what's stuck; bring a comps-based counter.
- Current owner paid $130k; 38% above their basis — modest negotiation headroom, anchor on the comps not their cost.
Risks & watch-outs
- Watch-outs: built in 1905 — expect roof / HVAC / electrical / plumbing capex.
Questions for the listing agent
- Built in 1905 — when were the roof, HVAC, electrical panel, plumbing, and water heater last replaced?
- Is there a deadline driving the sale (1031 exchange, divorce, estate, relocation)? That informs how much negotiation room exists.
- Schools are B-rated — typically a magnet for longer-tenancy family renters. What's the average tenant stay here, and is there a school-zone premium baked into asking?
- What's the average days-on-market for RENTAL listings here right now (not sales)? A rising rental-DOM trend means longer vacancies and softer asking-rent achievability than the comps imply.
- What's the recent tenant-quality profile in this submarket — average credit score on applications, eviction rate, late-payment / NSF rate, and stable-employment percentage? A property-management company in the area should have these aggregated.
- How much new for-sale + rental construction is in the pipeline within 1–3 miles? Heavy new supply typically softens prices + rents 12–24 months out; constrained supply supports both.
Investment metrics
- 1% rule
- 1.14% ✓
- Cap rate
- 8.76%
- Cash-on-cash
- 8.82%
- DSCR
- 1.39
- GRM
- 7.3
CMA / ARV
- ARV (median comp)
- $241,647
- List price
- $180,000
- Delta
- -25.51%
- Verdict
- UNDERPRICED
- Comps
- 20 within 1.0 mi
Show comp detail 12 sales within ~0.75 mi
| Address | Dist | Beds/Ba | Sqft | Sold | Price | $/sf | Match |
|---|---|---|---|---|---|---|---|
| 1125 N 7th Ave Ave E | 0.21mi | 3/1.5 | 1,133 (+0%) | 3mo | $260,000 | $229 | 85 |
| 102 E 11th St | 0.36mi | 3/2.0 | 1,131 (+0%) | 9mo | $281,000 | $248 | 76 |
| 1230 N 7th Ave E | 0.22mi | 3/2.0 | 1,229 (+9%) | 1mo | $276,000 | $225 | 74 |
| 1107 N 7th Ave Ave E | 0.23mi | 4/2.0 (+1) | 1,196 (+6%) | 4mo | $185,000 | $155 | 71 |
| 1210 N 8th Ave Ave E | 0.31mi | 4/1.0 (+1) | 1,112 (-2%) | 7mo | $207,200 | $186 | 68 |
| 505 E 6th St | 0.49mi | 3/1.0 | 1,140 (+1%) | 6mo | $219,000 | $192 | 67 |
| 1109 N 8th Ave Ave E | 0.30mi | 3/1.0 | 1,224 (+8%) | 9mo | $235,000 | $192 | 61 |
| 407 E 6th St | 0.49mi | 2/1.0 (-1) | 1,152 (+2%) | 7mo | $205,000 | $178 | 59 |
| 701 E 11th St | 0.25mi | 3/1.0 | 1,296 (+15%) | 2mo | $139,900 | $108 | 58 |
| 323 Plum St | 0.49mi | 3/1.0 | 1,068 (-5%) | 7mo | $310,000 | $290 | 58 |
| 710 E 6th St | 0.56mi | 2/1.0 (-1) | 1,106 (-2%) | 7mo | $115,000 | $104 | 56 |
| 1208 E 9th St | 0.73mi | 3/1.0 | 1,186 (+5%) | 8mo | $170,000 | $143 | 46 |
Match score weights: distance 35% · size 25% · config 20% · recency 20%. Top-matched comps best support the ARV.
Projected returns pro-forma
-3.0% appreciation · 4.6% rent growth · sell at horizon
- IRR
- -1.1%
- Equity multiple
- 0.96×
- Total profit
- $-2,173
- Equity at exit
- $26,839
- IRR
- 10.2%
- Equity multiple
- 1.85×
- Total profit
- $42,916
- Equity at exit
- $15,563
Cash invested: $50,400 (down + closing). Projections, not guarantees.
Landlord ↔ Tenant lean methodology
- Overall (STATE)
- 46 Balanced
- State Minnesota
- 46 Balanced · D+2
- County
- — inherits STATE
- City
- — inherits STATE
ZIP-level market 55811
- Rents YoY
- 4.6%
- Active inventory
- 206
- Price-to-rent
- 7.3×
Monthly cashflow live
- Estimated rent
- $2,059 high interval (Pro) →
- Mortgage (P&I)
- −$944
- Tax from tax record
- −$237 /mo · $2,846/yr
- Insurance
- −$75
- HOA
- −$0
- Vacancy / Maint / Mgmt
- −$432
- Net cashflow
- $370
Break-even live
UW: 25.0% down · 7.5% · 30yr · 1.5% tax · 5.0% vac · 8.0% maint · 8.0% mgmt
Financing live
Cash to close
- Down payment
- $45,000
- Closing costs
- $5,400
- Reserves months
- —
- Total cash needed
- —
Loan-product check · same deal, 3 products live
Conventional
25% down · 7.5% · 30yr
- Down + closing
- —
- Monthly P&I
- —
- Monthly cashflow
- —
- DSCR
- —
- Eligible?
- —
Personal DTI + credit; lowest rate.
DSCR
20% down · 8.5% · 30yr
- Down + closing
- —
- Monthly P&I
- —
- Monthly cashflow
- —
- DSCR
- —
- Eligible?
- —
No personal income docs; deal must DSCR.
Hard money
10% down · 12.0% · 12mo
- Down + closing
- —
- Monthly P&I
- —
- Monthly cashflow
- —
- DSCR
- —
- Eligible?
- —
Short-term bridge; refi at stabilization.
Rent comps 18 comps
| Address | Beds | Baths | Sqft | Rent | $/sqft | DOM | Units | Dist |
|---|---|---|---|---|---|---|---|---|
| 13 E 8th St Duluth, MN | 4.0 | 1.5 | 1388 | $2,000 | $1.44 | 43d | 1 | 0.50mi |
| 423 E 5th St Duluth, MN | 3.0 | 1.0 | 850 | $1,295 | $1.52 | 13d | 1 | 0.55mi |
| 425 E 5th St Duluth, MN | 3.0 | 1.0 | 1124 | $1,995 | $1.77 | 43d | 1 | 0.55mi |
| 825 N 10th Ave E Duluth, MN | 3.0 | 1.0 | 1120 | $1,800 | $1.61 | 43d | 1 | 0.56mi |
| 502 N Oak Bend Dr Duluth, MN | 1.0–2.0 | 1.0 | 857 | $1,549 | $1.81 | 13d | 1 | 0.60mi |
| 1120 E Ninth St Apt 1 Duluth, MN | 2.0 | 1.0 | 700 | $1,500 | $2.14 | 13d | 1 | 0.70mi |
| 902 Partridge St Duluth, MN | 2.0 | 1.0 | 790 | $1,380 | $1.75 | 43d | 1 | 0.72mi |
| 513 N 1st Ave W Unit 509 Duluth, MN | 2.0 | 1.0 | 1300 | $1,355 | $1.04 | 43d | 1 | 0.73mi |
| 333 N 1st Ave W Apt 3130 Duluth, MN | 2.0 | 2.0 | 995 | $1,830 | $1.84 | 13d | 1 | 0.83mi |
| 916 E 3rd St Duluth, MN | 2.0 | 1.0 | 1325 | $1,750 | $1.32 | 13d | 1 | 0.86mi |
| 723 Kenwood Ave Duluth, MN | 1.0–2.0 | 1.0 | 800 | $1,635 | $2.04 | 13d | 1 | 0.88mi |
| 333 E Superior St Duluth, MN | 2.0 | 1.0–2.0 | 1154 | $5,822 | $5.05 | 13d | 96 | 0.90mi |
| 311 E Superior St #902 Duluth, MN | 2.0 | 2.0 | 1500 | $3,995 | $2.66 | 43d | 1 | 0.90mi |
| 426 N 13th Ave E Duluth, MN | 3.0 | 1.0 | 1248 | $1,900 | $1.52 | 13d | 1 | 0.96mi |
| 100 N 5th Ave W Duluth, MN | 3.0 | 1.0–2.0 | 1207 | $3,999 | $3.31 | 13d | 1 | 1.14mi |
| 100 N 5th Ave W Duluth, MN | 3.0 | 1.0–2.0 | 1209 | $3,299 | $2.73 | 21d | 7 | 1.14mi |
| 521 W 2nd St Duluth, MN | 2.0 | 1.0 | 592 | $1,600 | $2.70 | 13d | 2 | 1.17mi |
| 1425 E 2nd St Fl , 1 Duluth, MN | 2.0 | 1.0 | 1100 | $1,450 | $1.32 | 43d | 1 | 1.19mi |
Listing history 4 events
-
2026-05-07$180,000 Active 1516-char remark
-
2021-09-21soldstatus $130,000
-
2021-08-10soldstatus $130,000 175-char remark
Show marketing remark (175 chars)
Great views of Lake Superior and conveniently located in the middle of Duluth. This solid one-owner, 3 bedroom bungalow has a lot of potential. Come see it today for yourself!
-
2021-06-04$130,000 175-char remark
Show marketing remark (175 chars)
Great views of Lake Superior and conveniently located in the middle of Duluth. This solid one-owner, 3 bedroom bungalow has a lot of potential. Come see it today for yourself!
ⓘ Source: listings_history table (triggers on properties + properties_extension) + one-shot
backfill from property_details.listing_events for pre-trigger history.
Tax reassessment forecast MN · Partial reset (capped growth)
- Current annual tax
- $2,846 · $237/mo
- Projected year-2 tax
- $2,846 · $237/mo
- Expected delta
- $0/yr ($0/mo · 0.0%)
ⓘ Screening estimate from a state-policy table — verify with the county assessor before closing.
Climate risk First Street
- Flood 1/10 Low FEMA zone X · 0% chance over 30 yrs
- Wildfire 1/10 Low
- Heat 1/10 Low 7 d/yr ≥91°F today · 12 d/yr by 30 yrs out
- Wind 1/10 Low
- Air quality 2/10 Low 0 unhealthy d/yr today · 1 by 30 yrs out
Nearby sold comps map
Loading sold comps map…
Walkable amenities ~0.75 mi
Loading nearby amenities…
Taxation est. · year 1
- Rental income
- $24,706
- − Mortgage interest
- −$10,083
- − Property taxes
- −$2,846
- − Insurance
- −$900
- − Repairs & maintenance
- −$1,976
- − Management
- −$1,976
- − Depreciation
- −$5,236
- Taxable income
- $1,688
- Est. tax owed @ 24.0%
- −$405
- After-tax cash flow
- $4,039/yr
For passive investors: Depreciation is non-cash, so a rental often shows a tax loss while cash-flowing — sheltering income. Rental losses are passive: they offset passive income freely, and up to $25,000/yr can offset ordinary (W-2) income if you actively participate and your MAGI is under $100k (phasing out to $0 by $150k); unused losses carry forward. On sale, claimed depreciation is recaptured at up to 25%, and gains may owe capital-gains tax (a 1031 exchange can defer both). Figures are a year-1 estimate at your 24.0% rate — not tax advice; consult a CPA.
Schools (NCES district)
- District
- Duluth Public School District
- NCES district ID
- 2711040
- Math proficiency
- 44% ▼ -10.00%
- Reading proficiency
- 55% ▼ -6.00%
- Median HH income
- $45,692
- Composite
- 41.92/100
- National rank
- #3360
- State rank
- #132 of 301 in MN
Livability — Duluth
- Score
- 82/100
- State rank
- #36
- US rank
- #1060
Category grades
Schools grade is shown separately in the Schools card above.
Census & demographics
- Census place
- Duluth, MN
- County
- Saint Louis County · 115,152 people
- City population
- 71,097
- Metro
- Duluth, MN-WI
- Population (ZIP)
- 28,118
- Household income
- $79,804
- Rent vs Own
- Severe rent burden
- 1019.0
Population outlook (St. Louis County) Hauer SSP2
- Today (2025)
- 202,411 people
- By 2030
- 203,234 · +0.4%
- By 2040
- 202,520 · +0.1%
- By 2050
- 200,853 · -0.8%
- By 2075
- 200,943 · -0.7%
- By 2100
- 192,058 · -5.1%
Race, ethnicity, and origin ACS 2023
- Neighborhood character
- Predominantly White (91%)
- Race & ethnicity
- White 91% Two or more races 4% Hispanic / Latino 2% Asian 2% Black 1%
- Common ancestry
- Portuguese 14% Romanian 7% Lithuanian 3%
- Foreign-born
- 2% · Canada
- Languages at home
- 97% English-only · Spanish 1% Other Indo-European 1%
Political lean MEDSL · St. Louis
- 2024 margin
- D (+13.7) · D 55.9% · R 42.2% · Other 1.8%
- 2008→2024 swing
- -18.8pp toward R · 2008: 32.5pp · 2024: 13.7pp
- All cycles
- 2024: D+13.7 2020: D+15.6 2016: D+11.8 2012: D+29.6 2008: D+32.5
Not yet ingested
- Civics
- —
Market trends
- HPI YoY
- ▼ -252.84%
- Current HPI
- 198.2613
- Rent YoY
- ▲ 4.60%
- Metro
- Duluth, MN-WI
- State GDP YoY
- ▲ 2.41%
- F500 in state
- 34
Industry mix (Fortune 500 HQ in MN)
| Industry | F500 HQs | Revenue |
|---|---|---|
| Healthcare | 2 | $407B |
|
||
| Retail | 2 | $150B |
|
||
| Consumer Goods | 2 | $32B |
|
||
| Industrial Machinery | 2 | $6B |
|
||
| Agriculture | 1 | $40B |
|
||
| Healthcare / Medical Devices | 1 | $32B |
|
||
Price history
+38.5% since first listed5 events — show timeline
- 2026-05-22 Pending — LSAR
- 2026-05-07 Listed $180,000 LSAR
- 2021-09-21 Sold (Public Records) $130,000 Public Records
- 2021-08-10 Sold (MLS) $130,000 LSAR
- 2021-06-04 Listed $130,000 LSAR
Property tax history
+10.7%/yrLatest (2026): $2,846 · +11.5% YoY. Source: county tax records.
Cash-flow waterfall
monthlySold comps — $/sqft
last 12 mo · ≤1 miLoading sold comps…