 Triplex
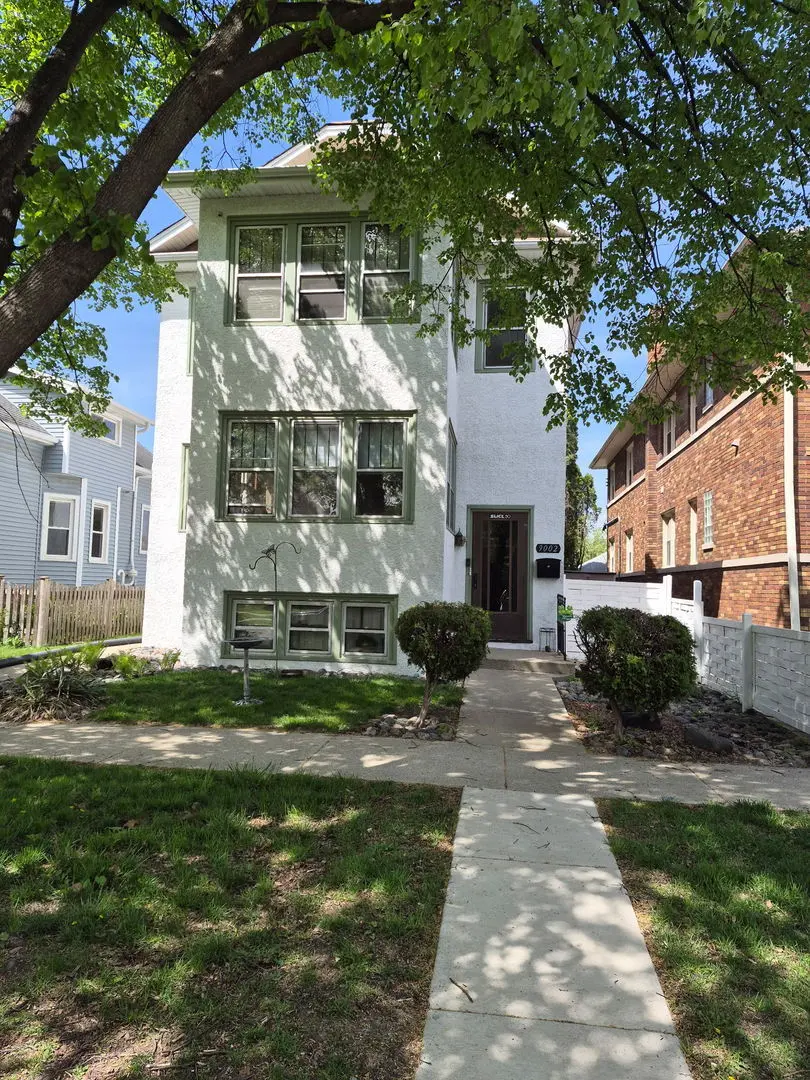
9002 Sheridan Ave · Brookfield, IL
Flood risk 3/10 · Minor
- FEMA flood zone
- X (unshaded)
- Chance of flooding over 30 yrs
- 0.17%
- Est. flood insurance / yr
- $473 – $860
Fire risk 1/10 · Minimal
- Est. fire insurance / yr
- $804 – $1,492
Heat risk 3/10 · Minor
- Hot days now (above 100°F)
- 7 days/yr
- Hot days in 30 yrs
- 15 days/yr
Wind risk 2/10 · Minimal
- Chance of severe wind over 30 yrs
- 1.0%
Air-quality risk 4/10 · Minor
- Unhealthy air days now
- 3 days/yr
- Unhealthy air days in 30 yrs
- 5 days/yr
Risk factors via First Street. Map © Google.
Why this score? — see what drove the C- grade
The composite is a weighted blend of 9 inputs, each scored 0–100. Each bar is that input's sub-score; the figure is the points it added to the 100-point composite (weight × sub-score).
- Cash flow +19.3/30.0
- ARV discount +7.5/15.0
- DSCR +6.1/10.0
- Schools +5.0/10.0
- 1% rule +4.8/10.0
- Livability +4.6/5.0
- Rent growth +2.5/5.0
- Condition / age +2.5/5.0
- Appreciation +0.0/10.0
$600,000
🖨 Deal sheet 📄 Offer letter ✓ Due diligence
Multi-family units
County records classify this as Multi-Family (2-4 Unit). Listing-text estimate: 3 units. confirmed
Listing remarks
Opportunities like this don't come around often! Welcome to this standout 3-unit property in sought-after Brookfield-offering charm, flexibility, and serious income potential. Built in 1923, this well-maintained stucco building blends timeless character with versatile living spaces ideal for investors, owner-occupants, or multi-generational living. The property features three separate units, each with its own unique appeal. The garden unit offers 1 bedroom and 1 bath with a cozy, private feel-perfect for rental income or extended family. The first-floor unit features 2 bedrooms, 1 full bath, a classic parlor-style layout with spacious living room, dining room, and kitchen, plus a bonus room
Key facts
- 2 garage spots
- Built 1923
- Listed 27 days
Neighborhood map
What this means for you Summary
Snapshot
- This is a 2×2bd/1.2ba + 1×1bd/1.2ba units multifamily listed at $600k.
Deal economics
- At list price, monthly cash flow is $657 ($8k/yr) — positive. Per door: $219/mo.
- The deal already cash-flows at list — no discount required.
- To meet the 1% rule (rent ≥ 1% of price), the offer needs to be $587k (2.1% below list).
- Recommended offer: $587k (2.1% below list) — sets the bar for 1% rule.
- Cap rate 7.6% vs local median 3.4% in Brookfield — top-decile yield for the area; either an underpriced asset or a hidden risk that comps aren't pricing in. Stress-test before assuming the spread holds.
Location & tenants
- Location reads 92/100 on livability (#2 in IL, #31 nationally) — a professional / high-income tenant draw. Strengths: crime A+, amenities A+, commute A+.
- Market conditions: 12 active listings in the ZIP; high-income renter base; 6,272 units permitted in Cook County in 2024 (4,658 in 5+ unit buildings).
- At $5,872/mo this rent would consume 64% of the median local household income ($110k/yr) (locally 263% of renters already pay >50% of income on rent) — very limited rent-growth headroom before tenants either downsize or default.
Forward outlook
- Local home prices are declining (-3.0%/yr); year-one equity from $4k of loan paydown is wiped out by about $18k of value loss. Plan a longer hold.
Negotiation context
- It's been on market 28 days — a 2% lower offer ($591k) is reasonable based on typical stale-listing flexibility.
Risks & watch-outs
- Watch-outs: built in 1923 — expect roof / HVAC / electrical / plumbing capex.
Questions for the listing agent
- Can we see the unit-by-unit rent roll, current vacancy, and any below-market leases? What's the average tenancy length?
- What capital expenditures (roof, boiler, parking lot, exteriors) have been made in the last 5 years, and what's planned in the next 2?
- Built in 1923 — when were the roof, HVAC, electrical panel, plumbing, and water heater last replaced?
- Is there a deadline driving the sale (1031 exchange, divorce, estate, relocation)? That informs how much negotiation room exists.
- Schools are B-rated — typically a magnet for longer-tenancy family renters. What's the average tenant stay here, and is there a school-zone premium baked into asking?
- What's the average days-on-market for RENTAL listings here right now (not sales)? A rising rental-DOM trend means longer vacancies and softer asking-rent achievability than the comps imply.
- What's the recent tenant-quality profile in this submarket — average credit score on applications, eviction rate, late-payment / NSF rate, and stable-employment percentage? A property-management company in the area should have these aggregated.
- How much new apartment / multifamily construction is in the pipeline within 1–3 miles? Heavy new supply (>2% of stock underway) typically softens rents 12–24 months out; light construction supports rent growth.
Investment metrics
- 1% rule
- 0.98% ✗
- Cap rate
- 7.61%
- Cash-on-cash
- 4.70%
- DSCR
- 1.21
- GRM
- 8.5
CMA / ARV
No comps found within radius.
Projected returns pro-forma
-3.0% appreciation · 3.0% rent growth · sell at horizon
- IRR
- -9.0%
- Equity multiple
- 0.67×
- Total profit
- $-55,375
- Equity at exit
- $89,462
- IRR
- 0.5%
- Equity multiple
- 1.03×
- Total profit
- $5,636
- Equity at exit
- $51,877
Cash invested: $168,000 (down + closing). Projections, not guarantees.
Landlord ↔ Tenant lean methodology
- Overall (STATE)
- 43 Moderately Tenant-Leaning
- State Illinois
- 43 Moderately Tenant-Leaning · D+7
- County
- — inherits STATE
- City
- — inherits STATE
ZIP-level market 60513
- Active inventory
- 12
- Price-to-rent
- 24.3×
Monthly cashflow live
- Estimated rent
- $5,872 high interval (Pro) →
- Mortgage (P&I)
- −$3,146
- Tax from tax record
- −$585 /mo · $7,021/yr
- Insurance
- −$250
- HOA
- −$0
- Vacancy / Maint / Mgmt
- −$1,233
- Net cashflow
- $657
Break-even live
3-unit breakdown (identical units grouped — click to expand)
| Units | Beds | Baths | Est. rent |
|---|---|---|---|
| 2× units | 2 | 1.2 | $4,116 |
| #1 | 2 | 1.2 | $2,058 |
| #2 | 2 | 1.2 | $2,058 |
| 1× unit | 1 | 1.2 | $1,756 |
| Total (3 units) | $5,872 | ||
UW: 25.0% down · 7.5% · 30yr · 1.5% tax · 5.0% vac · 8.0% maint · 8.0% mgmt
Financing live
Cash to close
- Down payment
- $150,000
- Closing costs
- $18,000
- Reserves months
- —
- Total cash needed
- —
Loan-product check · same deal, 3 products live
Conventional
25% down · 7.5% · 30yr
- Down + closing
- —
- Monthly P&I
- —
- Monthly cashflow
- —
- DSCR
- —
- Eligible?
- —
Personal DTI + credit; lowest rate.
DSCR
20% down · 8.5% · 30yr
- Down + closing
- —
- Monthly P&I
- —
- Monthly cashflow
- —
- DSCR
- —
- Eligible?
- —
No personal income docs; deal must DSCR.
Hard money
10% down · 12.0% · 12mo
- Down + closing
- —
- Monthly P&I
- —
- Monthly cashflow
- —
- DSCR
- —
- Eligible?
- —
Short-term bridge; refi at stabilization.
Listing history 16 events
-
2026-06-19days on market $600,000 Active 28 DOM
-
2026-06-18days on market $600,000 Active 27 DOM
-
2026-06-17days on market $600,000 Active 26 DOM
-
2026-06-16days on market $600,000 Active 25 DOM
-
2026-06-15days on market $600,000 Active 24 DOM
-
2026-06-14days on market $600,000 Active 22 DOM
-
2026-06-13days on market $600,000 Active 21 DOM
-
2026-06-10days on market $600,000 Active 19 DOM
-
2026-06-09days on market $600,000 Active 18 DOM
-
2026-06-08days on market $600,000 Active 17 DOM
-
2026-06-07days on market $600,000 Active 16 DOM
-
2026-06-05days on market $600,000 Active 13 DOM
-
2026-06-02days on market $600,000 Active 11 DOM
-
2026-06-01days on market $600,000 Active 10 DOM
-
2026-05-31days on market $600,000 Active 9 DOM
-
2026-05-30days on market $600,000 Active 8 DOM
ⓘ Source: listings_history table (triggers on properties + properties_extension) + one-shot
backfill from property_details.listing_events for pre-trigger history.
Tax reassessment forecast IL · Partial reset (capped growth)
- Current annual tax
- $7,021 · $585/mo
- Projected year-2 tax
- $10,321 · $860/mo
- Expected delta
- +$3,299/yr (+$275/mo · 47.0%)
ⓘ Screening estimate from a state-policy table — verify with the county assessor before closing.
Climate risk First Street
- Flood 3/10 Moderate FEMA zone X (unshaded) · 17% chance over 30 yrs
- Wildfire 1/10 Low
- Heat 3/10 Moderate 7 d/yr ≥100°F today · 15 d/yr by 30 yrs out
- Wind 2/10 Low 100% chance of damaging wind over 30 yrs
- Air quality 4/10 Moderate 3 unhealthy d/yr today · 5 by 30 yrs out
Nearby sold comps map
Loading sold comps map…
Walkable amenities ~0.75 mi
Loading nearby amenities…
Taxation est. · year 1
- Rental income
- $70,464
- − Mortgage interest
- −$33,609
- − Property taxes
- −$7,021
- − Insurance
- −$3,000
- − Repairs & maintenance
- −$5,637
- − Management
- −$5,637
- − Depreciation
- −$17,455
- Taxable loss
- −$1,895
- Est. tax savings @ 24.0%
- +$455
- After-tax cash flow
- $8,343/yr
For passive investors: Depreciation is non-cash, so a rental often shows a tax loss while cash-flowing — sheltering income. Rental losses are passive: they offset passive income freely, and up to $25,000/yr can offset ordinary (W-2) income if you actively participate and your MAGI is under $100k (phasing out to $0 by $150k); unused losses carry forward. On sale, claimed depreciation is recaptured at up to 25%, and gains may owe capital-gains tax (a 1031 exchange can defer both). Figures are a year-1 estimate at your 24.0% rate — not tax advice; consult a CPA.
Schools (NCES district)
No district data.
Livability — Brookfield
- Score
- 92/100
- State rank
- #2
- US rank
- #31
Category grades
Schools grade is shown separately in the Schools card above.
Census & demographics
- Census place
- Brookfield, IL
- County
- Cook County · 4,486,803 people
- City population
- 19,343
- Metro
- Chicago-Naperville-Elgin, IL-IN-WI
- Population (ZIP)
- 19,343
- Household income
- $110,338
- Rent vs Own
- Severe rent burden
- 263.0
Population outlook (Cook County) Hauer SSP2
- Today (2025)
- 5,347,519 people
- By 2030
- 5,357,703 · +0.2%
- By 2040
- 5,324,924 · -0.4%
- By 2050
- 5,230,762 · -2.2%
- By 2075
- 4,785,735 · -10.5%
- By 2100
- 4,188,836 · -21.7%
Race, ethnicity, and origin ACS 2023
- Neighborhood character
- Predominantly White (70%)
- Race & ethnicity
- White 70% Hispanic / Latino 20% Two or more races 12% Black 5%
- Hispanic origin (detail)
- Mexican 16% Puerto Rican 3%
- Common ancestry
- Romanian 14% Lithuanian 2% Iranian 1%
- Foreign-born
- 9% · Canada
- Languages at home
- 81% English-only · Spanish 14% Russian/Polish/Slavic 3% Other Indo-European 1%
Political lean MEDSL · Cook
- 2024 margin
- Solid D (+42.0) · D 70.4% · R 28.4% · Other 1.2%
- 2008→2024 swing
- -11.4pp toward R · 2008: 53.4pp · 2024: 42.0pp
- All cycles
- 2024: D+42.0 2020: D+50.3 2016: D+53.0 2012: D+49.4 2008: D+53.4
Not yet ingested
- Civics
- —
Market trends
- HPI YoY
- ▼ -175.69%
- Current HPI
- 211.4747
- Rent YoY
- —
- Metro
- Chicago-Naperville-Elgin, IL-IN-WI
- State GDP YoY
- ▲ 1.59%
- F500 in state
- 60
Industry mix (Fortune 500 HQ in IL)
| Industry | F500 HQs | Revenue |
|---|---|---|
| Insurance | 4 | $201B |
|
||
| Consumer Goods | 4 | $87B |
|
||
| Industrial Machinery | 3 | $64B |
|
||
| Healthcare | 2 | $55B |
|
||
| Retail / Pharmacy | 1 | $148B |
|
||
| Agriculture / Food | 1 | $86B |
|
||
Property tax history
+0.8%/yrLatest (2023): $7,021 · -35.9% YoY. Source: county tax records.
Cash-flow waterfall
monthlySold comps — $/sqft
last 12 mo · ≤1 miLoading sold comps…