 🏷️ Likely Rental
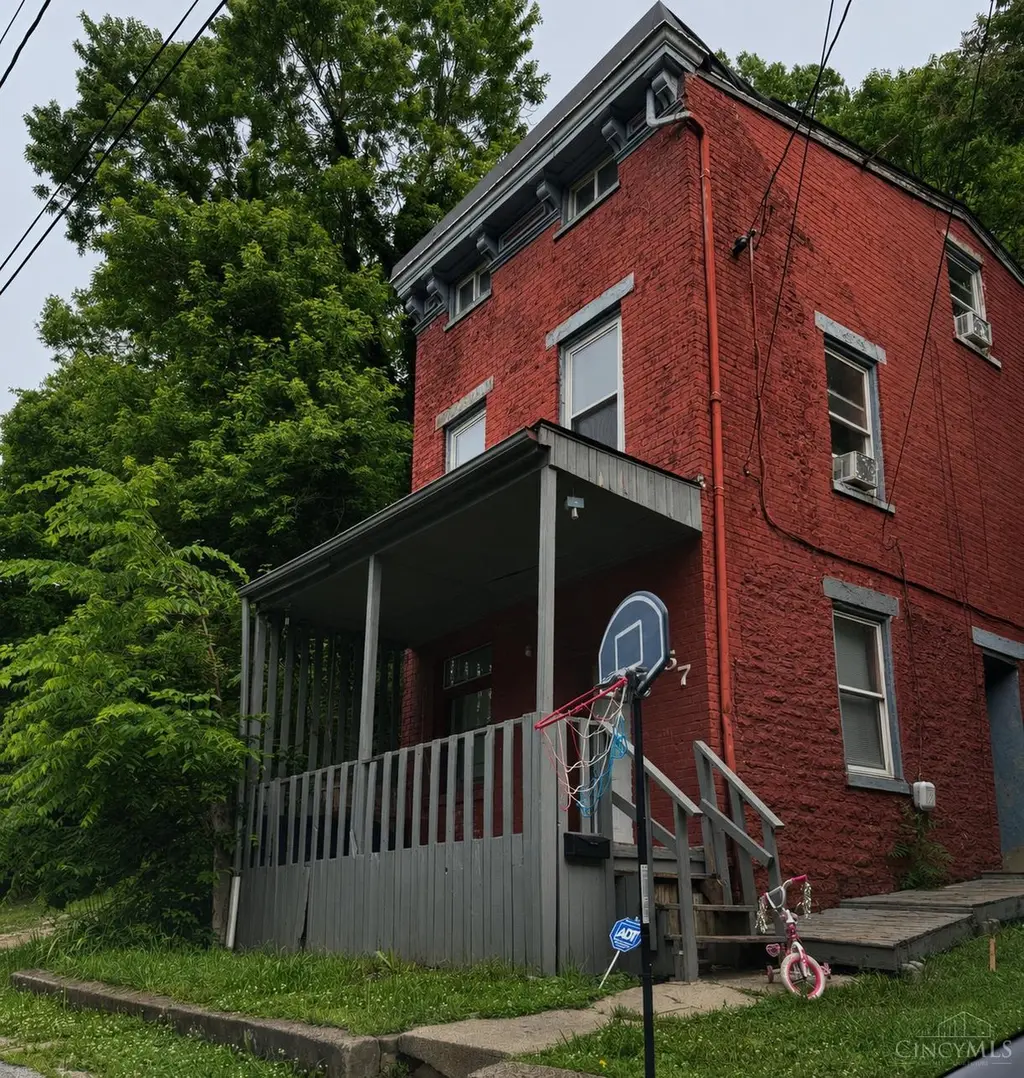
2457 Everglade Pl · Cincinnati, OH
Flood risk 1/10 · Minimal
- FEMA flood zone
- X (unshaded)
- Chance of flooding over 30 yrs
- 0.0%
- Est. flood insurance / yr
- $473 – $860
Fire risk 1/10 · Minimal
- Est. fire insurance / yr
- $713 – $1,323
Heat risk 4/10 · Minor
- Hot days now (above 103°F)
- 7 days/yr
- Hot days in 30 yrs
- 19 days/yr
Wind risk 2/10 · Minimal
- Chance of severe wind over 30 yrs
- 1.0%
Air-quality risk 3/10 · Minor
- Unhealthy air days now
- 3 days/yr
- Unhealthy air days in 30 yrs
- 5 days/yr
Risk factors via First Street. Map © Google.
Why this score? — see what drove the A grade
The composite is a weighted blend of 9 inputs, each scored 0–100. Each bar is that input's sub-score; the figure is the points it added to the 100-point composite (weight × sub-score).
- Cash flow +30.0/30.0
- ARV discount +15.0/15.0
- 1% rule +10.0/10.0
- DSCR +10.0/10.0
- Appreciation +10.0/10.0
- Rent growth +4.5/5.0
- Livability +4.0/5.0
- Schools +2.5/10.0
- Condition / age +2.5/5.0
$75,000
🖨 Deal sheet 📄 Offer letter ✓ Due diligence
Listing remarks MLS
**Online Auction** Bidding ends May 13th at 12:00pm ET. Great investment opportunity. Rented at 1,395.00/month with a lease until 2027. Don't miss out on this excellent money maker! Sold 100% As-Is. 10% Buyer Premium is added to the high bid. $7,000 deposit is due within 24 hours of the auction end time.
Key facts
- Wooded cul-de-sac
- 5,140 sq ft lot
- Built 1910
Tags
Property features AI
Finance
- Other: Lease not considered
- HOA & community: No homeowners association
Exterior
- Utilities: Public water; Public sewer; Natural gas available; Gas water heater
- Home design: Traditional single-family home; Less than 0.5 acre lot; Residential zoning
- Construction: Brick construction; Stone foundation
- Exterior features: Vinyl windows; Shingle roof
Interior
- Kitchen: Wood cabinets; Wood flooring
- Bedrooms: Three bedrooms total; Primary bedroom approximately 10 x 12 (Level 2); Second bedroom approximately 10 x 12 (Level 3); Third bedroom approximately 10 x 12 (Level 3)
- Flooring: Wood floor in kitchen
- Bathrooms: One full bathroom (Level 2); One half bathroom (Level 1)
- Heating & cooling: Electric forced air heating
- Interior features: Five total rooms; Full basement
Neighborhood map
What this means for you Summary
Snapshot
- This is a 2-bed/1.5-bath single-family listed at $75k.
Deal economics
- At list price, monthly cash flow is $564 ($7k/yr) — positive.
- The deal already cash-flows at list — no discount required.
- Meets the 1% rule at list price ($1k rent vs $75k).
- Recommended offer: $74k (1.5% below list) — sets the bar for market timing.
- Cap rate 15.3% vs local median 3.9% in Cincinnati — top-decile yield for the area; either an underpriced asset or a hidden risk that comps aren't pricing in. Stress-test before assuming the spread holds.
Location & tenants
- Location reads 80/100 on livability (#130 in OH, #1,856 nationally) — a professional / high-income tenant draw. Strengths: amenities A+, commute A+, cost of living A+; Watch: employment D, crime F.
- Cincinnati Public Schools (urban): math 25% / reading 36% proficiency, ranked #581 of 656 in OH (top 89%) — families likely to look elsewhere, expect single-tenant / working-renter base with shorter leases; 70% free/reduced lunch — lower-income household profile, screen leases tightly.
- Market conditions: Rents rising fast (+8.1%/yr); 67 active listings in the ZIP; 24 comparable units currently listed for rent nearby; rentals at typical pace (median 24d on market — plan ~3-4 weeks tenant-placement turnaround); lower-income renter base — watch delinquency; 801 units permitted in Hamilton County in 2024 (190 in 5+ unit buildings).
- At $1,331/mo this rent would consume 57% of the median local household income ($28k/yr) (locally 857% of renters already pay >50% of income on rent) — very limited rent-growth headroom before tenants either downsize or default.
Forward outlook
- In year one you build about $8k of equity ($519 loan paydown + $8k appreciation (10.0% local appreciation)).
- At projected returns (10.0% appreciation + 8.0% rent growth), your $21k cash investment doubles in ~2 years — after that, you're playing with house money.
- By year 5, paydown + projected appreciation supports a ~$37k cash-out refi (75% LTV) — recoverable capital for the next deal without selling this one.
Negotiation context
- It's been on market 17 days — a 2% lower offer ($74k) is reasonable based on typical stale-listing flexibility.
- 6 sale attempts since 30y ago with the ask held roughly flat each time — persistent listings suggest the price (not the market) is what's stuck; bring a comps-based counter.
- Current owner paid $40k; list at $75k implies a 88% gain — meaningful room to come down on a strong offer.
Risks & watch-outs
- Watch-outs: built in 1910 — expect roof / HVAC / electrical / plumbing capex.
Questions for the listing agent
- Built in 1910 — when were the roof, HVAC, electrical panel, plumbing, and water heater last replaced?
- Is there a deadline driving the sale (1031 exchange, divorce, estate, relocation)? That informs how much negotiation room exists.
- Schools are B-rated — typically a magnet for longer-tenancy family renters. What's the average tenant stay here, and is there a school-zone premium baked into asking?
- Crime grade is F in this area — have there been break-ins, vandalism, or insurance claims at this property in the last 3 years? What carrier currently insures it and at what premium?
- What's the average days-on-market for RENTAL listings here right now (not sales)? A rising rental-DOM trend means longer vacancies and softer asking-rent achievability than the comps imply.
- What's the recent tenant-quality profile in this submarket — average credit score on applications, eviction rate, late-payment / NSF rate, and stable-employment percentage? A property-management company in the area should have these aggregated.
- How much new for-sale + rental construction is in the pipeline within 1–3 miles? Heavy new supply typically softens prices + rents 12–24 months out; constrained supply supports both.
Investment metrics
- 1% rule
- 1.77% ✓
- Cap rate
- 15.32%
- Cash-on-cash
- 32.25%
- DSCR
- 2.43
- GRM
- 4.7
CMA / ARV
- ARV (on-the-fly)
- $146,496
- Comps found
- 12
Show comp detail 12 sales within ~0.75 mi
| Address | Dist | Beds/Ba | Sqft | Sold | Price | $/sf | Match |
|---|---|---|---|---|---|---|---|
| 1871 Fairmount Ave | 0.15mi | 2/1.0 | 1,301 (-3%) | 5mo | $143,500 | $110 | 81 |
| 2473 Everglade Pl | 0.04mi | 3/2.0 (+1) | 1,392 (+4%) | 8mo | $104,000 | $75 | 79 |
| 1817 Forbus St | 0.30mi | 2/1.0 | 1,448 (+8%) | 4mo | $10,000 | $7 | 68 |
| 1599 Tremont St | 0.34mi | 3/1.5 (+1) | 1,394 (+4%) | 6mo | $168,000 | $121 | 68 |
| 2456 Saturn St | 0.23mi | 2/1.0 | 1,155 (-14%) | 6mo | $36,500 | $32 | 59 |
| 1798 Pulte St | 0.60mi | 2/1.0 | 1,392 (+4%) | 14mo | $29,000 | $21 | 52 |
| 1613 Pulte St | 0.69mi | 2/2.0 | 1,200 (-11%) | 3mo | $43,000 | $36 | 46 |
| 1712 Holden St | 0.45mi | 3/2.0 (+1) | 1,193 (-11%) | 11mo | $225,000 | $189 | 44 |
| 1829 Carll St | 0.47mi | 2/1.0 | 1,190 (-12%) | 17mo | $130,000 | $109 | 43 |
| 2495 Knorr Ave | 0.63mi | 3/1.0 (+1) | 1,539 (+14%) | 2mo | $219,900 | $143 | 38 |
| 2040 Queen City Ave | 0.63mi | 3/1.0 (+1) | 1,147 (-15%) | 5mo | $74,000 | $65 | 35 |
| 1531 Grove St | 0.55mi | 3/2.0 (+1) | 1,192 (-11%) | 19mo | $142,000 | $119 | 33 |
Match score weights: distance 35% · size 25% · config 20% · recency 20%. Top-matched comps best support the ARV.
Projected returns pro-forma
10.0% appreciation · 8.0% rent growth · sell at horizon
- IRR
- 52.0%
- Equity multiple
- 4.99×
- Total profit
- $83,823
- Equity at exit
- $67,566
- IRR
- 47.7%
- Equity multiple
- 12.24×
- Total profit
- $236,007
- Equity at exit
- $145,709
Cash invested: $21,000 (down + closing). Projections, not guarantees.
Landlord ↔ Tenant lean methodology
- Overall (STATE)
- 73 Landlord-Friendly
- State Ohio
- 73 Landlord-Friendly · R+6
- County
- — inherits STATE
- City
- — inherits STATE
ZIP-level market 45214
- Home prices YoY
- 3.6%
- Rents YoY
- 8.1%
- Active inventory
- 67
- Price-to-rent
- 4.7×
Monthly cashflow live
- Estimated rent
- $1,331 high interval (Pro) →
- Mortgage (P&I)
- −$393
- Tax from tax record
- −$63 /mo · $751/yr
- Insurance
- −$31
- HOA
- −$0
- Vacancy / Maint / Mgmt
- −$280
- Net cashflow
- $564
Break-even live
UW: 25.0% down · 7.5% · 30yr · 1.5% tax · 5.0% vac · 8.0% maint · 8.0% mgmt
Financing live
Cash to close
- Down payment
- $18,750
- Closing costs
- $2,250
- Reserves months
- —
- Total cash needed
- —
Loan-product check · same deal, 3 products live
Conventional
25% down · 7.5% · 30yr
- Down + closing
- —
- Monthly P&I
- —
- Monthly cashflow
- —
- DSCR
- —
- Eligible?
- —
Personal DTI + credit; lowest rate.
DSCR
20% down · 8.5% · 30yr
- Down + closing
- —
- Monthly P&I
- —
- Monthly cashflow
- —
- DSCR
- —
- Eligible?
- —
No personal income docs; deal must DSCR.
Hard money
10% down · 12.0% · 12mo
- Down + closing
- —
- Monthly P&I
- —
- Monthly cashflow
- —
- DSCR
- —
- Eligible?
- —
Short-term bridge; refi at stabilization.
Rent comps 24 comps
| Address | Beds | Baths | Sqft | Rent | $/sqft | DOM | Units | Dist |
|---|---|---|---|---|---|---|---|---|
| 2504 White St Apt 5 Cincinnati, OH | 3.0 | 2.0 | 1150 | $1,150 | $1.00 | 23d | 1 | 0.41mi |
| 2556 Beekman St Unit 301 Cincinnati, OH | 2.0 | 1.0 | 1000 | $950 | $0.95 | 23d | 1 | 0.63mi |
| 2570 Sarvis Ct Unit 2570 01 Cincinnati, OH | 2.0 | 1.0 | 1000 | $1,195 | $1.20 | 23d | 1 | 0.80mi |
| 2570 Sarvis Ct Unit 2572 12 Cincinnati, OH | 2.0 | 1.0 | 1000 | $1,250 | $1.25 | 23d | 1 | 0.80mi |
| 2117 Saint Leo Pl Cincinnati, OH | 2.0 | 1.0 | 1050 | $1,150 | $1.10 | 23d | 1 | 0.84mi |
| 1740 Minion Ave Cincinnati, OH | 2.0 | 1.0 | 1320 | $1,200 | $0.91 | 23d | 1 | 1.18mi |
| 1872 Sunset Ave Cincinnati, OH | 2.0 | 1.0 | 888 | $1,075 | $1.21 | 4d | 7 | 1.21mi |
| 1048 Marshall Ave Unit 5 Cincinnati, OH | 2.0 | 1.0 | 888 | $965 | $1.09 | 23d | 1 | 1.23mi |
| 1042 Marshall Ave Apt 3 Cincinnati, OH | 3.0 | 1.0 | 1400 | $1,195 | $0.85 | 23d | 1 | 1.24mi |
| 2341 W McMicken Ave Unit 1 Cincinnati, OH | 1.0 | 1.0 | 1291 | $1,300 | $1.01 | 4d | 1 | 1.28mi |
| 2341 W McMicken Ave Apt 2 Cincinnati, OH | 1.0 | 1.0 | 1051 | $1,200 | $1.14 | 4d | 1 | 1.28mi |
| 3772 W Liberty St Cincinnati, OH | 3.0 | 1.0 | 1066 | $1,350 | $1.27 | 4d | 1 | 1.29mi |
| 1607 Minion Ave Cincinnati, OH | 3.0 | 1.5 | 1066 | $1,675 | $1.57 | 23d | 1 | 1.32mi |
| 3666 Glenway Ave Cincinnati, OH | 3.0 | 1.0 | 1339 | $1,250 | $0.93 | 23d | 1 | 1.34mi |
| 2356 Harrison Ave Cincinnati, OH | 2.0 | 1.0 | 900 | $1,000 | $1.11 | 23d | 1 | 1.36mi |
| 2230 Westwood Northern Blvd Cincinnati, OH | 1.0–2.0 | 1.0–2.0 | 792 | $940 | $1.19 | 23d | 3 | 1.38mi |
| 2704 W McMicken Ave Unit 2 Cincinnati, OH | 3.0 | 1.0 | 1760 | $1,500 | $0.85 | 23d | 1 | 1.39mi |
| 1925 Colerain Ave Unit 1056034P Cincinnati, OH | 2.0 | 1.0 | 1453 | $2,790 | $1.92 | 12d | 1 | 1.40mi |
| 927 Chateau Ave Cincinnati, OH | 3.0 | 1.0 | 1354 | $1,550 | $1.14 | 21d | 1 | 1.41mi |
| 3064 Aquadale Ln Cincinnati, OH | 3.0 | 3.0 | 1102 | $1,850 | $1.68 | 23d | 1 | 1.41mi |
| 944 Elberon Ave Cincinnati, OH | 2.0 | 1.0 | 900 | $1,200 | $1.33 | 23d | 1 | 1.42mi |
| 3301 Colerain Ave Cincinnati, OH | 1.0 | 1.0 | 1021 | $1,491 | $1.46 | 4d | 9 | 1.42mi |
| 1 Foxhall Ct Unit 1 Cincinnati, OH | 2.0 | 2.5 | 1500 | $2,200 | $1.47 | 23d | 1 | 1.43mi |
| 1007 Dayton St Unit 6 Cincinnati, OH | 1.0 | 1.0 | 1035 | $1,150 | $1.11 | 23d | 1 | 1.47mi |
Listing history 12 events
-
2026-06-18days on market $75,000 Active 17 DOM
-
2026-06-17days on market $75,000 Active 16 DOM
-
2026-06-16days on market $75,000 Active 15 DOM
-
2026-06-15days on market $75,000 Active 14 DOM
-
2026-06-13days on market $75,000 Active 12 DOM
-
2026-06-13days on market $75,000 Active 11 DOM
-
2026-06-09days on market $75,000 Active 8 DOM
-
2026-06-08days on market $75,000 Active 7 DOM
-
2026-06-07days on market $75,000 Active 6 DOM
-
2026-06-03days on market $75,000 Active 2 DOM
-
2026-06-02remarks 699-char remark
-
2026-06-02$75,000 Active 1 DOM
ⓘ Source: listings_history table (triggers on properties + properties_extension) + one-shot
backfill from property_details.listing_events for pre-trigger history.
Tax reassessment forecast OH · Partial reset (capped growth)
- Current annual tax
- $751 · $63/mo
- Projected year-2 tax
- $961 · $80/mo
- Expected delta
- +$209/yr (+$17/mo · 27.9%)
ⓘ Screening estimate from a state-policy table — verify with the county assessor before closing.
Climate risk First Street
- Flood 1/10 Low FEMA zone X (unshaded) · 0% chance over 30 yrs
- Wildfire 1/10 Low
- Heat 4/10 Moderate 7 d/yr ≥103°F today · 19 d/yr by 30 yrs out
- Wind 2/10 Low 100% chance of damaging wind over 30 yrs
- Air quality 3/10 Moderate 3 unhealthy d/yr today · 5 by 30 yrs out
Nearby sold comps map
Loading sold comps map…
Walkable amenities ~0.75 mi
Loading nearby amenities…
Taxation est. · year 1
- Rental income
- $15,972
- − Mortgage interest
- −$4,201
- − Property taxes
- −$751
- − Insurance
- −$375
- − Repairs & maintenance
- −$1,278
- − Management
- −$1,278
- − Depreciation
- −$2,182
- Taxable income
- $5,907
- Est. tax owed @ 24.0%
- −$1,418
- After-tax cash flow
- $5,354/yr
For passive investors: Depreciation is non-cash, so a rental often shows a tax loss while cash-flowing — sheltering income. Rental losses are passive: they offset passive income freely, and up to $25,000/yr can offset ordinary (W-2) income if you actively participate and your MAGI is under $100k (phasing out to $0 by $150k); unused losses carry forward. On sale, claimed depreciation is recaptured at up to 25%, and gains may owe capital-gains tax (a 1031 exchange can defer both). Figures are a year-1 estimate at your 24.0% rate — not tax advice; consult a CPA.
Schools (NCES district)
- District
- Cincinnati Public Schools
- NCES district ID
- 3904375
- Math proficiency
- 25% ▼ -19.00%
- Reading proficiency
- 36% ▼ -14.00%
- Median HH income
- $35,743
- Composite
- 25.21/100
- National rank
- #7508
- State rank
- #581 of 656 in OH
Livability — Cincinnati
- Score
- 80/100
- State rank
- #130
- US rank
- #1856
Category grades
Schools grade is shown separately in the Schools card above.
Census & demographics
- Census place
- Cincinnati, OH
- County
- Hamilton County · 701,295 people
- City population
- 505,555
- Metro
- Cincinnati, OH-KY-IN
- Population (ZIP)
- 8,630
- Household income
- $27,852
- Rent vs Own
- Severe rent burden
- 857.0
Population outlook (Hamilton County) Hauer SSP2
- Today (2025)
- 826,054 people
- By 2030
- 830,947 · +0.6%
- By 2040
- 832,319 · +0.8%
- By 2050
- 822,428 · -0.4%
- By 2075
- 788,688 · -4.5%
- By 2100
- 710,674 · -14.0%
Race, ethnicity, and origin ACS 2023
- Neighborhood character
- Majority Black (63%)
- Race & ethnicity
- Black 63% White 27% Two or more races 7% Hispanic / Latino 3%
- Common ancestry
- Romanian 1%
- Foreign-born
- 2% · Canada
- Languages at home
- 97% English-only · Spanish 1% Other Indo-European 1%
Political lean MEDSL · Hamilton
- 2024 margin
- D (+14.9) · D 57.0% · R 42.1%
- 2008→2024 swing
- +7.9pp toward D · 2008: 7.0pp · 2024: 14.9pp
- All cycles
- 2024: D+14.9 2020: D+15.9 2016: D+9.5 2012: D+4.9 2008: D+7.0
Not yet ingested
- Civics
- —
Market trends
- HPI YoY
- ▲ 15.01%
- Current HPI
- 433.2346
- Rent YoY
- ▲ 8.09%
- Metro
- Cincinnati, OH-KY-IN
- State GDP YoY
- ▲ 1.98%
- F500 in state
- 48
Industry mix (Fortune 500 HQ in OH)
| Industry | F500 HQs | Revenue |
|---|---|---|
| Insurance | 3 | $145B |
|
||
| Industrial Machinery | 3 | $49B |
|
||
| Financial Services | 3 | $24B |
|
||
| Consumer Goods | 2 | $93B |
|
||
| Aerospace / Defense | 2 | $47B |
|
||
| Utilities | 2 | $33B |
|
||
Price history
+177.8% since first listed20 events — show timeline
- 2026-06-01 Listed $75,000 Cincy MLS
- 2026-05-21 Listing Removed — Cincy MLS
- 2026-04-22 Price Changed $69,000 Cincy MLS
- 2026-03-09 Listed $74,000 Cincy MLS
- 2022-08-19 Sold (Public Records) $82,500 Public Records
- 2022-08-19 Sold (Public Records) $40,000 Public Records
- 2006-02-08 Sold (Public Records) $8,800 Public Records
- 2006-01-30 Sold (MLS) $8,750 Cincy MLS
- 2005-09-20 Sold (Public Records) $16,000 Public Records
- 2005-08-25 Listed $8,900 Cincy MLS
- 2005-05-20 Listing Removed — Cincy MLS
- 2005-01-25 Listed $61,000 Cincy MLS
- 2000-10-20 Sold (Public Records) $12,000 Public Records
- 2000-09-08 Sold (MLS) $12,000 Cincy MLS
- 2000-07-11 Listed $24,900 Cincy MLS
- 2000-01-03 Sold (Public Records) $12,000 Public Records
- 1996-08-28 Sold (Public Records) $35,000 Public Records
- 1996-08-24 Sold (MLS) $35,000 Cincy MLS
- 1996-03-28 Listed $39,900 Cincy MLS
- 1990-06-26 Sold (Public Records) $27,000 Public Records
Property tax history
+4.0%/yrLatest (2025): $751 · +0.1% YoY. Source: county tax records.
Cash-flow waterfall
monthlySold comps — $/sqft
last 12 mo · ≤1 miLoading sold comps…