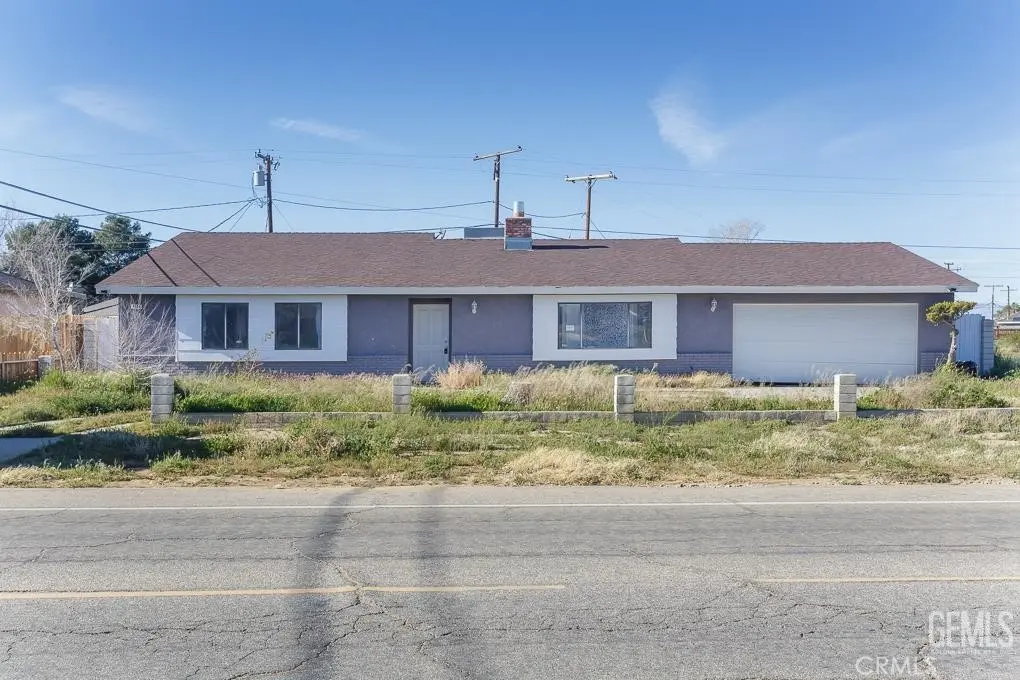
8525 Great Circle Dr · California City, CA
Flood risk 1/10 · Minimal
- FEMA flood zone
- X (unshaded)
- Chance of flooding over 30 yrs
- 0.0%
- Est. flood insurance / yr
- $507 – $1,088
Fire risk 1/10 · Minimal
- Est. fire insurance / yr
- $659 – $1,223
Heat risk 8/10 · Major
- Hot days now (above 101°F)
- 6 days/yr
- Hot days in 30 yrs
- 16 days/yr
Wind risk 1/10 · Minimal
- Chance of severe wind over 30 yrs
- —
Air-quality risk 7/10 · Major
- Unhealthy air days now
- 13 days/yr
- Unhealthy air days in 30 yrs
- 17 days/yr
Risk factors via First Street. Map © Google.
Why this score? — see what drove the D+ grade
The composite is a weighted blend of 9 inputs, each scored 0–100. Each bar is that input's sub-score; the figure is the points it added to the 100-point composite (weight × sub-score).
- ARV discount +14.3/15.0
- Appreciation +10.0/10.0
- Cash flow +7.9/30.0
- Rent growth +3.9/5.0
- Condition / age +2.5/5.0
- 1% rule +2.2/10.0
- Livability +2.2/5.0
- Schools +2.1/10.0
- DSCR +2.0/10.0
$339,900
🖨 Deal sheet 📄 Offer letter ✓ Due diligence
Listing remarks MLS
Great opportunity in California City! This spacious home offers a functional layout, generous lot size, and plenty of potential to make it your own. Ideal for buyers seeking value and space.
Key facts
- 9,583 sq ft lot
- 2 garage spots
- Built 1983
Neighborhood map
What this means for you Summary
Snapshot
- This is a 3-bed/2.0-bath single-family listed at $340k.
Deal economics
- At list price, monthly cash flow is $-358 ($-4k/yr) — negative.
- To cash-flow at today's rent, offer at most $277k (18.6% below list).
- To meet the 1% rule (rent ≥ 1% of price), the offer needs to be $244k (28.3% below list).
- Recommended offer: $244k (28.3% below list) — sets the bar for 1% rule.
Location & tenants
- Location reads 44/100 on livability (#1,329 in CA) — a working-class tenant base; expect higher turnover. Strengths: housing A+; Watch: schools F, crime F, amenities F.
- Mojave Unified (town): math 25% / reading 25% proficiency, ranked #411 of 517 in CA (top 80%) — low school quality limits family demand, transient renter base, plan for 1-2y turnover; 76% free/reduced lunch — lower-income household profile, screen leases tightly.
- Market conditions: Rents rising fast (+5.5%/yr); 703 active listings in the ZIP; 3 comparable units currently listed for rent nearby; rentals at typical pace (median 19d on market — plan ~3-4 weeks tenant-placement turnaround); 3,244 units permitted in Kern County in 2024 (73 in 5+ unit buildings).
- At $2,438/mo this rent would consume 49% of the median local household income ($60k/yr) (locally 883% of renters already pay >50% of income on rent) — very limited rent-growth headroom before tenants either downsize or default.
Forward outlook
- In year one you build about $36k of equity ($2k loan paydown + $34k appreciation (10.0% local appreciation)).
- Kern County population projected at +17% by 2050 — long-run rental-demand tailwind backs the buy-and-hold thesis.
- By year 2, paydown + projected appreciation supports a ~$58k cash-out refi (75% LTV) — recoverable capital for the next deal without selling this one.
Negotiation context
- It's been on market 89 days — a 6% lower offer ($320k) is reasonable based on typical stale-listing flexibility.
- 11 sale attempts since 3y ago; this cycle's ask has dropped $25k (7%) from the opening price — seller is motivated, your offer sets the floor, not the list.
Risks & watch-outs
- Climate carrying-cost: extreme-heat days projected 6→16/yr by 2055 (HVAC capex compounding) — expect insurance premiums to compound above CPI over the hold.
Questions for the listing agent
- What do current leases actually rent for vs. the listed asking? Can we see a recent rent roll and the last 12 months of T-12 income?
- It's been on market 89 days. Have you received any prior offers? Is the seller open to a 28% concession, seller financing, or rate buy-down credit?
- Why hasn't it sold? Are there any deal-killer items the seller is aware of (foundation, flood, title, zoning, code violations)?
- Is there a deadline driving the sale (1031 exchange, divorce, estate, relocation)? That informs how much negotiation room exists.
- Schools are F-rated, which usually means shorter tenancies and higher turnover. Who's the typical renter profile here, and what's been the actual vacancy rate?
- Crime grade is F in this area — have there been break-ins, vandalism, or insurance claims at this property in the last 3 years? What carrier currently insures it and at what premium?
- The area grade is low — what's the realistic commute time and amenity access for the typical tenant pool here? Any planned neighborhood developments (good or bad) we should know about?
- What's the average days-on-market for RENTAL listings here right now (not sales)? A rising rental-DOM trend means longer vacancies and softer asking-rent achievability than the comps imply.
- What's the recent tenant-quality profile in this submarket — average credit score on applications, eviction rate, late-payment / NSF rate, and stable-employment percentage? A property-management company in the area should have these aggregated.
- How much new for-sale + rental construction is in the pipeline within 1–3 miles? Heavy new supply typically softens prices + rents 12–24 months out; constrained supply supports both.
Investment metrics
- 1% rule
- 0.72% ✗
- Cap rate
- 5.03%
- Cash-on-cash
- -4.51%
- DSCR
- 0.80
- GRM
- 11.6
CMA / ARV
- ARV (on-the-fly)
- $400,521
- Comps found
- 1
Show comp detail 1 sale within ~0.75 mi
| Address | Dist | Beds/Ba | Sqft | Sold | Price | $/sf | Match |
|---|---|---|---|---|---|---|---|
| 8313 Redwood Blvd | 0.55mi | 3/2.0 | 2,202 (-13%) | 5mo | $349,900 | $159 | 49 |
Match score weights: distance 35% · size 25% · config 20% · recency 20%. Top-matched comps best support the ARV.
Projected returns pro-forma
10.0% appreciation · 5.45% rent growth · sell at horizon
- IRR
- 21.8%
- Equity multiple
- 2.77×
- Total profit
- $168,495
- Equity at exit
- $306,209
- IRR
- 20.1%
- Equity multiple
- 6.55×
- Total profit
- $527,891
- Equity at exit
- $660,351
Cash invested: $95,172 (down + closing). Projections, not guarantees.
Landlord ↔ Tenant lean methodology
- Overall (STATE)
- 18 Strongly Tenant-Friendly
- State California
- 18 Strongly Tenant-Friendly · D+13
- County
- — inherits STATE
- City
- — inherits STATE
ZIP-level market 93505
- Home prices YoY
- 13.0%
- Rents YoY
- 5.5%
- Active inventory
- 703
- Price-to-rent
- 11.6×
Monthly cashflow live
- Estimated rent
- $2,438 medium interval (Pro) →
- Mortgage (P&I)
- −$1,782
- Tax from tax record
- −$360 /mo · $4,314/yr
- Insurance
- −$142
- HOA
- −$0
- Vacancy / Maint / Mgmt
- −$512
- Net cashflow
- $-358
Break-even live
UW: 25.0% down · 7.5% · 30yr · 1.5% tax · 5.0% vac · 8.0% maint · 8.0% mgmt
Financing live
Cash to close
- Down payment
- $84,975
- Closing costs
- $10,197
- Reserves months
- —
- Total cash needed
- —
Loan-product check · same deal, 3 products live
Conventional
25% down · 7.5% · 30yr
- Down + closing
- —
- Monthly P&I
- —
- Monthly cashflow
- —
- DSCR
- —
- Eligible?
- —
Personal DTI + credit; lowest rate.
DSCR
20% down · 8.5% · 30yr
- Down + closing
- —
- Monthly P&I
- —
- Monthly cashflow
- —
- DSCR
- —
- Eligible?
- —
No personal income docs; deal must DSCR.
Hard money
10% down · 12.0% · 12mo
- Down + closing
- —
- Monthly P&I
- —
- Monthly cashflow
- —
- DSCR
- —
- Eligible?
- —
Short-term bridge; refi at stabilization.
Rent comps 3 comps
| Address | Beds | Baths | Sqft | Rent | $/sqft | DOM | Units | Dist |
|---|---|---|---|---|---|---|---|---|
| 20300 Graham St California City, CA | 4.0 | 2.5 | 2016 | $2,150 | $1.07 | 23d | 1 | 0.43mi |
| 20425 81st St California City, CA | 4.0 | 3.0 | 2215 | $2,900 | $1.31 | 19d | 1 | 0.45mi |
| 8332 Rea Ave California City, CA | 4.0 | 3.0 | 1861 | $2,500 | $1.34 | 3d | 1 | 1.40mi |
Listing history 36 events
-
2026-05-01price $339,900 191-char remark
Show marketing remark (190 chars)
Great opportunity in California City! This spacious home offers a functional layout, generous lot size, and plenty of potential to make it your own. Ideal for buyers seeking value and space.
-
2026-05-01price $339,900 190-char remark
Show marketing remark (190 chars)
Great opportunity in California City! This spacious home offers a functional layout, generous lot size, and plenty of potential to make it your own. Ideal for buyers seeking value and space.
-
2026-04-16price $349,900 190-char remark
Show marketing remark (191 chars)
Great opportunity in California City! This spacious home offers a functional layout, generous lot size, and plenty of potential to make it your own. Ideal for buyers seeking value and space.
-
2026-04-16price $349,900 191-char remark
Show marketing remark (191 chars)
Great opportunity in California City! This spacious home offers a functional layout, generous lot size, and plenty of potential to make it your own. Ideal for buyers seeking value and space.
-
2026-04-02price $359,900 191-char remark
Show marketing remark (190 chars)
Great opportunity in California City! This spacious home offers a functional layout, generous lot size, and plenty of potential to make it your own. Ideal for buyers seeking value and space.
-
2026-04-02price $359,900 190-char remark
Show marketing remark (190 chars)
Great opportunity in California City! This spacious home offers a functional layout, generous lot size, and plenty of potential to make it your own. Ideal for buyers seeking value and space.
-
2026-03-10$364,900 Active 191-char remark
Show marketing remark (191 chars)
Great opportunity in California City! This spacious home offers a functional layout, generous lot size, and plenty of potential to make it your own. Ideal for buyers seeking value and space.
-
2026-03-08price $364,900 190-char remark
Show marketing remark (190 chars)
Great opportunity in California City! This spacious home offers a functional layout, generous lot size, and plenty of potential to make it your own. Ideal for buyers seeking value and space.
-
2026-02-24$369,900 Active 190-char remark
Show marketing remark (190 chars)
Great opportunity in California City! This spacious home offers a functional layout, generous lot size, and plenty of potential to make it your own. Ideal for buyers seeking value and space.
-
2024-05-21soldstatus $335,000 Closed
-
2024-05-21soldstatus $335,000 Closed Sale
-
2024-05-21soldstatus $335,000
-
2024-05-01status Active
-
2024-04-09status Pending Sale
-
2024-04-09historical Active Under Contract
-
2024-03-29price $325,000
-
2024-03-29status Active
-
2024-03-29status Active
-
2024-03-28price $325,000
-
2024-03-22historical
-
2024-03-21historical
-
2024-03-01price $339,900
-
2024-03-01price $339,900
-
2024-02-10status Active
-
2024-02-10status Active
-
2024-01-31historical Active Under Contract
-
2024-01-31status Pending
-
2024-01-05$350,000 Active
-
2024-01-05$350,000 Active
-
2023-10-06soldstatus $215,000 Closed
-
2023-10-06soldstatus $215,000 Closed
-
2023-10-06soldstatus $215,000
-
2023-09-14status Pending
-
2023-09-14status Pending
-
2023-07-31$204,900 Active
-
2023-07-31$204,900 Active
ⓘ Source: listings_history table (triggers on properties + properties_extension) + one-shot
backfill from property_details.listing_events for pre-trigger history.
Tax reassessment forecast CA · Resets to sale price
- Current annual tax
- $4,314 · $360/mo
- Projected year-2 tax
- $4,314 · $360/mo
- Expected delta
- $0/yr ($0/mo · 0.0%)
ⓘ Screening estimate from a state-policy table — verify with the county assessor before closing.
Climate risk First Street
- Flood 1/10 Low FEMA zone X (unshaded) · 0% chance over 30 yrs
- Wildfire 1/10 Low
- Heat 8/10 Severe 6 d/yr ≥101°F today · 16 d/yr by 30 yrs out
- Wind 1/10 Low
- Air quality 7/10 Severe 13 unhealthy d/yr today · 17 by 30 yrs out
Nearby sold comps map
Loading sold comps map…
Walkable amenities ~0.75 mi
Loading nearby amenities…
Taxation est. · year 1
- Rental income
- $29,256
- − Mortgage interest
- −$19,040
- − Property taxes
- −$4,314
- − Insurance
- −$1,700
- − Repairs & maintenance
- −$2,340
- − Management
- −$2,340
- − Depreciation
- −$9,888
- Taxable loss
- −$10,367
- Est. tax savings @ 24.0%
- +$2,488
- After-tax cash flow
- $-1,803/yr
For passive investors: Depreciation is non-cash, so a rental often shows a tax loss while cash-flowing — sheltering income. Rental losses are passive: they offset passive income freely, and up to $25,000/yr can offset ordinary (W-2) income if you actively participate and your MAGI is under $100k (phasing out to $0 by $150k); unused losses carry forward. On sale, claimed depreciation is recaptured at up to 25%, and gains may owe capital-gains tax (a 1031 exchange can defer both). Figures are a year-1 estimate at your 24.0% rate — not tax advice; consult a CPA.
Schools (NCES district)
- District
- Mojave Unified
- NCES district ID
- 0625230
- Math proficiency
- 25% ▲ 11.00%
- Reading proficiency
- 25% ▼ -1.00%
- Median HH income
- $43,017
- Composite
- 21.4/100
- National rank
- #8350
- State rank
- #411 of 517 in CA
Livability — California City
- Score
- 44/100
- State rank
- #1329
- US rank
- #26753
Category grades
Schools grade is shown separately in the Schools card above.
Census & demographics
- Census place
- California City, CA
- County
- Kern County · 710,371 people
- City population
- 14,353
- Metro
- Bakersfield, CA
- Population (ZIP)
- 14,353
- Household income
- $59,827
- Rent vs Own
- Severe rent burden
- 883.0
Population outlook (Kern County) Hauer SSP2
- Today (2025)
- 947,286 people
- By 2030
- 978,984 · +3.3%
- By 2040
- 1,045,018 · +10.3%
- By 2050
- 1,105,232 · +16.7%
- By 2075
- 1,229,538 · +29.8%
- By 2100
- 1,238,059 · +30.7%
Race, ethnicity, and origin ACS 2023
- Neighborhood character
- Highly diverse neighborhood (Simpson 0.70)
- Race & ethnicity
- Hispanic / Latino 40% White 30% Black 22% Two or more races 16% Native American 3% Asian 1%
- Hispanic origin (detail)
- Mexican 29%
- Common ancestry
- Italian 3% Lithuanian 1% Romanian 1%
- Foreign-born
- 13% · Canada, Dominican Republic
- Languages at home
- 68% English-only · Spanish 29%
Political lean MEDSL · Kern
- 2024 margin
- Strong R (+21.1) · D 38.2% · R 59.3% · Other 2.5%
- 2008→2024 swing
- -3.3pp toward R · 2008: -17.8pp · 2024: -21.1pp
- All cycles
- 2024: R+21.1 2020: R+10.2 2016: R+15.0 2012: R+20.9 2008: R+17.8
Not yet ingested
- Civics
- —
Market trends
- HPI YoY
- ▲ 46.32%
- Current HPI
- 402.4192
- Rent YoY
- ▲ 5.45%
- Metro
- Bakersfield, CA
- State GDP YoY
- ▲ 3.21%
- F500 in state
- 116
Industry mix (Fortune 500 HQ in CA)
| Industry | F500 HQs | Revenue |
|---|---|---|
| Technology | 27 | $1,492B |
|
||
| Financial Services | 3 | $174B |
|
||
| Retail | 3 | $44B |
|
||
| Insurance | 3 | $26B |
|
||
| Media / Entertainment | 2 | $115B |
|
||
| Pharmaceuticals / Biotech | 2 | $62B |
|
||
Price history
+65.9% since first listed36 events — show timeline
- 2026-05-01 Price Changed $339,900 CRMLS
- 2026-05-01 Price Changed $339,900 GEMLS
- 2026-04-16 Price Changed $349,900 GEMLS
- 2026-04-16 Price Changed $349,900 CRMLS
- 2026-04-02 Price Changed $359,900 CRMLS
- 2026-04-02 Price Changed $359,900 GEMLS
- 2026-03-10 Listed $364,900 CRMLS
- 2026-03-08 Price Changed $364,900 GEMLS
- 2026-02-24 Listed $369,900 GEMLS
- 2024-05-21 Sold (Public Records) $335,000 Public Records
- 2024-05-21 Sold (MLS) $335,000 CRMLS
- 2024-05-21 Sold (MLS) $335,000 AVMLS
- 2024-05-01 Relisted — CRMLS
- 2024-04-09 Pending — CRMLS
- 2024-04-09 Contingent — AVMLS
- 2024-03-29 Price Changed $325,000 AVMLS
- 2024-03-29 Relisted — CRMLS
- 2024-03-29 Relisted — AVMLS
- 2024-03-28 Price Changed $325,000 CRMLS
- 2024-03-22 Listing Removed — AVMLS
- 2024-03-21 Listing Removed — CRMLS
- 2024-03-01 Price Changed $339,900 AVMLS
- 2024-03-01 Price Changed $339,900 CRMLS
- 2024-02-10 Relisted — CRMLS
- 2024-02-10 Relisted — AVMLS
- 2024-01-31 Contingent — CRMLS
- 2024-01-31 Pending — AVMLS
- 2024-01-05 Listed $350,000 CRMLS
- 2024-01-05 Listed $350,000 AVMLS
- 2023-10-06 Sold (Public Records) $215,000 Public Records
- 2023-10-06 Sold (MLS) $215,000 AVMLS
- 2023-10-06 Sold (MLS) $215,000 TAAR
- 2023-09-14 Pending — TAAR
- 2023-09-14 Pending — AVMLS
- 2023-07-31 Listed $204,900 AVMLS
- 2023-07-31 Listed $204,900 TAAR
Property tax history
+10.7%/yrLatest (2025): $4,314 · +163.8% YoY. Source: county tax records.
Cash-flow waterfall
monthlySold comps — $/sqft
last 12 mo · ≤1 miLoading sold comps…