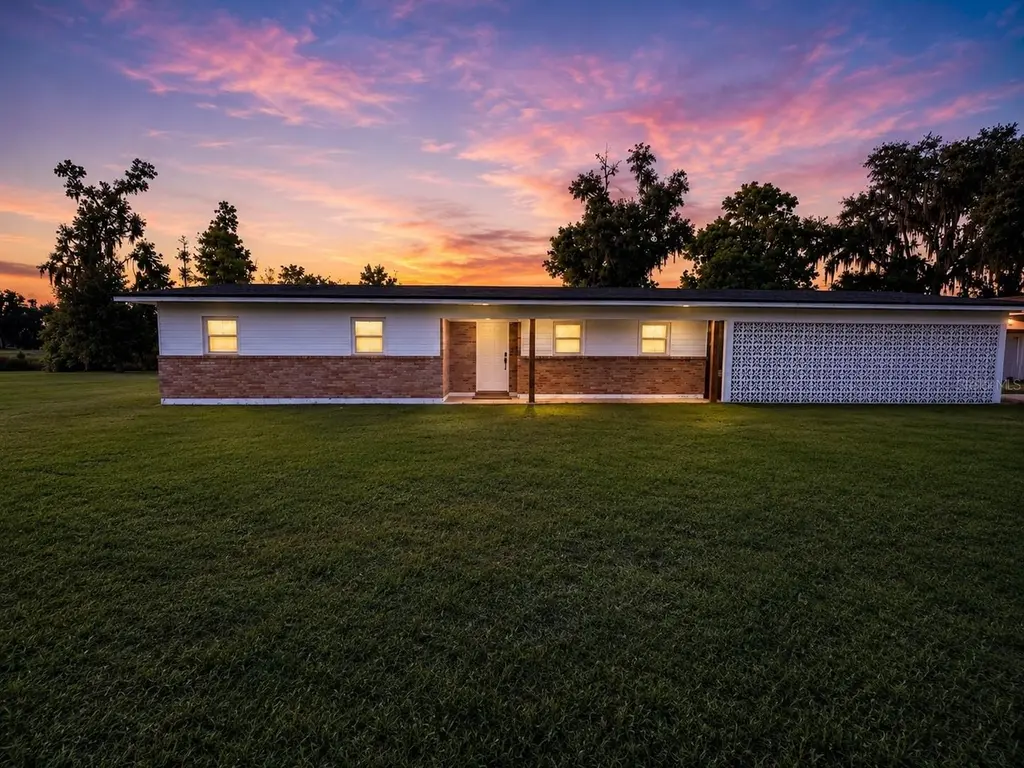
5201 S Farkas Rd · Plant City, FL
Flood risk 1/10 · Minimal
- FEMA flood zone
- X (unshaded)
- Chance of flooding over 30 yrs
- 0.0%
- Est. flood insurance / yr
- $507 – $1,088
Fire risk 5/10 · Moderate
- Est. fire insurance / yr
- $947 – $1,759
Heat risk 9/10 · Severe
- Hot days now (above 108°F)
- 7 days/yr
- Hot days in 30 yrs
- 26 days/yr
Wind risk 10/10 · Severe
- Chance of severe wind over 30 yrs
- 99.0%
Air-quality risk 3/10 · Minor
- Unhealthy air days now
- 3 days/yr
- Unhealthy air days in 30 yrs
- 4 days/yr
Risk factors via First Street. Map © Google.
Why this score? — see what drove the C grade
The composite is a weighted blend of 9 inputs, each scored 0–100. Each bar is that input's sub-score; the figure is the points it added to the 100-point composite (weight × sub-score).
- Cash flow +23.8/30.0
- DSCR +7.7/10.0
- ARV discount +7.5/15.0
- 1% rule +5.5/10.0
- Schools +4.2/10.0
- Livability +3.8/5.0
- Rent growth +2.5/5.0
- Condition / age +2.5/5.0
- Appreciation +0.0/10.0
$475,000
🖨 Deal sheet (PDF) 📄 Offer letter ✓ Due diligence
Listing remarks
Under contract-accepting backup offers. Move-in ready ranch-style home on nearly 1 acre with NO HOA and an incredible oversized detached shop! Conveniently located in Plant City with easy highway access and walking distance to schools, this property offers the perfect balance of country living and everyday convenience. Enjoy peaceful views as the property backs up to farmland with no rear neighbors. This 4 bedroom, 2 bathroom home features an extra-large living room, a bonus room/flex space perfect for an office, playroom, or additional living area, and LVP flooring throughout. Major updates have already been completed, including new roof (2025), AC (2022), interior paint (2022) exterior pa
Key facts
- Backs up to farmland
- Easy highway access
- New roof
Tags
Property features AI
Finance
- Other: Homestead status indicated; Zoned ASC-1
- Financial info: No lease restrictions indicated
- HOA & community: No HOA/association; Golf carts allowed; Pets allowed
Exterior
- Parking: Attached garage (3 garage spaces); Additional garage space and workshop in garage; Carport (2 spaces); Covered parking; Driveway parking; Oversized and tandem parking; Guest parking; Open parking and parking pad; RV/boat access and parking, RV garage and RV carport; Golf cart garage and golf cart parking; Ground-level garage; garage faces rear and side
- Security: Fire alarm; Security fencing/lighting/alarms; Security lights; Smoke detectors
- Utilities: Private well water; Septic tank sewer; Electricity connected; Water connected; Cable available and connected
- Home design: Single family residence; One level; Completed condition; East-facing
- Construction: Block, brick and stucco construction; Shingle roof; Slab foundation; Built structures total per public records
- Exterior features: Front, side, rear porches and patio; Fire pit; French doors; Private mailbox; Storage; Barn(s), workshop and other outbuildings; Mature landscaping with oak trees and wooded areas; Cleared, level, oversized and private lot; Paved road access (public maintained)
Interior
- Kitchen: Cooktop; Dishwasher; Exhaust fan; Freezer; Ice maker; Microwave; Range; Refrigerator
- Bedrooms: 4 bedrooms
- Flooring: Tile
- Bathrooms: 2 full bathrooms
- Heating & cooling: Central heating (electric); Central air conditioning
- Interior features: Ceiling fans; Dry bar; Eat-in kitchen area; Kitchen/family room combo; Living and dining room combo; Open floor plan; Solid surface counters; Solid wood cabinets; Thermostat; Window treatments
- Laundry & utility: Inside laundry room with washer and electric dryer hookups; Inside utility
Neighborhood map
What this means for you Summary
Snapshot
- This is a 4-bed/2.0-bath single-family listed at $475k.
Deal economics
- At list price, monthly cash flow is $910 ($11k/yr) — positive.
- The deal already cash-flows at list — no discount required.
- Meets the 1% rule at list price ($5k rent vs $475k).
Location & tenants
- Location reads 76/100 on livability (#227 in FL, #3,587 nationally) — a middle-class / working-renter tenant base. Strengths: amenities A+, cost of living A+, housing A+; Watch: employment C-, commute F.
- Hillsborough (suburban): math 47% / reading 50% proficiency, ranked #41 of 73 in FL (top 56%) — families likely to look elsewhere, expect single-tenant / working-renter base with shorter leases.
- Zoned schools: Robinson Elementary School (math 42% / reading 39%, grade F, #1,471 of 2,144 statewide, top 69%, 562 students, 78% FRL) — zoned schools average 78% FRL vs 52% district-wide (26 pts higher); higher-poverty schools than district average — tighter screening recommended.
- Market conditions: 69 active listings in the ZIP; 1 comparable units currently listed for rent nearby; 9,053 units permitted in Hillsborough County in 2024 (4,555 in 5+ unit buildings).
Forward outlook
- Local home prices are declining (-3.0%/yr); year-one equity from $3k of loan paydown is wiped out by about $14k of value loss. Plan a longer hold.
- Hillsborough County population projected at +37% by 2050 — long-run rental-demand tailwind backs the buy-and-hold thesis.
Negotiation context
- Only 11 days on market — expect competitive offers; lowballing is unlikely to land.
- Current owner paid $190k; list at $475k implies a 150% gain — meaningful room to come down on a strong offer.
Risks & watch-outs
- Climate carrying-cost: severe wind risk, 99% chance of damaging wind over 30y; moderate wildfire risk; extreme-heat days projected 7→26/yr by 2055 (HVAC capex compounding) — expect insurance premiums to compound above CPI over the hold.
Questions for the listing agent
- Built in 1962 — when were the roof, HVAC, electrical panel, plumbing, and water heater last replaced?
- Is there a deadline driving the sale (1031 exchange, divorce, estate, relocation)? That informs how much negotiation room exists.
- Schools are D-rated, which usually means shorter tenancies and higher turnover. Who's the typical renter profile here, and what's been the actual vacancy rate?
- What's the average days-on-market for RENTAL listings here right now (not sales)? A rising rental-DOM trend means longer vacancies and softer asking-rent achievability than the comps imply.
- What's the recent tenant-quality profile in this submarket — average credit score on applications, eviction rate, late-payment / NSF rate, and stable-employment percentage? A property-management company in the area should have these aggregated.
- How much new for-sale + rental construction is in the pipeline within 1–3 miles? Heavy new supply typically softens prices + rents 12–24 months out; constrained supply supports both.
Investment metrics
- 1% rule
- 1.05% ✓
- Cap rate
- 8.59%
- Cash-on-cash
- 8.21%
- DSCR
- 1.37
- GRM
- 7.9
CMA / ARV
No comps found within radius.
Projected returns pro-forma
-3.0% appreciation · 3.0% rent growth · sell at horizon
- IRR
- -3.8%
- Equity multiple
- 0.86×
- Total profit
- $-19,076
- Equity at exit
- $70,824
- IRR
- 5.8%
- Equity multiple
- 1.43×
- Total profit
- $57,733
- Equity at exit
- $41,069
Cash invested: $133,000 (down + closing). Projections, not guarantees.
Landlord ↔ Tenant lean methodology
- Overall (STATE)
- 87 Strongly Landlord-Friendly
- State Florida
- 87 Strongly Landlord-Friendly · R+3
- County
- — inherits STATE
- City
- — inherits STATE
ZIP-level market 33567
- Home prices YoY
- -13.4%
- Active inventory
- 69
- Price-to-rent
- 7.9×
Monthly cashflow live
- Estimated rent
- $5,000 medium interval (Pro) →
- Mortgage (P&I)
- −$2,491
- Tax from tax record
- −$351 /mo · $4,212/yr
- Insurance
- −$198
- HOA
- −$0
- Vacancy / Maint / Mgmt
- −$1,050
- Net cashflow
- $910
Break-even live
Sensitivity live
| Price | -10% $1,179 | -5% $1,045 | +0% $910 | +5% $776 | +10% $641 |
|---|---|---|---|---|---|
| Rent | -10% $515 | -5% $713 | +0% $910 | +5% $1,108 | +10% $1,305 |
| Rate | -1.0pp $1,149 | -0.5pp $1,031 | base $910 | +0.5pp $787 | +1.0pp $662 |
UW: 25.0% down · 7.5% · 30yr · 1.5% tax · 5.0% vac · 8.0% maint · 8.0% mgmt
Financing live
Cash to close
- Down payment
- $118,750
- Closing costs
- $14,250
- Reserves months
- —
- Total cash needed
- —
Loan-product check · same deal, 3 products live
Conventional
25% down · 7.5% · 30yr
- Down + closing
- —
- Monthly P&I
- —
- Monthly cashflow
- —
- DSCR
- —
- Eligible?
- —
Personal DTI + credit; lowest rate.
DSCR
20% down · 8.5% · 30yr
- Down + closing
- —
- Monthly P&I
- —
- Monthly cashflow
- —
- DSCR
- —
- Eligible?
- —
No personal income docs; deal must DSCR.
Hard money
10% down · 12.0% · 12mo
- Down + closing
- —
- Monthly P&I
- —
- Monthly cashflow
- —
- DSCR
- —
- Eligible?
- —
Short-term bridge; refi at stabilization.
Rent comps 1 comps
| Address | Beds | Baths | Sqft | Rent | $/sqft | DOM | Units | Dist |
|---|---|---|---|---|---|---|---|---|
| 5302 Turkey Creek Rd Plant City, FL | 5.0 | 4.0 | 2490 | $5,000 | $2.01 | 25d | 1 | 0.34mi |
Listing history 8 events
-
2026-06-13statusdays on market $475,000 Pending 11 DOM
-
2026-06-09days on market $475,000 Active 8 DOM
-
2026-06-08days on market $475,000 Active 7 DOM
-
2026-06-07days on market $475,000 Active 6 DOM
-
2026-06-04days on market $475,000 Active 3 DOM
-
2026-06-03days on market $475,000 Active 2 DOM
-
2026-06-02remarks 699-char remark
-
2026-06-02$475,000 Active 1 DOM
ⓘ Source: listings_history table (triggers on properties + properties_extension) + one-shot
backfill from property_details.listing_events for pre-trigger history.
Tax reassessment forecast FL · Resets to sale price
- Current annual tax
- $4,212 · $351/mo
- Projected year-2 tax
- $4,212 · $351/mo
- Expected delta
- $0/yr ($0/mo · 0.0%)
ⓘ Screening estimate from a state-policy table — verify with the county assessor before closing.
Climate risk First Street
- Flood 1/10 Low FEMA zone X (unshaded) · 0% chance over 30 yrs
- Wildfire 5/10 Major
- Heat 9/10 Extreme 7 d/yr ≥108°F today · 26 d/yr by 30 yrs out
- Wind 10/10 Extreme 99% chance of damaging wind over 30 yrs
- Air quality 3/10 Moderate 3 unhealthy d/yr today · 4 by 30 yrs out
Nearby sold comps map
Loading sold comps map…
Walkable amenities ~0.75 mi
Loading nearby amenities…
Taxation est. · year 1
- Rental income
- $60,000
- − Mortgage interest
- −$26,607
- − Property taxes
- −$4,212
- − Insurance
- −$2,375
- − Repairs & maintenance
- −$4,800
- − Management
- −$4,800
- − Depreciation
- −$13,818
- Taxable income
- $3,388
- Est. tax owed @ 24.0%
- −$813
- After-tax cash flow
- $10,109/yr
For passive investors: Depreciation is non-cash, so a rental often shows a tax loss while cash-flowing — sheltering income. Rental losses are passive: they offset passive income freely, and up to $25,000/yr can offset ordinary (W-2) income if you actively participate and your MAGI is under $100k (phasing out to $0 by $150k); unused losses carry forward. On sale, claimed depreciation is recaptured at up to 25%, and gains may owe capital-gains tax (a 1031 exchange can defer both). Figures are a year-1 estimate at your 24.0% rate — not tax advice; consult a CPA.
Schools (NCES district)
- District
- Hillsborough
- NCES district ID
- 1200870
- Math proficiency
- 47% ▼ -8.00%
- Reading proficiency
- 50% ▼ -4.00%
- Median HH income
- $50,622
- Composite
- 41.6/100
- National rank
- #3435
- State rank
- #41 of 73 in FL
Livability — Plant City
- Score
- 76/100
- State rank
- #227
- US rank
- #3587
Category grades
Schools grade is shown separately in the Schools card above.
Census & demographics
- City population
- 68,525
- Population (ZIP)
- 12,292
Population outlook (Hillsborough County) Hauer SSP2
- Today (2025)
- 1,607,022 people
- By 2030
- 1,733,968 · +7.9%
- By 2040
- 1,979,565 · +23.2%
- By 2050
- 2,203,427 · +37.1%
- By 2075
- 2,667,893 · +66.0%
- By 2100
- 2,891,558 · +79.9%
Race, ethnicity, and origin ACS 2023
- Neighborhood character
- Diverse neighborhood (Simpson 0.62)
- Race & ethnicity
- White 52% Hispanic / Latino 29% Black 15% Two or more races 9% Asian 1%
- Hispanic origin (detail)
- Mexican 19% Puerto Rican 5% Cuban 1%
- Common ancestry
- Romanian 2% Slovak 2% Lithuanian 1%
- Foreign-born
- 16% · Canada, Vietnam
- Languages at home
- 75% English-only · Spanish 20%
Political lean MEDSL · Hillsborough
- 2024 margin
- Toss-up / Even · D 47.8% · R 50.9% · Other 1.3%
- 2008→2024 swing
- -10.2pp toward R · 2008: 7.1pp · 2024: -3.1pp
- All cycles
- 2024: R+3.1 2020: D+6.9 2016: D+6.8 2012: D+6.7 2008: D+7.1
Not yet ingested
- Civics
- —
Market trends
- HPI YoY
- ▼ -56.70%
- Current HPI
- 365.0108
- Rent YoY
- —
- Metro
- —
- State GDP YoY
- ▲ 3.28%
- F500 in state
- 36
Industry mix (Fortune 500 HQ in FL)
| Industry | F500 HQs | Revenue |
|---|---|---|
| Industrial Technology | 2 | $29B |
|
||
| Insurance | 2 | $17B |
|
||
| Retail | 1 | $60B |
|
||
| Technology Distribution | 1 | $58B |
|
||
| Homebuilding | 1 | $35B |
|
||
| Technology Manufacturing | 1 | $35B |
|
||
Price history
+150.0% since first listed2 events — show timeline
- 2026-05-31 Listed $475,000 Stellar MLS as Distributed by MLS Grid
- 2021-06-10 Sold (Public Records) $190,000 Public Records
Property tax history
+8.3%/yrLatest (2025): $4,212 · +8.8% YoY. Source: county tax records.
Cash-flow waterfall
monthlySold comps — $/sqft
last 12 mo · ≤1 miLoading sold comps…